| Param | Original file | Final file |
|---|---|---|
| Filename | modeM0/AS1A14_083T14_9000006564_56897cztM0_level2.fits | modeM0/AS1A14_083T14_9000006564_56897cztM0_level2_quad_clean.evt |
| Size (bytes) | 463,772,160 | 85,279,680 |
| Size | 442.3 MB | 81.3 MB |
| Events in quadrant A | 4,613,706 | 519,878 |
| Events in quadrant B | 3,122,435 | 617,109 |
| Events in quadrant C | 3,176,766 | 557,714 |
| Events in quadrant D | 5,782,259 | 463,833 |
| Mode SS | |||
|---|---|---|---|
| Quadrant | BADHDUFLAG | Total packets | Discarded packets |
| A | 0 | 124 | 0 |
| B | 0 | 124 | 0 |
| C | 0 | 124 | 0 |
| D | 0 | 124 | 0 |
| Mode M9 | |||
|---|---|---|---|
| Quadrant | BADHDUFLAG | Total packets | Discarded packets |
| A | 0 | 10 | 0 |
| B | 0 | 10 | 0 |
| C | 0 | 10 | 0 |
| D | 0 | 10 | 0 |
| Mode M0 | |||
|---|---|---|---|
| Quadrant | BADHDUFLAG | Total packets | Discarded packets |
| A | 0 | 18296 | 1 |
| B | 0 | 13895 | 1 |
| C | 0 | 13377 | 2 |
| D | 0 | 21452 | 1 |
| Quadrant | Total seconds | Saturated seconds | Saturation percentage |
|---|---|---|---|
| A | 6066 | 874 | 14.408177% |
| B | 6066 | 205 | 3.379492% |
| C | 6066 | 118 | 1.945269% |
| D | 6066 | 959 | 15.809430% |
Noise dominated data is calculated using 1-second bins in cleaned event files. If a bin has >2000 counts, and if more than 50% of those come from <1% of pixels, then it is considered to be noise-dominated and hence unusable.
| Quadrant | # 1 sec bins | Bins with >0 counts | Bins with >2000 counts | High rate bins dominated by noise | Noise dominated (total time) | Noise dominated (detector-on time) | Marked lightcurve |
|---|---|---|---|---|---|---|---|
| A | 7096 | 6066 | 620 | 620 | 8.74% | 10.22% | 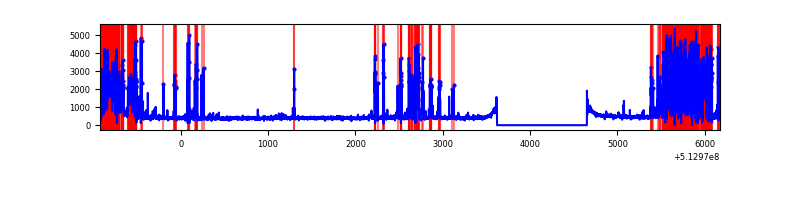 |
| B | 7096 | 6067 | 79 | 79 | 1.11% | 1.30% | 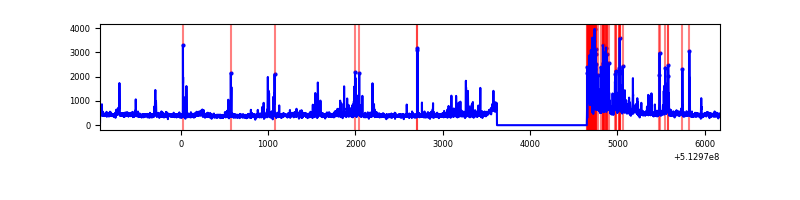 |
| C | 7096 | 6067 | 40 | 40 | 0.56% | 0.66% | 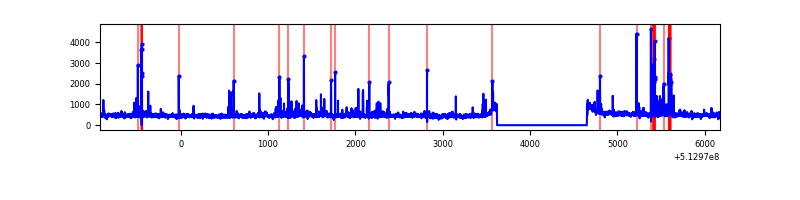 |
| D | 7096 | 6067 | 829 | 829 | 11.68% | 13.66% | 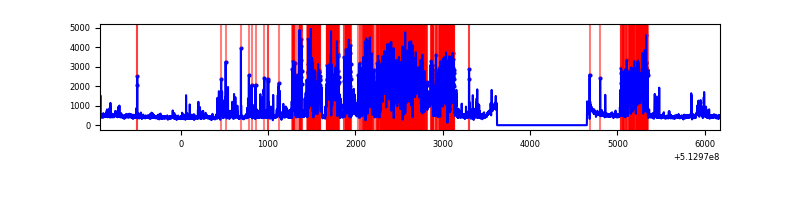 |
Top three noisy pixels from each quadrant. If the there are fewer than three noisy pixels in the level2.evt file, extra rows are filled as -1
| Pixel properties | Quadrant properties | ||||||
|---|---|---|---|---|---|---|---|
| Quadrant | DetID | PixID | Counts | Sigma | Mean | Median | Sigma |
| A | 7 | 64 | 1937695 | 13191.82 | 590 | 574 | 146.8 |
| A | 3 | 62 | 280096 | 1903.55 | 590 | 574 | 146.8 |
| A | 3 | 14 | 43061 | 289.33 | 590 | 574 | 146.8 |
| B | 10 | 16 | 407298 | 3043.62 | 623 | 600 | 133.6 |
| B | 0 | 245 | 41300 | 304.59 | 623 | 600 | 133.6 |
| B | 10 | 247 | 34062 | 250.42 | 623 | 600 | 133.6 |
| C | 1 | 16 | 354785 | 2064.29 | 626 | 621 | 171.6 |
| C | 13 | 3 | 95722 | 554.31 | 626 | 621 | 171.6 |
| C | 1 | 12 | 92942 | 538.11 | 626 | 621 | 171.6 |
| D | 8 | 160 | 1481945 | 8852.79 | 590 | 562 | 167.3 |
| D | 2 | 249 | 1363191 | 8143.11 | 590 | 562 | 167.3 |
| D | 8 | 240 | 215733 | 1285.87 | 590 | 562 | 167.3 |
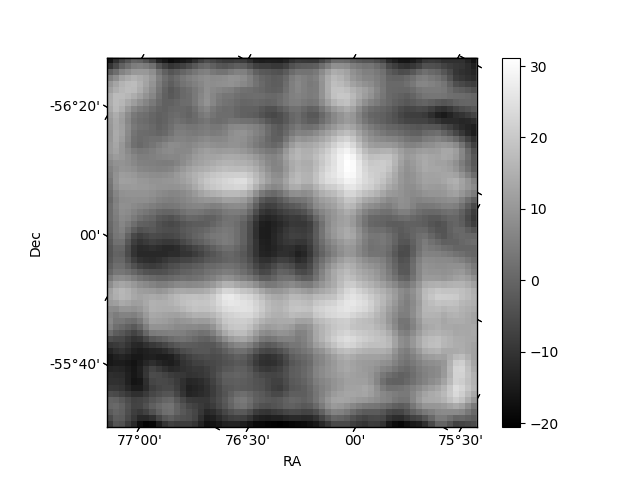
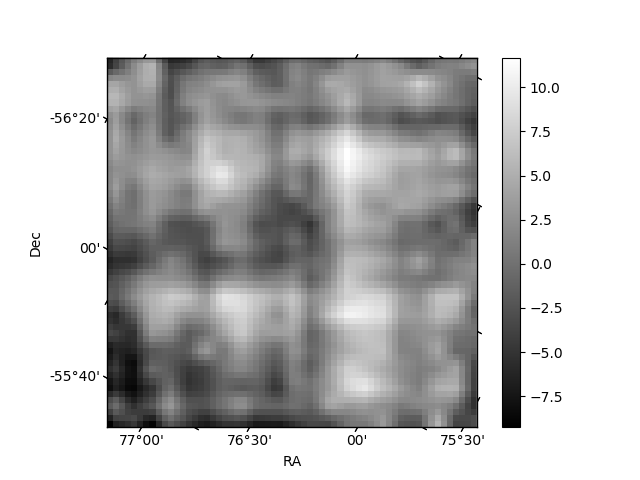
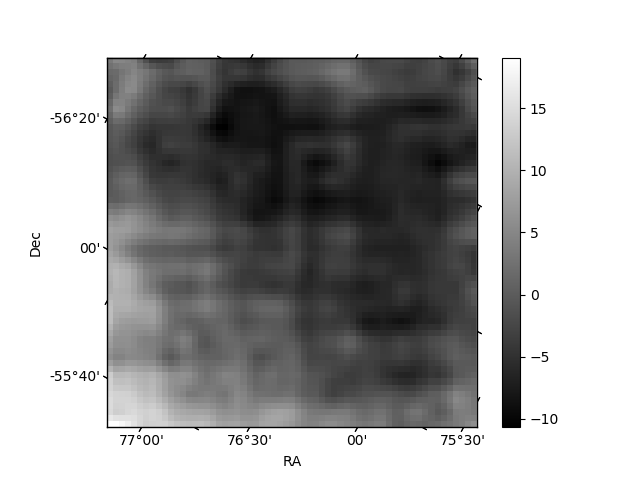
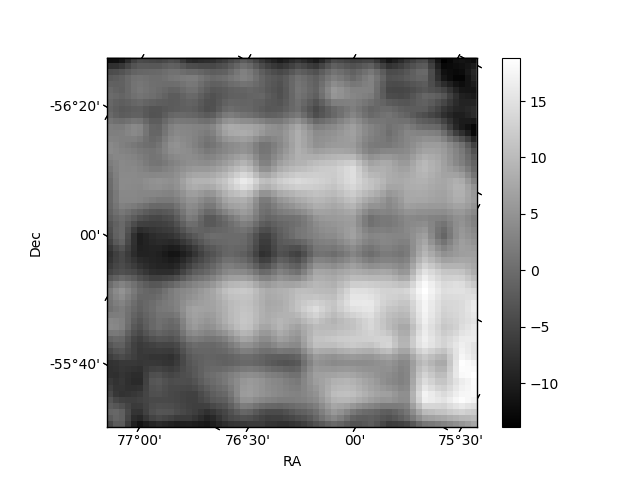
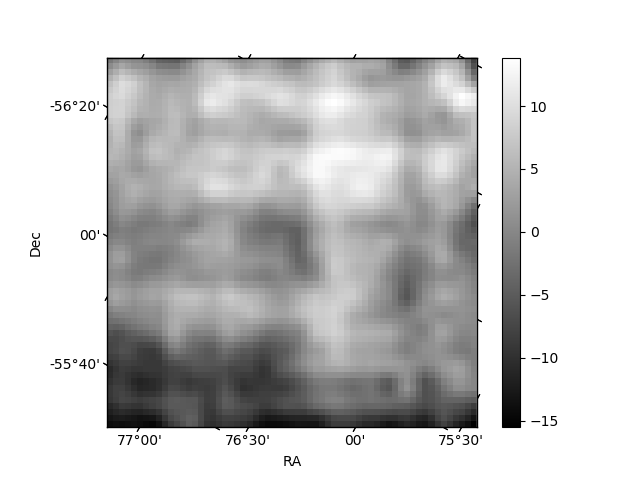
Histogram calculated using DETX and DETY for each event in the final _common_clean file
| Quadrant A | 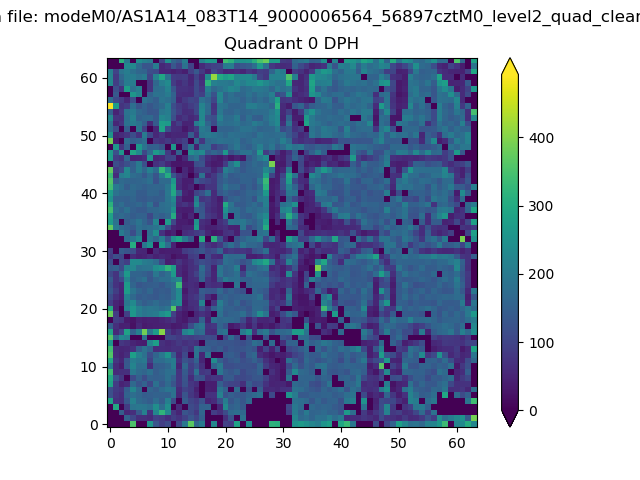 |
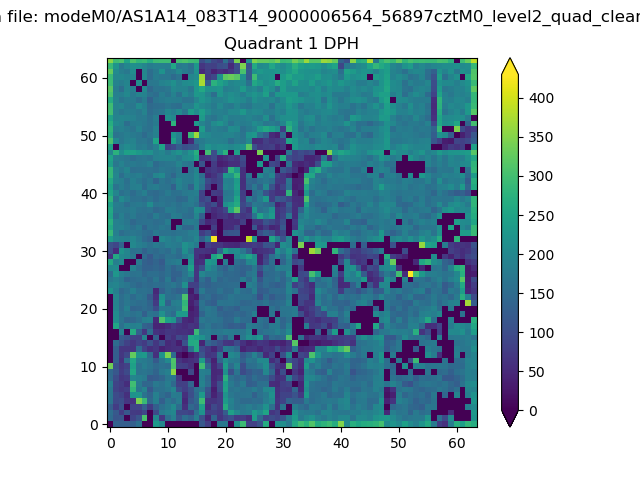 |
Quadrant B |
|---|---|---|---|
| Quadrant D | 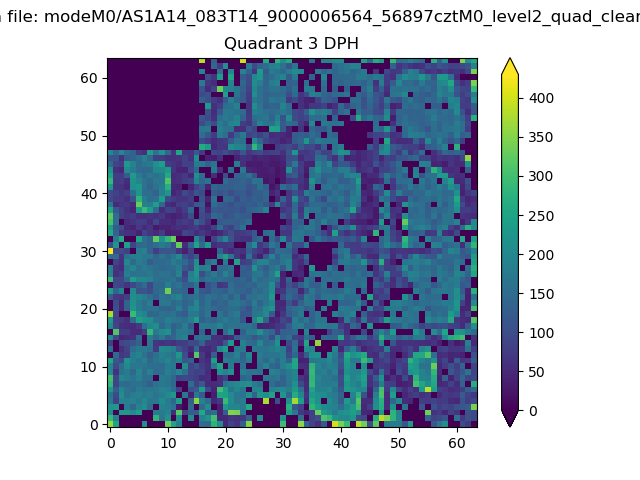 |
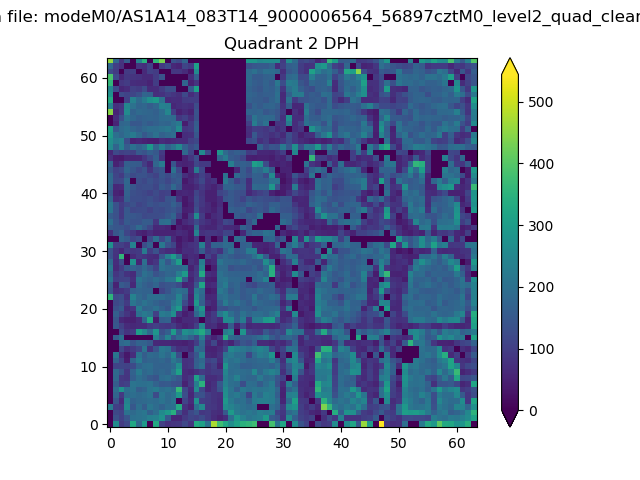 |
Quadrant C |
| Plot type | Count rate plots | Images |
|---|---|---|
| Comparison with Poisson distribution Blue bars denote a histogram of data divided into 1 sec bins. Red curve is a Poisson curve with rate = median count rate of data. |
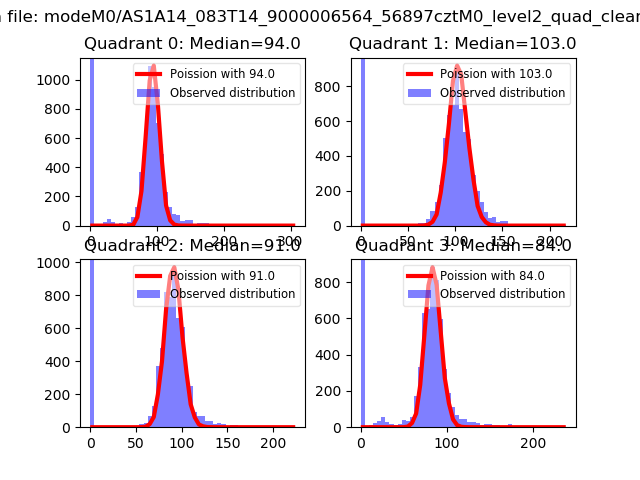 |
 |
| Quadrant-wise count rates Data is divided into 100 sec bins |
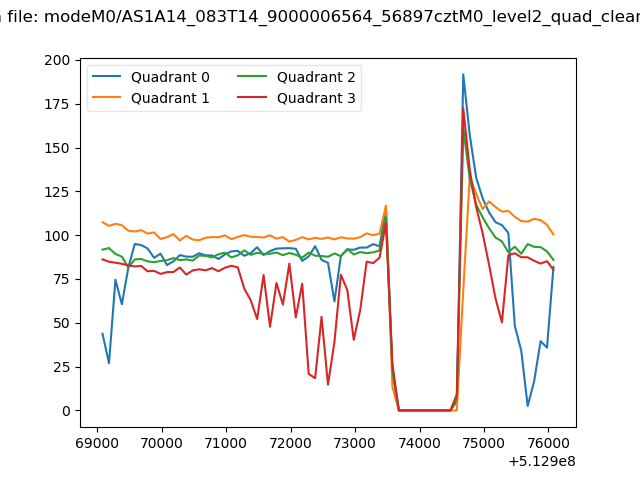 |
|
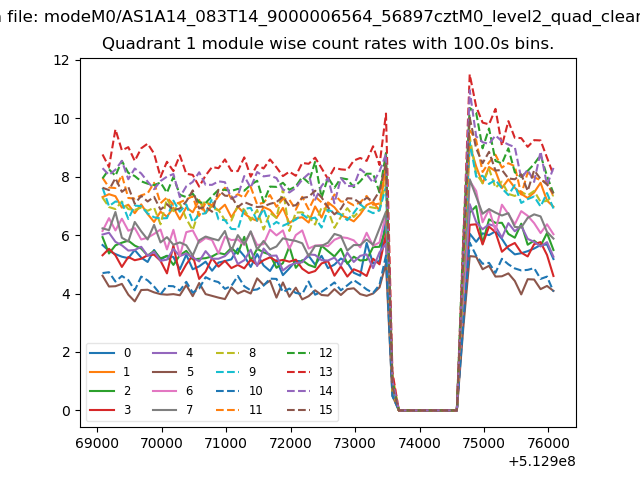
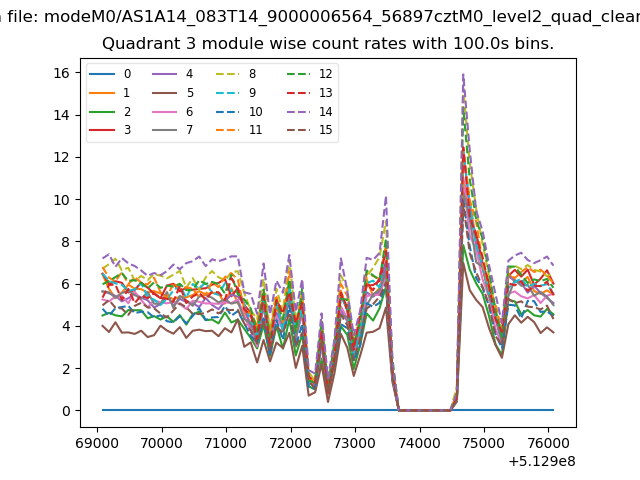
| Module-wise count rates for Quadrant A Data is divided into 100 sec bins |
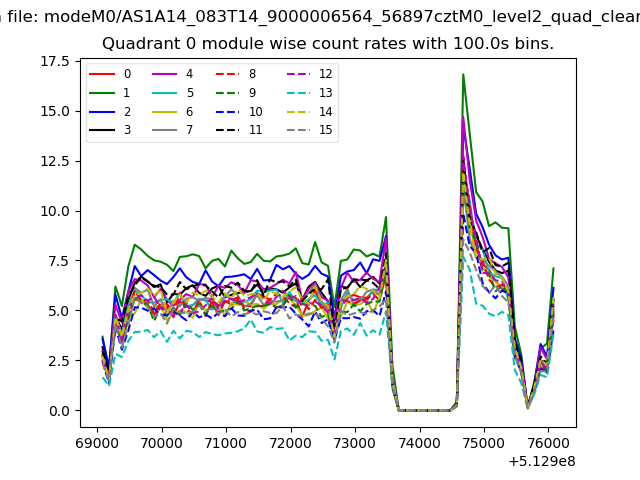 |
 |
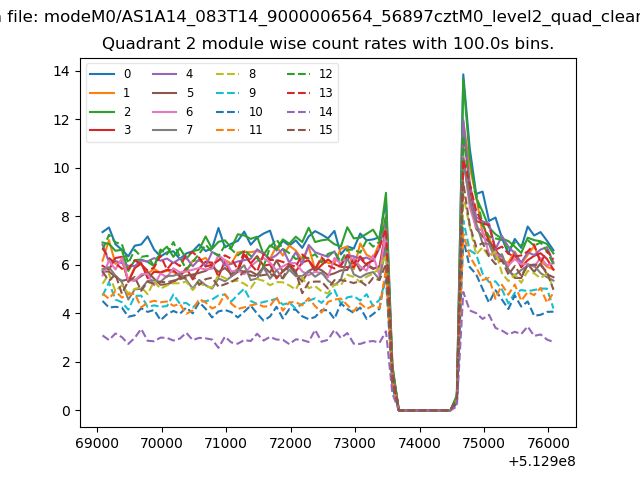
| Module-wise count rates for Quadrant B Data is divided into 100 sec bins |
 |
 |
| Module-wise count rates for Quadrant C Data is divided into 100 sec bins |
 |
 |
| Module-wise count rates for Quadrant D Data is divided into 100 sec bins |
 |
 |
| Parameter | Plot |
|---|---|
| CZT HV Monitor | 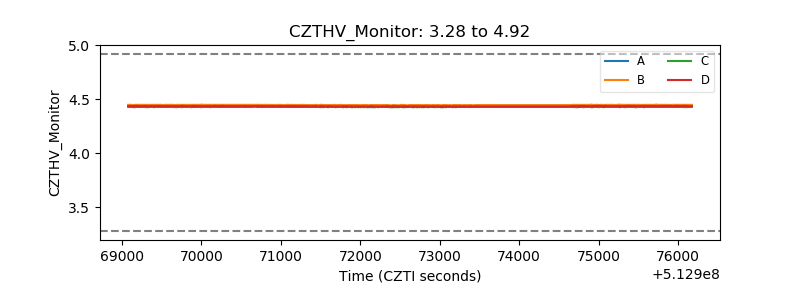 |
| D_VDD | 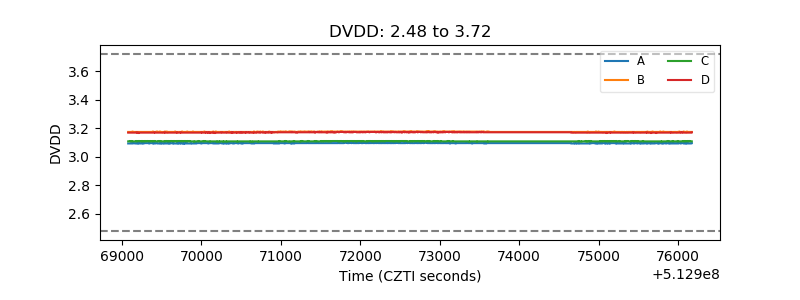 |
| Temperature 1 | 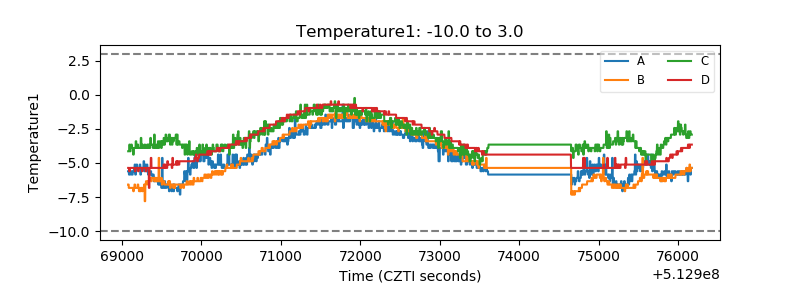 |
| Veto HV Monitor | 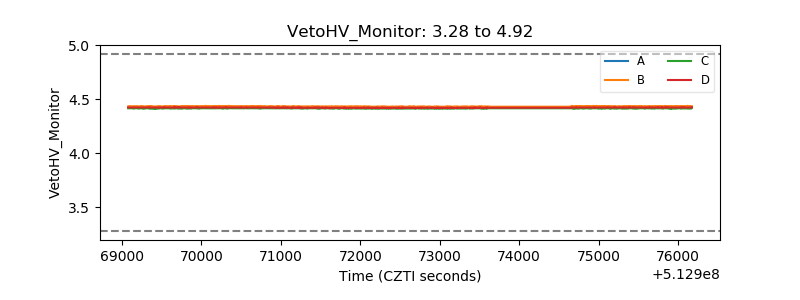 |
| Veto LLD | 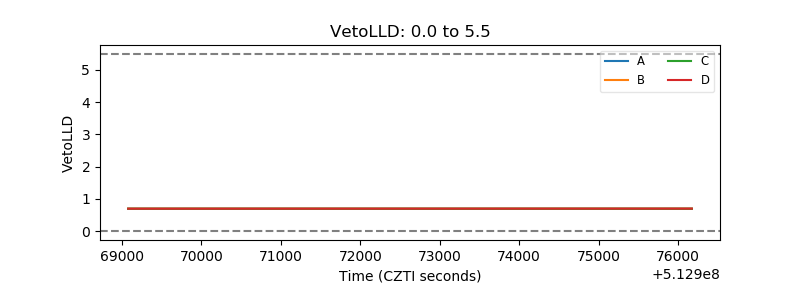 |
| Alpha Counter | 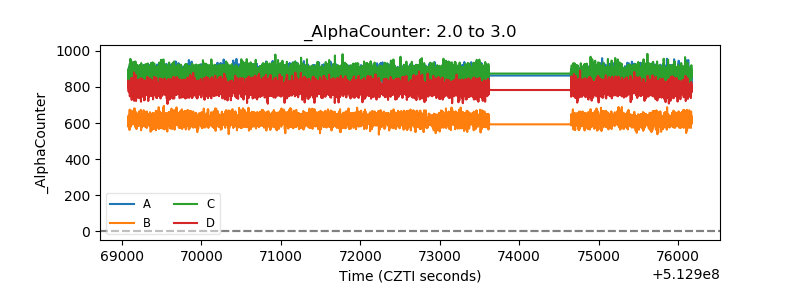 |
| _CPM_Rate | 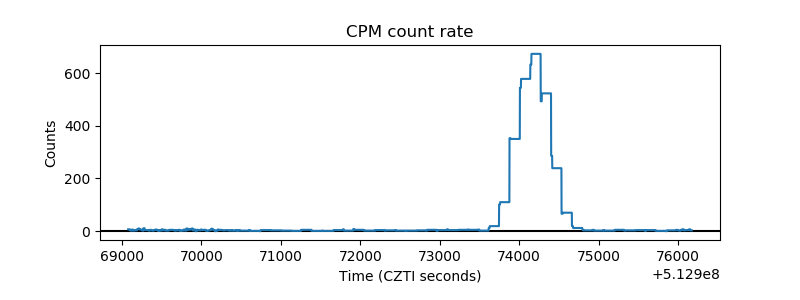 |
| CZT Counter | 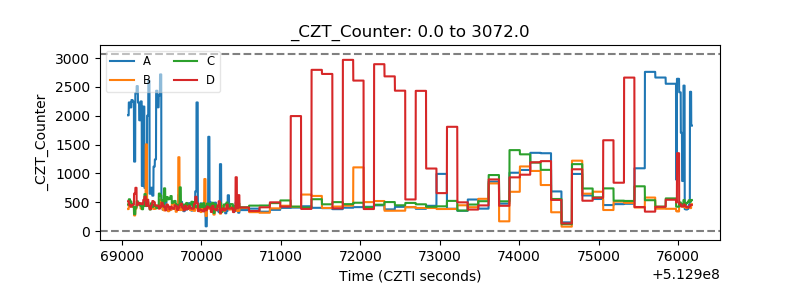 |
| +2.5 Volts monitor | 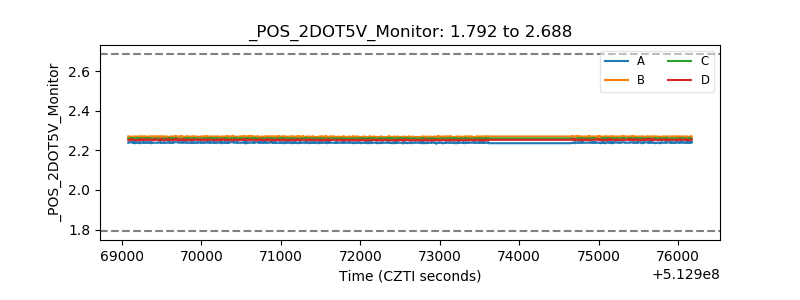 |
| +5 Volts monitor | 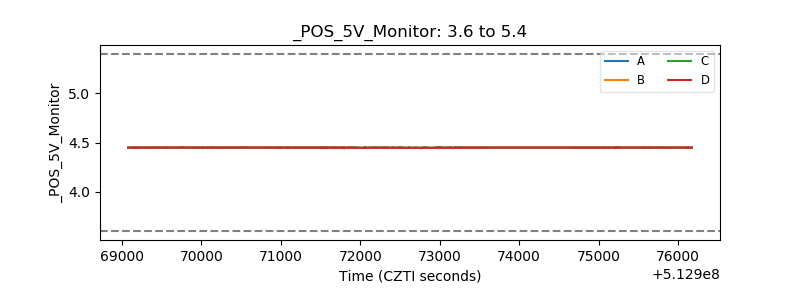 |
| _ROLL_ROT | 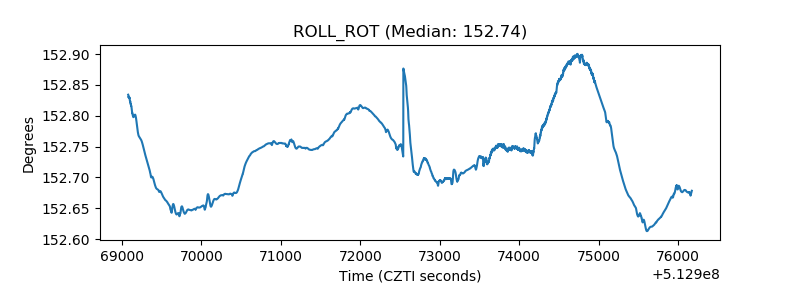 |
| _Roll_DEC | 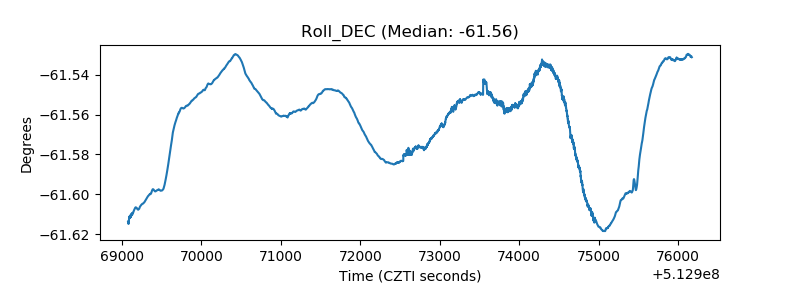 |
| _Roll_RA | 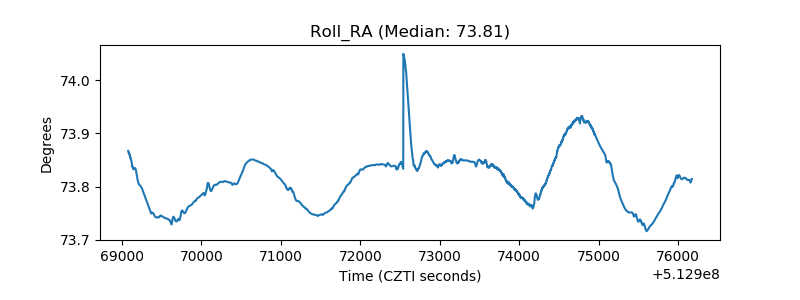 |
| Veto Counter | 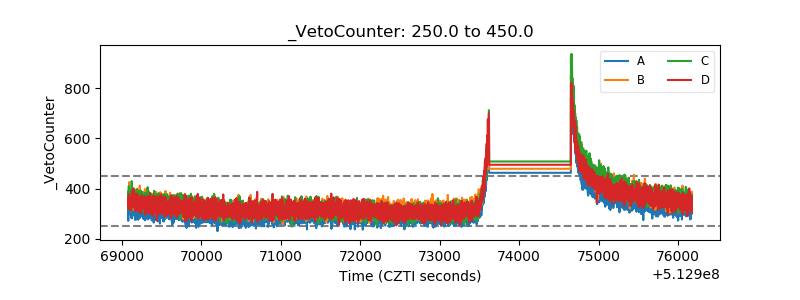 |