| Param | Original file | Final file |
|---|---|---|
| Filename | modeM0/AS1A14_083T14_9000006564_56898cztM0_level2.fits | modeM0/AS1A14_083T14_9000006564_56898cztM0_level2_quad_clean.evt |
| Size (bytes) | 496,313,280 | 90,377,280 |
| Size | 473.3 MB | 86.2 MB |
| Events in quadrant A | 4,946,298 | 538,340 |
| Events in quadrant B | 3,869,020 | 648,051 |
| Events in quadrant C | 3,916,220 | 590,159 |
| Events in quadrant D | 5,152,990 | 522,848 |
| Mode SS | |||
|---|---|---|---|
| Quadrant | BADHDUFLAG | Total packets | Discarded packets |
| A | 0 | 126 | 0 |
| B | 0 | 126 | 0 |
| C | 0 | 126 | 0 |
| D | 0 | 126 | 0 |
| Mode M9 | |||
|---|---|---|---|
| Quadrant | BADHDUFLAG | Total packets | Discarded packets |
| A | 0 | 11 | 0 |
| B | 0 | 11 | 0 |
| C | 0 | 11 | 0 |
| D | 0 | 11 | 0 |
| Mode M0 | |||
|---|---|---|---|
| Quadrant | BADHDUFLAG | Total packets | Discarded packets |
| A | 0 | 19286 | 1 |
| B | 0 | 15917 | 2 |
| C | 0 | 15628 | 1 |
| D | 0 | 19537 | 1 |
| Quadrant | Total seconds | Saturated seconds | Saturation percentage |
|---|---|---|---|
| A | 6269 | 1030 | 16.430053% |
| B | 6268 | 330 | 5.264837% |
| C | 6269 | 172 | 2.743659% |
| D | 6269 | 513 | 8.183123% |
Noise dominated data is calculated using 1-second bins in cleaned event files. If a bin has >2000 counts, and if more than 50% of those come from <1% of pixels, then it is considered to be noise-dominated and hence unusable.
| Quadrant | # 1 sec bins | Bins with >0 counts | Bins with >2000 counts | High rate bins dominated by noise | Noise dominated (total time) | Noise dominated (detector-on time) | Marked lightcurve |
|---|---|---|---|---|---|---|---|
| A | 7369 | 6269 | 700 | 700 | 9.50% | 11.17% | 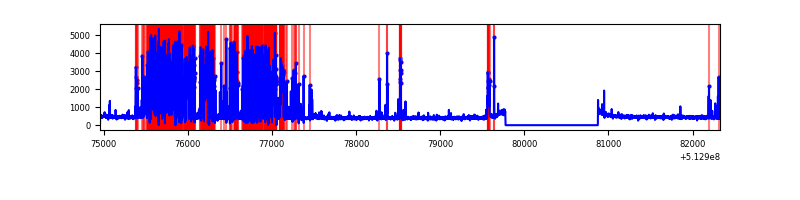 |
| B | 7368 | 6268 | 154 | 154 | 2.09% | 2.46% | 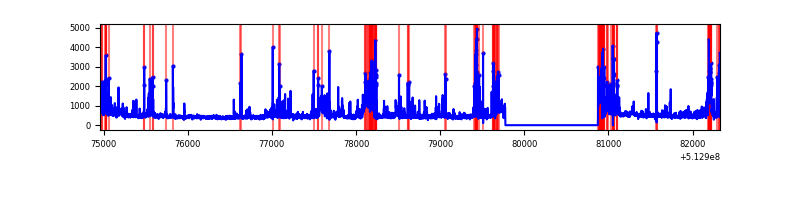 |
| C | 7369 | 6270 | 142 | 142 | 1.93% | 2.26% | 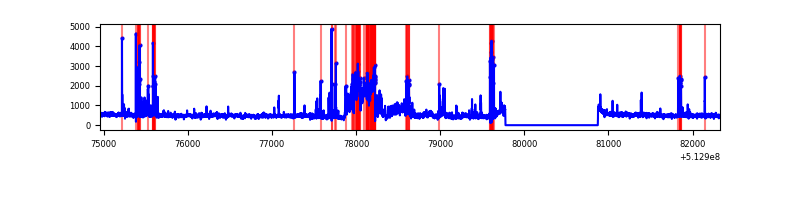 |
| D | 7369 | 6270 | 441 | 441 | 5.98% | 7.03% | 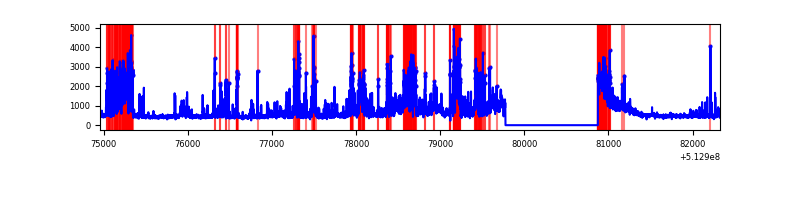 |
Top three noisy pixels from each quadrant. If the there are fewer than three noisy pixels in the level2.evt file, extra rows are filled as -1
| Pixel properties | Quadrant properties | ||||||
|---|---|---|---|---|---|---|---|
| Quadrant | DetID | PixID | Counts | Sigma | Mean | Median | Sigma |
| A | 7 | 64 | 2341102 | 15227.14 | 613 | 599 | 153.7 |
| A | 0 | 250 | 66696 | 430.02 | 613 | 599 | 153.7 |
| A | 3 | 62 | 53520 | 344.3 | 613 | 599 | 153.7 |
| B | 5 | 185 | 578085 | 4092.89 | 653 | 628 | 141.1 |
| B | 10 | 16 | 335852 | 2376.0 | 653 | 628 | 141.1 |
| B | 5 | 172 | 87233 | 613.84 | 653 | 628 | 141.1 |
| C | 9 | 38 | 634707 | 3530.89 | 656 | 650 | 179.6 |
| C | 1 | 16 | 259174 | 1439.65 | 656 | 650 | 179.6 |
| C | 13 | 3 | 241260 | 1339.89 | 656 | 650 | 179.6 |
| D | 2 | 249 | 725816 | 4066.7 | 633 | 605 | 178.3 |
| D | 15 | 142 | 617602 | 3459.88 | 633 | 605 | 178.3 |
| D | 8 | 160 | 456029 | 2553.84 | 633 | 605 | 178.3 |
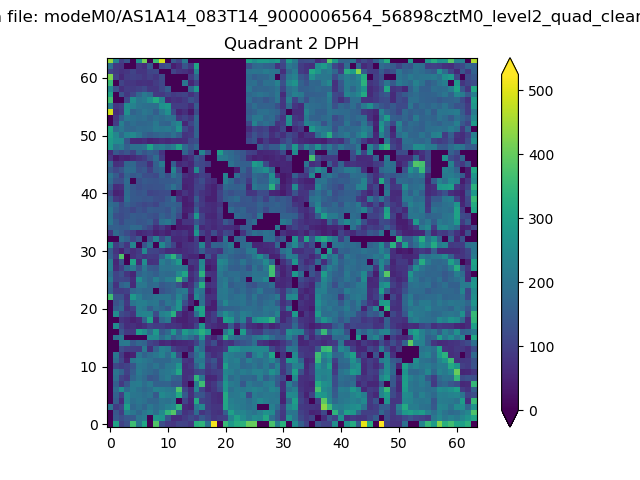
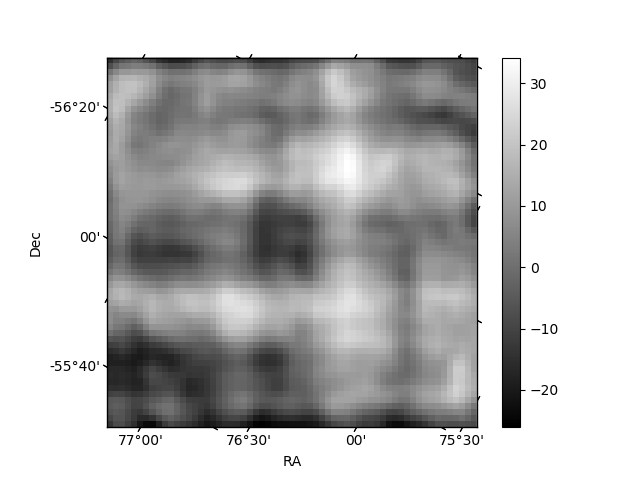
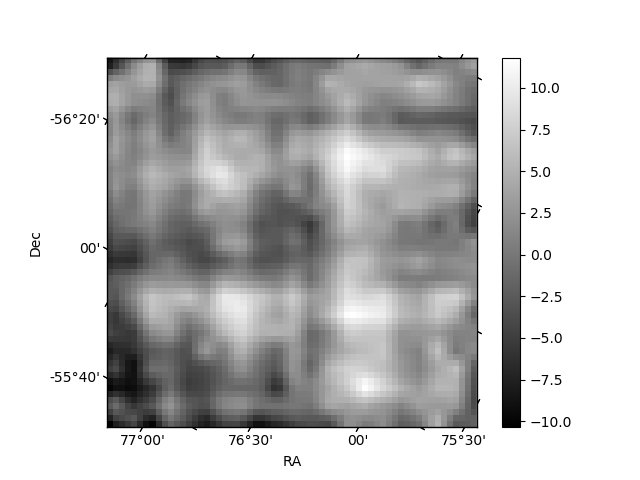
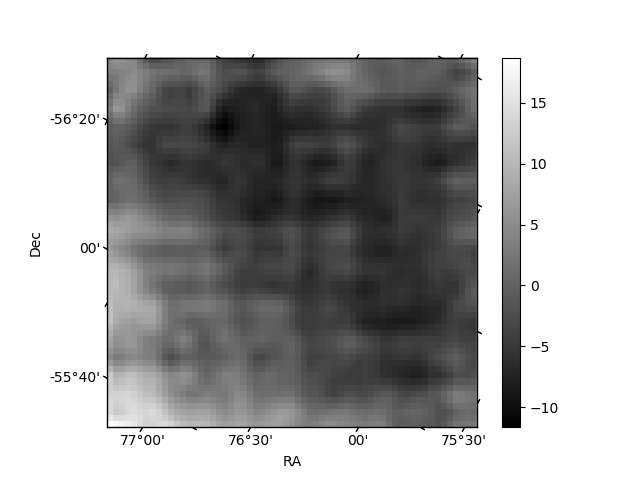
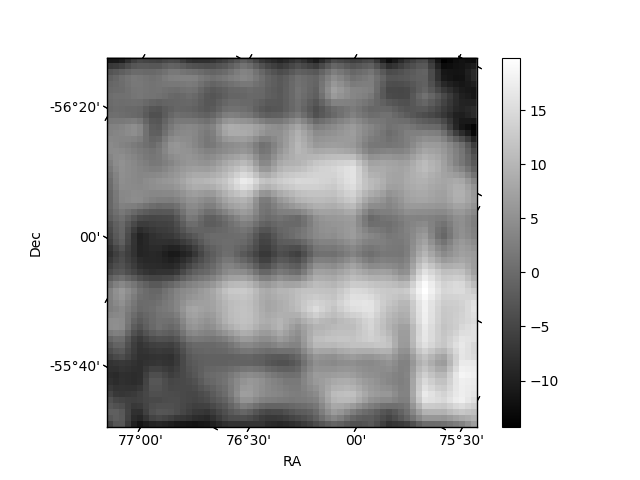
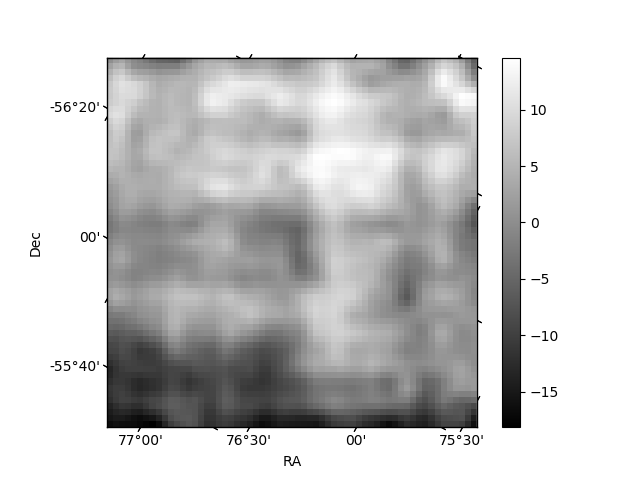
Histogram calculated using DETX and DETY for each event in the final _common_clean file
| Quadrant A | 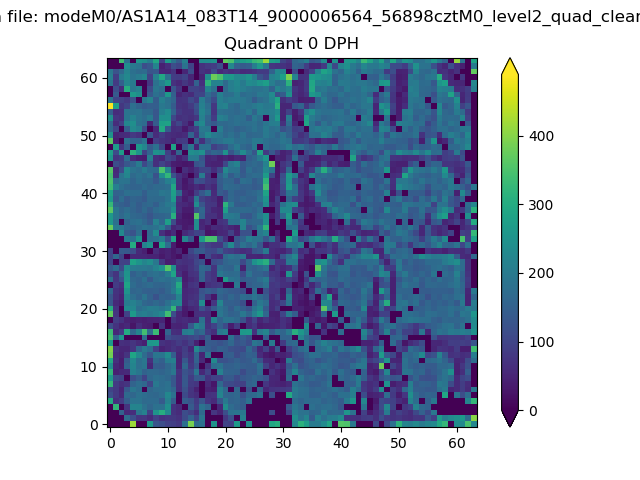 |
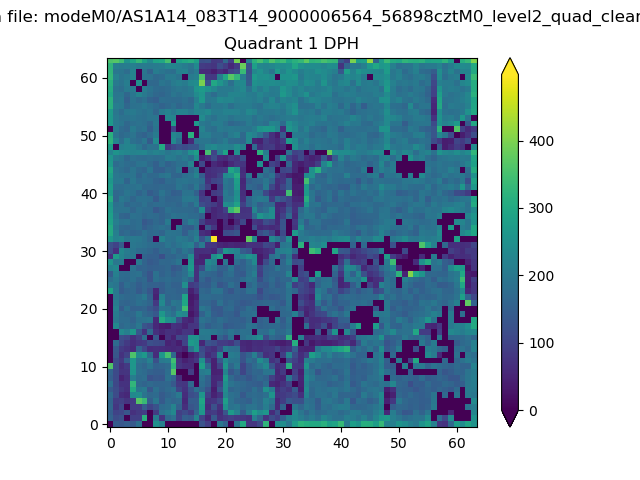 |
Quadrant B |
|---|---|---|---|
| Quadrant D | 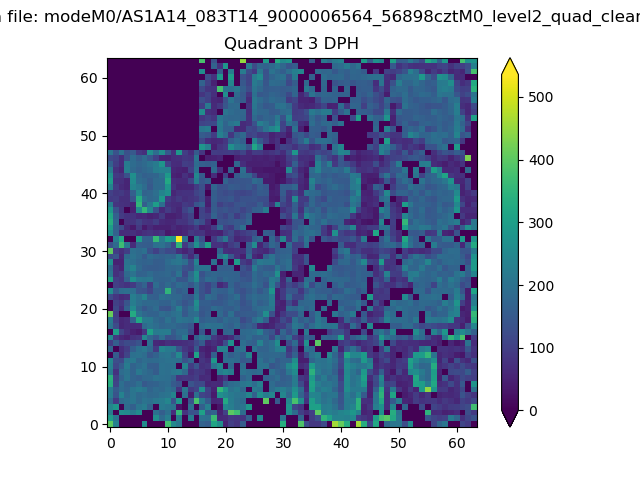 |
 |
Quadrant C |
| Plot type | Count rate plots | Images |
|---|---|---|
| Comparison with Poisson distribution Blue bars denote a histogram of data divided into 1 sec bins. Red curve is a Poisson curve with rate = median count rate of data. |
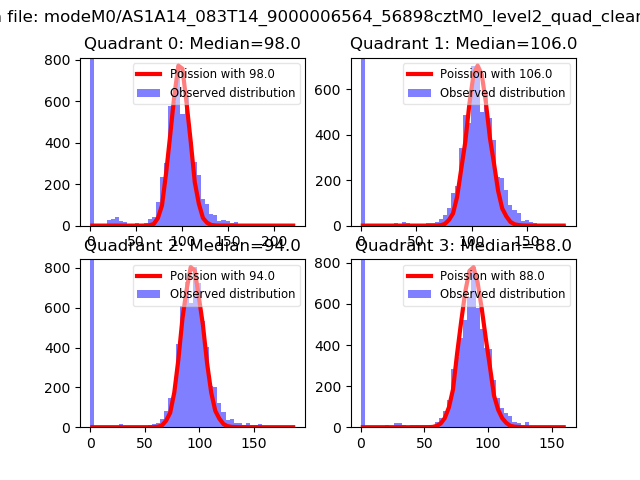 |
 |
| Quadrant-wise count rates Data is divided into 100 sec bins |
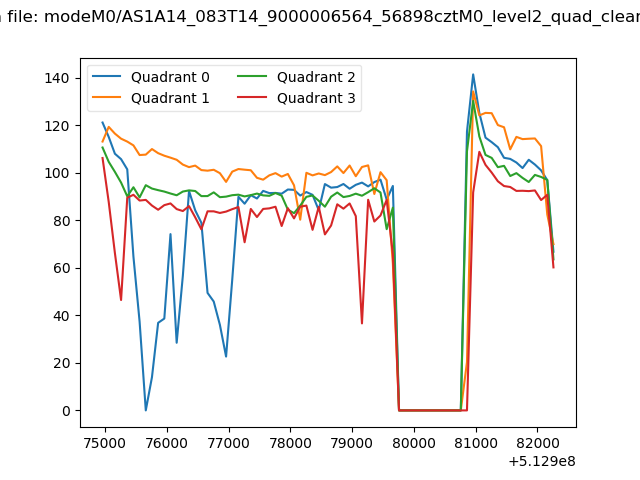 |
|
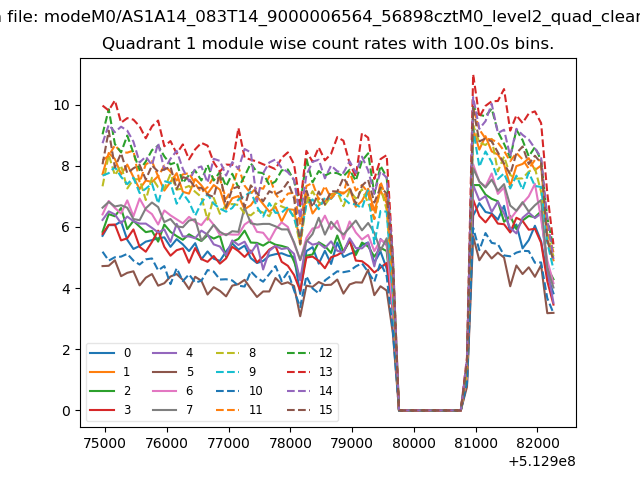
| Module-wise count rates for Quadrant A Data is divided into 100 sec bins |
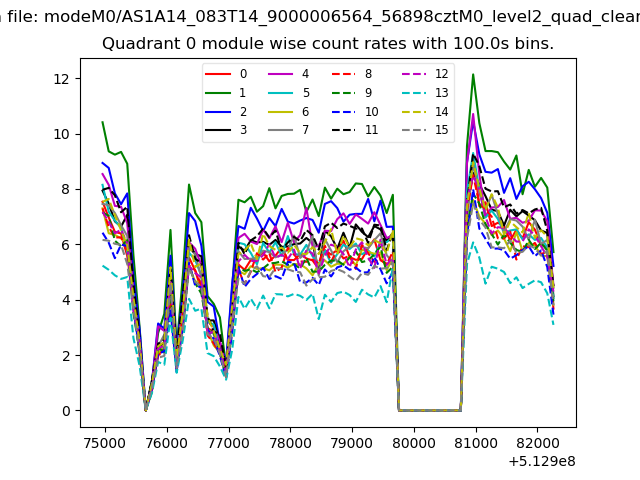 |
 |
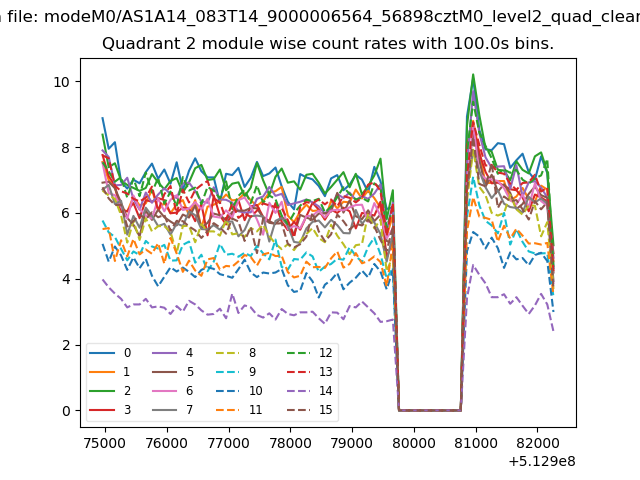
| Module-wise count rates for Quadrant B Data is divided into 100 sec bins |
 |
 |
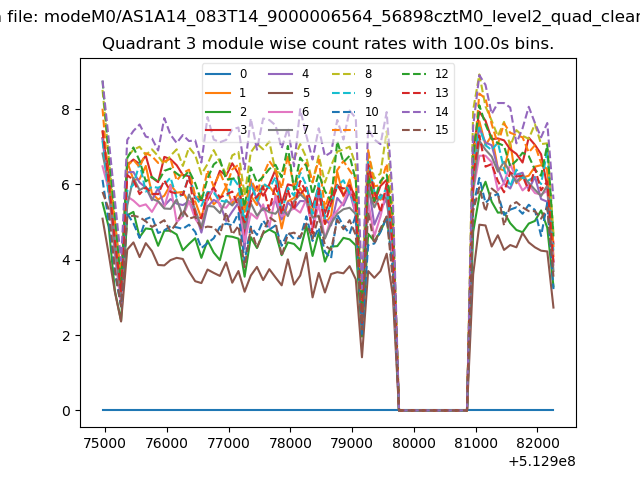
| Module-wise count rates for Quadrant C Data is divided into 100 sec bins |
 |
 |
| Module-wise count rates for Quadrant D Data is divided into 100 sec bins |
 |
 |
| Parameter | Plot |
|---|---|
| CZT HV Monitor | 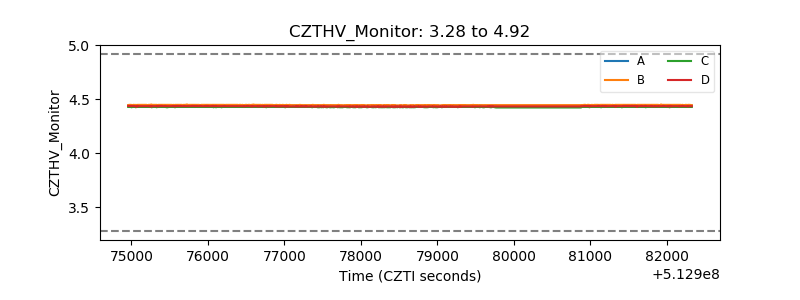 |
| D_VDD | 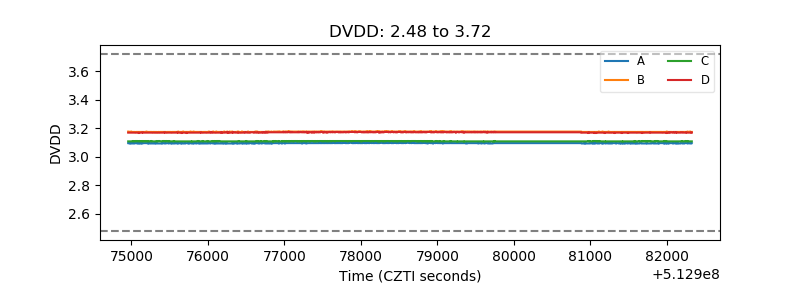 |
| Temperature 1 | 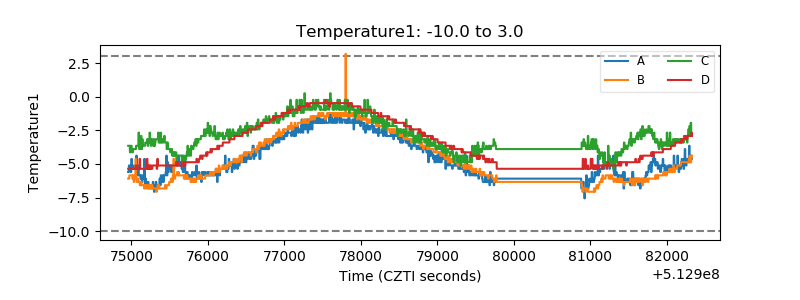 |
| Veto HV Monitor | 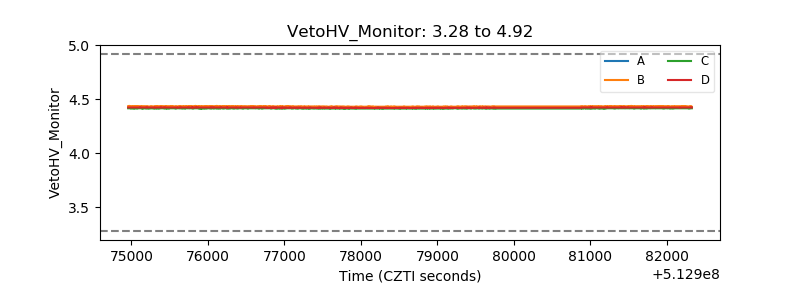 |
| Veto LLD | 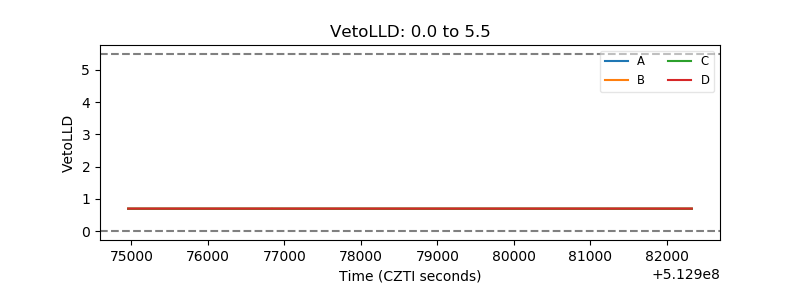 |
| Alpha Counter | 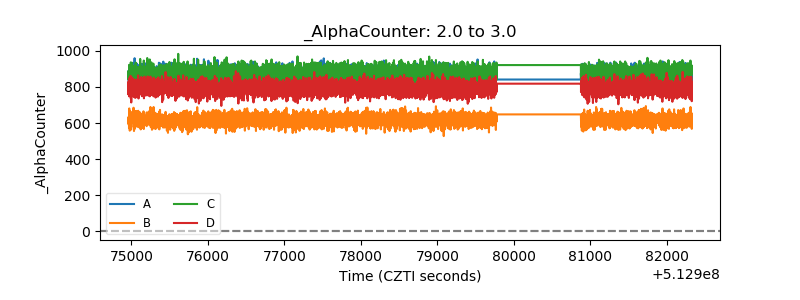 |
| _CPM_Rate | 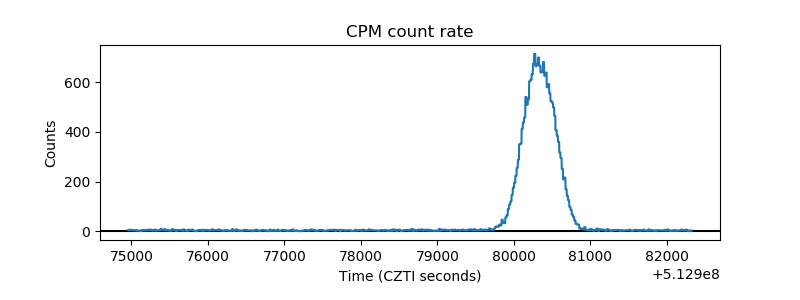 |
| CZT Counter | 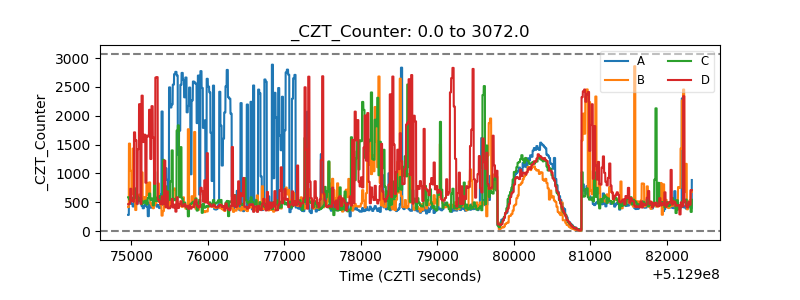 |
| +2.5 Volts monitor | 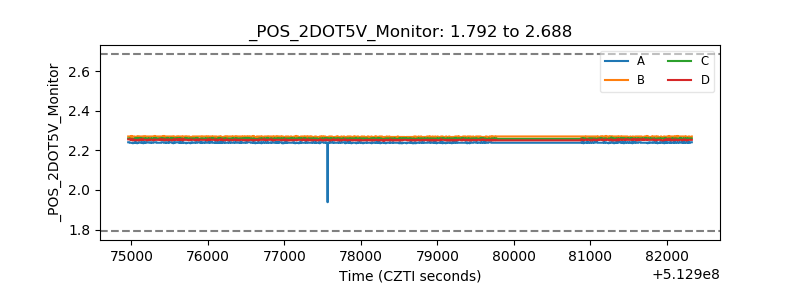 |
| +5 Volts monitor | 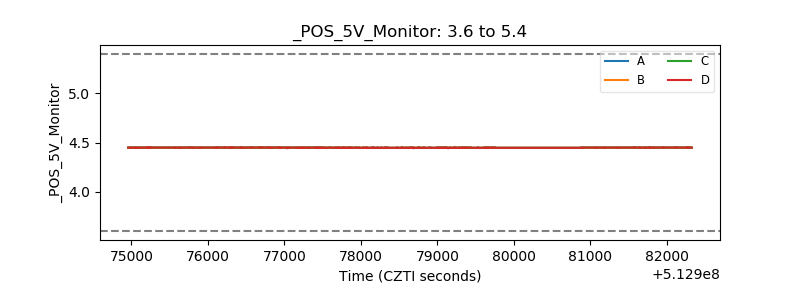 |
| _ROLL_ROT | 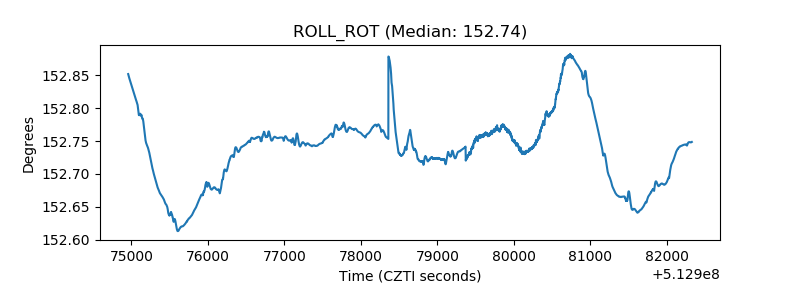 |
| _Roll_DEC | 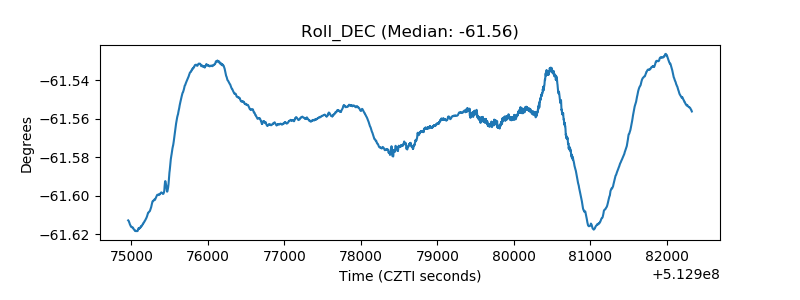 |
| _Roll_RA | 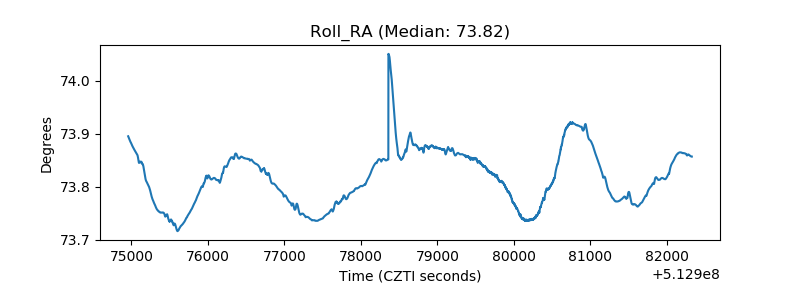 |
| Veto Counter | 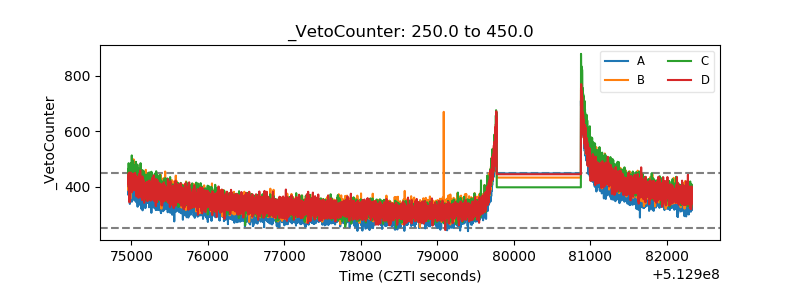 |