| Param | Original file | Final file |
|---|---|---|
| Filename | modeM0/AS1A14_083T14_9000006564_56899cztM0_level2.fits | modeM0/AS1A14_083T14_9000006564_56899cztM0_level2_quad_clean.evt |
| Size (bytes) | 448,355,520 | 83,413,440 |
| Size | 427.6 MB | 79.5 MB |
| Events in quadrant A | 3,039,583 | 566,686 |
| Events in quadrant B | 6,214,088 | 487,458 |
| Events in quadrant C | 3,012,133 | 552,802 |
| Events in quadrant D | 3,876,767 | 510,784 |
| Mode SS | |||
|---|---|---|---|
| Quadrant | BADHDUFLAG | Total packets | Discarded packets |
| A | 0 | 120 | 0 |
| B | 0 | 120 | 0 |
| C | 0 | 120 | 0 |
| D | 0 | 120 | 0 |
| Mode M9 | |||
|---|---|---|---|
| Quadrant | BADHDUFLAG | Total packets | Discarded packets |
| A | 0 | 11 | 0 |
| B | 0 | 11 | 0 |
| C | 0 | 11 | 0 |
| D | 0 | 11 | 0 |
| Mode M0 | |||
|---|---|---|---|
| Quadrant | BADHDUFLAG | Total packets | Discarded packets |
| A | 0 | 13366 | 1 |
| B | 0 | 22457 | 1 |
| C | 0 | 12971 | 1 |
| D | 0 | 15449 | 1 |
| Quadrant | Total seconds | Saturated seconds | Saturation percentage |
|---|---|---|---|
| A | 5832 | 221 | 3.789438% |
| B | 5833 | 1453 | 24.909995% |
| C | 5833 | 113 | 1.937254% |
| D | 5833 | 195 | 3.343048% |
Noise dominated data is calculated using 1-second bins in cleaned event files. If a bin has >2000 counts, and if more than 50% of those come from <1% of pixels, then it is considered to be noise-dominated and hence unusable.
| Quadrant | # 1 sec bins | Bins with >0 counts | Bins with >2000 counts | High rate bins dominated by noise | Noise dominated (total time) | Noise dominated (detector-on time) | Marked lightcurve |
|---|---|---|---|---|---|---|---|
| A | 6957 | 5833 | 116 | 116 | 1.67% | 1.99% | 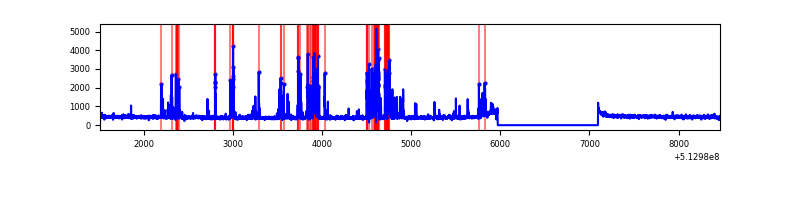 |
| B | 6958 | 5834 | 910 | 910 | 13.08% | 15.60% | 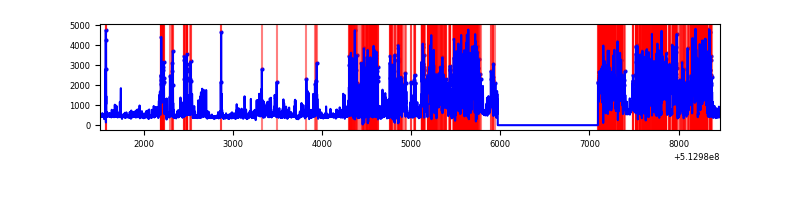 |
| C | 6958 | 5834 | 47 | 47 | 0.68% | 0.81% | 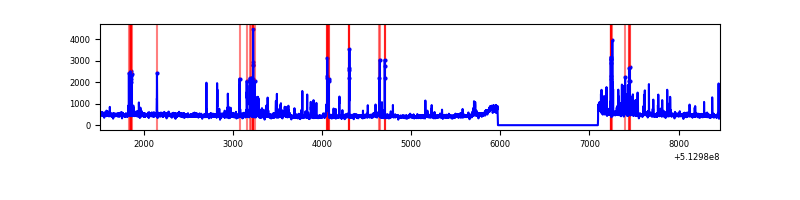 |
| D | 6958 | 5834 | 141 | 141 | 2.03% | 2.42% | 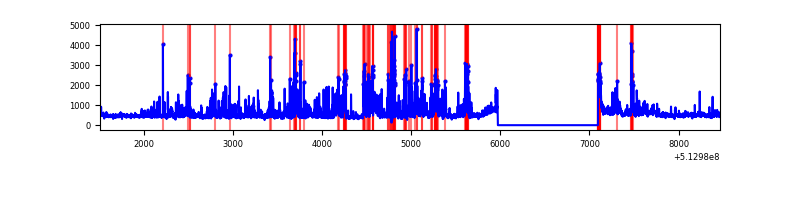 |
Top three noisy pixels from each quadrant. If the there are fewer than three noisy pixels in the level2.evt file, extra rows are filled as -1
| Pixel properties | Quadrant properties | ||||||
|---|---|---|---|---|---|---|---|
| Quadrant | DetID | PixID | Counts | Sigma | Mean | Median | Sigma |
| A | 8 | 206 | 219633 | 1418.26 | 625 | 609 | 154.4 |
| A | 4 | 13 | 182066 | 1175.0 | 625 | 609 | 154.4 |
| A | 3 | 62 | 180405 | 1164.24 | 625 | 609 | 154.4 |
| B | 5 | 185 | 3374295 | 28638.39 | 550 | 530 | 117.8 |
| B | 10 | 16 | 275128 | 2330.94 | 550 | 530 | 117.8 |
| B | 1 | 127 | 169015 | 1430.19 | 550 | 530 | 117.8 |
| C | 1 | 16 | 200654 | 1202.68 | 609 | 603 | 166.3 |
| C | 13 | 3 | 151557 | 907.52 | 609 | 603 | 166.3 |
| C | 14 | 254 | 141310 | 845.91 | 609 | 603 | 166.3 |
| D | 2 | 31 | 395652 | 2320.82 | 605 | 578 | 170.2 |
| D | 8 | 160 | 236924 | 1388.39 | 605 | 578 | 170.2 |
| D | 2 | 249 | 201845 | 1182.32 | 605 | 578 | 170.2 |
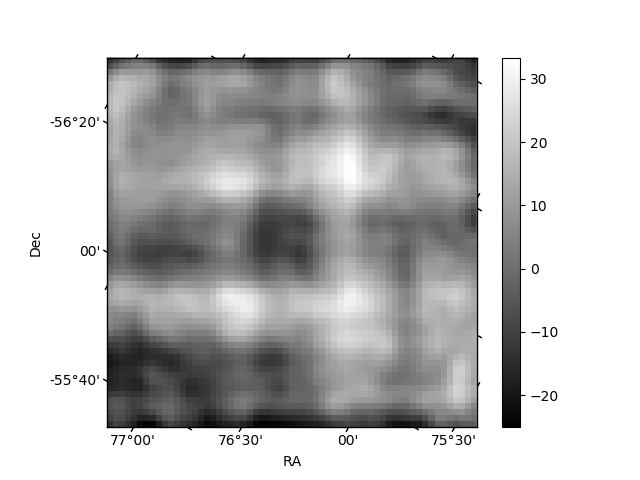
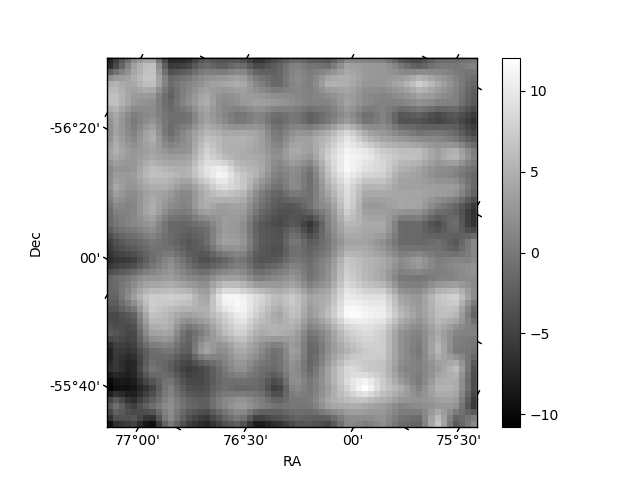
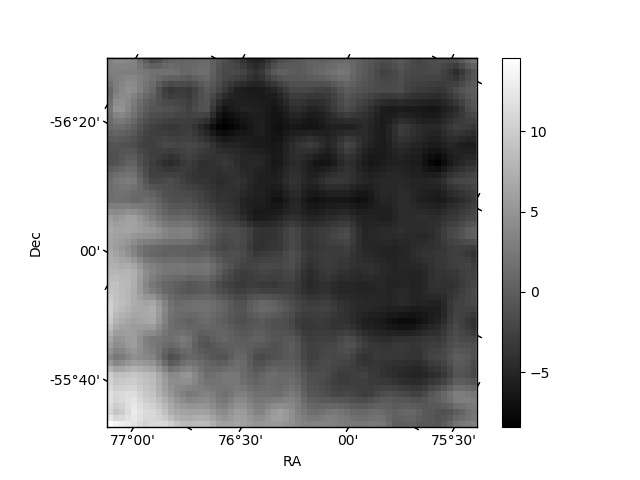
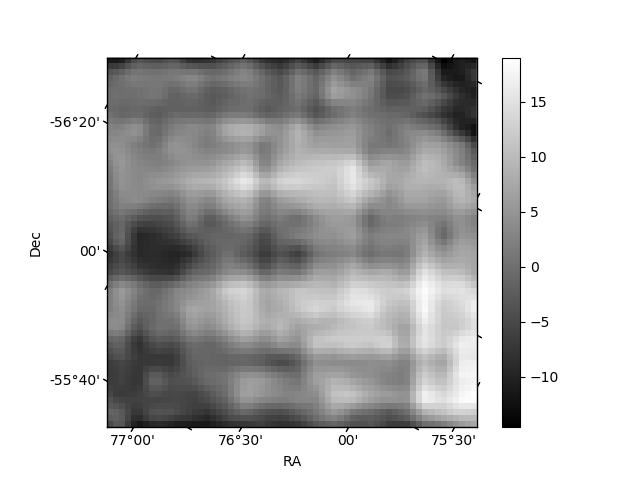
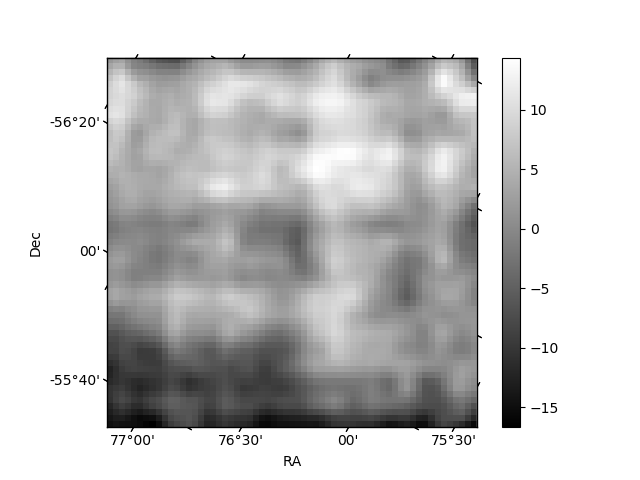
Histogram calculated using DETX and DETY for each event in the final _common_clean file
| Quadrant A | 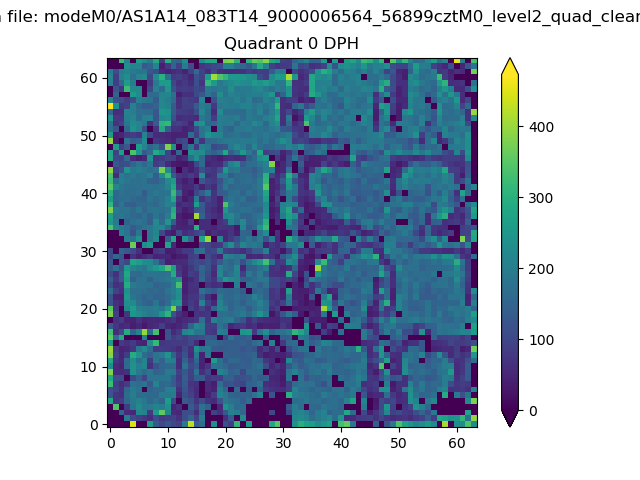 |
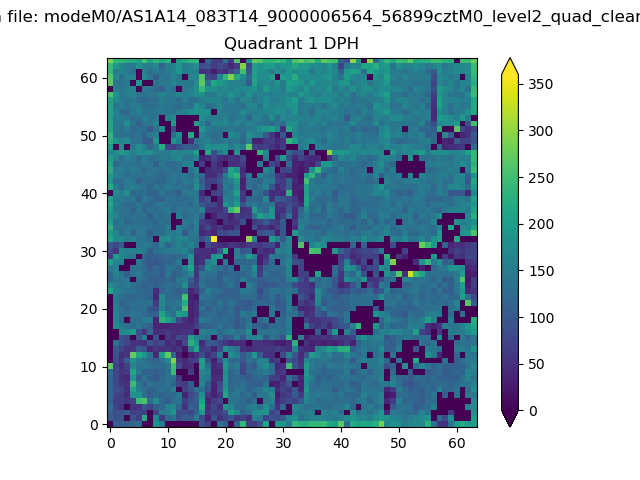 |
Quadrant B |
|---|---|---|---|
| Quadrant D | 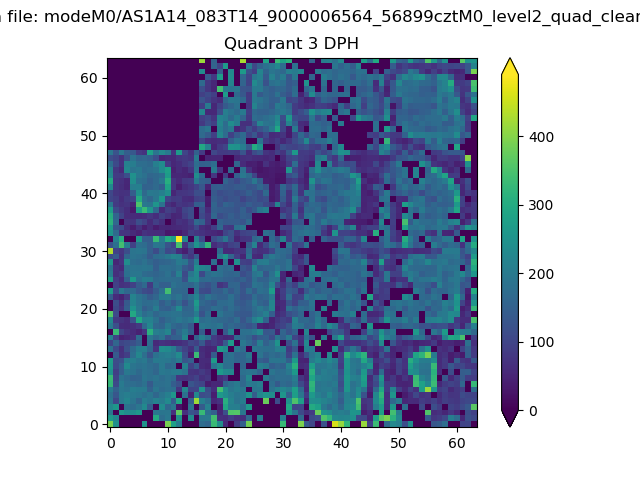 |
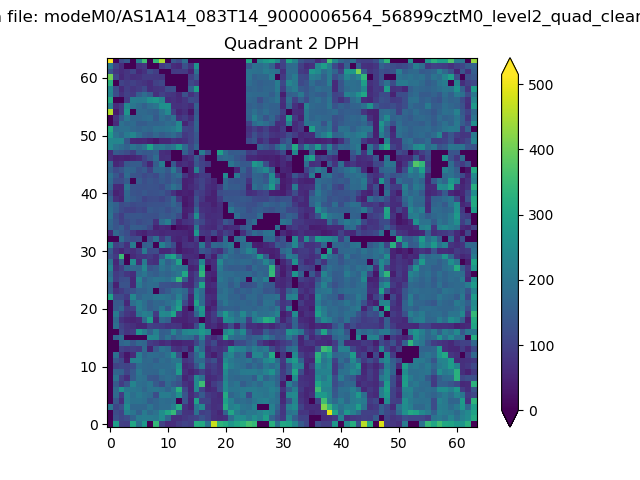 |
Quadrant C |
| Plot type | Count rate plots | Images |
|---|---|---|
| Comparison with Poisson distribution Blue bars denote a histogram of data divided into 1 sec bins. Red curve is a Poisson curve with rate = median count rate of data. |
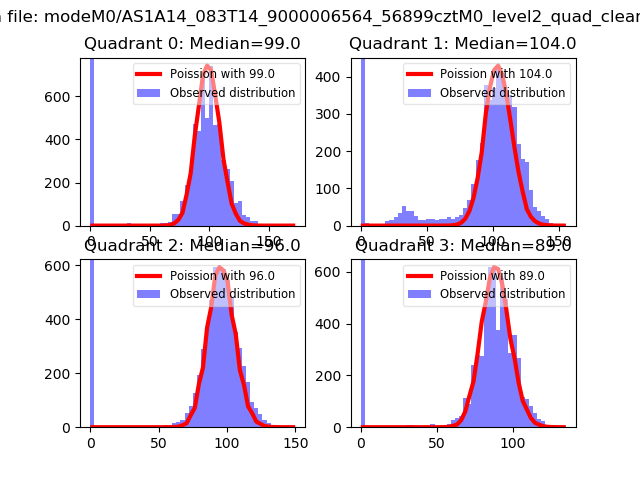 |
 |
| Quadrant-wise count rates Data is divided into 100 sec bins |
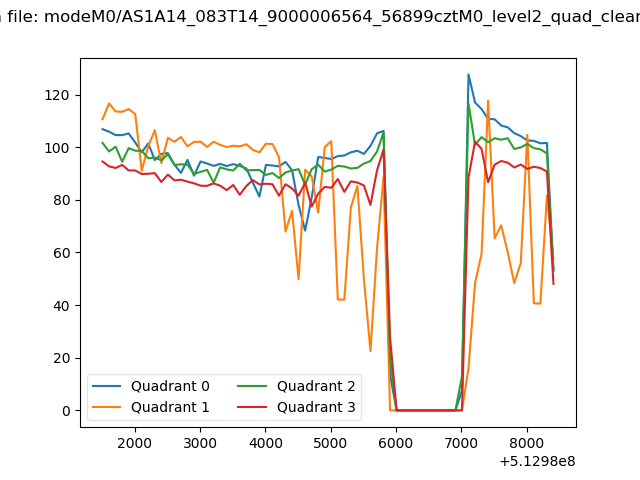 |
|
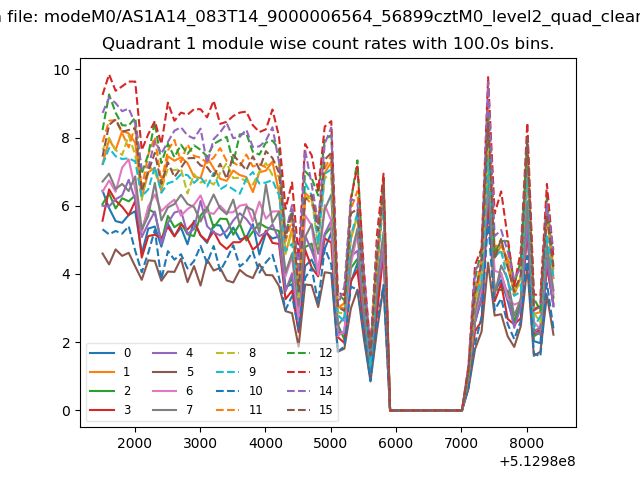
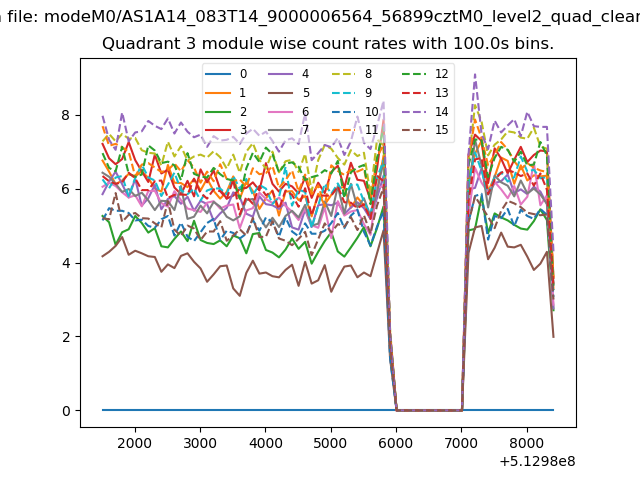
| Module-wise count rates for Quadrant A Data is divided into 100 sec bins |
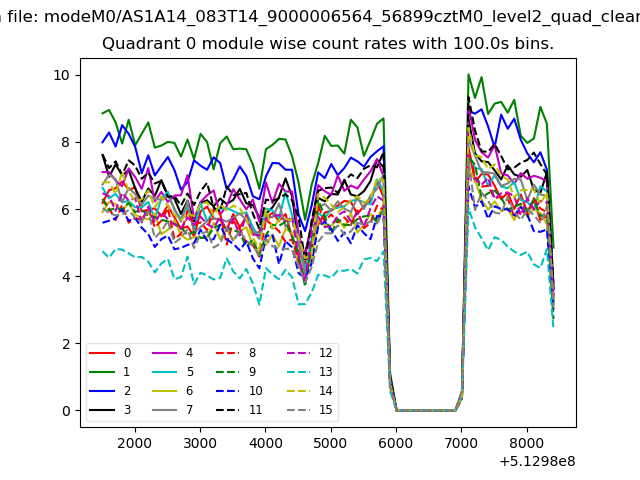 |
 |
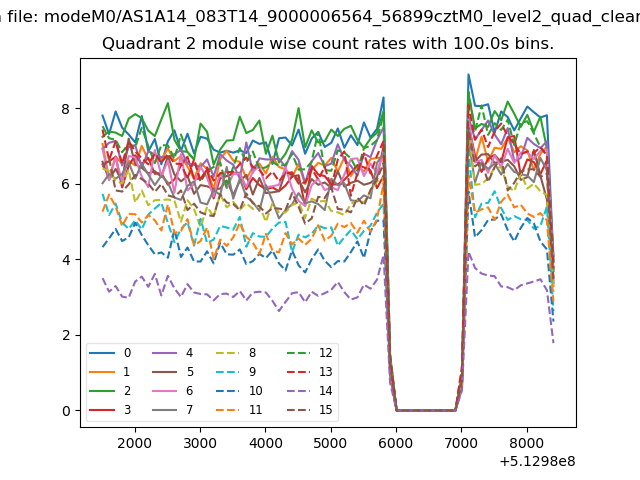
| Module-wise count rates for Quadrant B Data is divided into 100 sec bins |
 |
 |
| Module-wise count rates for Quadrant C Data is divided into 100 sec bins |
 |
 |
| Module-wise count rates for Quadrant D Data is divided into 100 sec bins |
 |
 |
| Parameter | Plot |
|---|---|
| CZT HV Monitor | 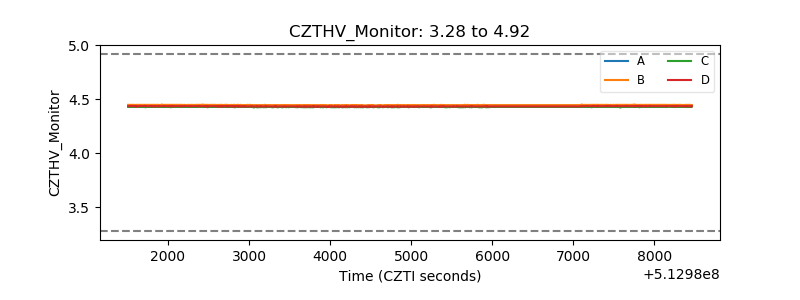 |
| D_VDD | 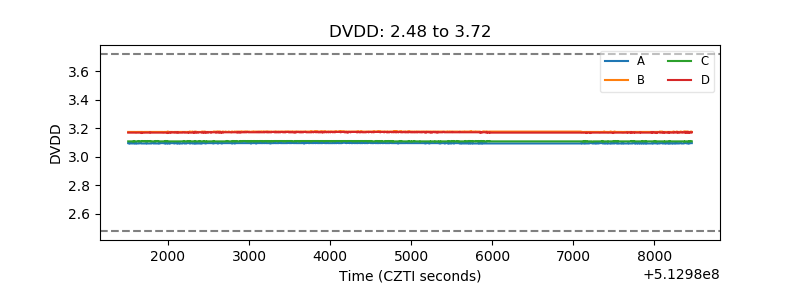 |
| Temperature 1 | 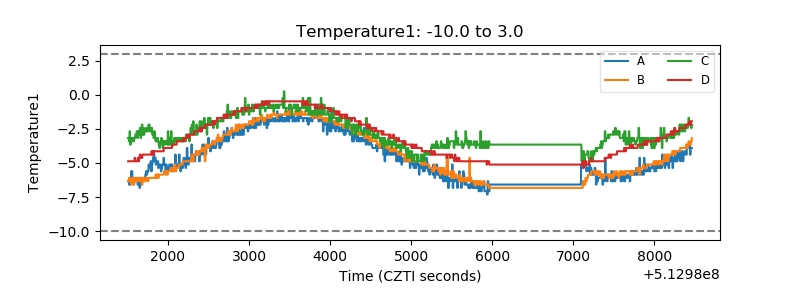 |
| Veto HV Monitor | 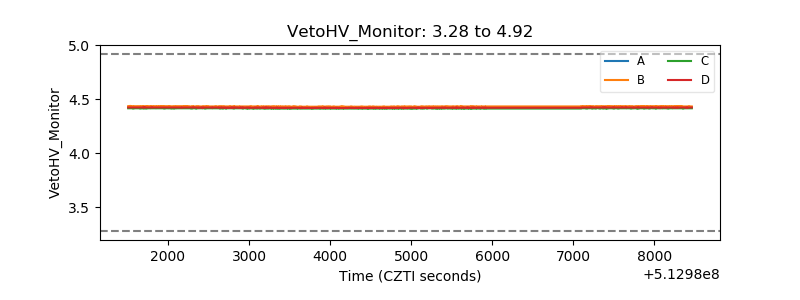 |
| Veto LLD | 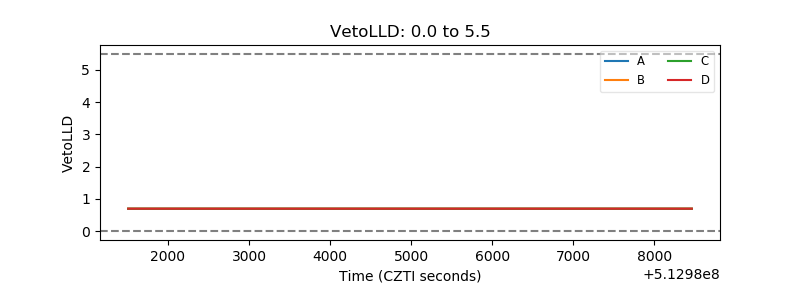 |
| Alpha Counter | 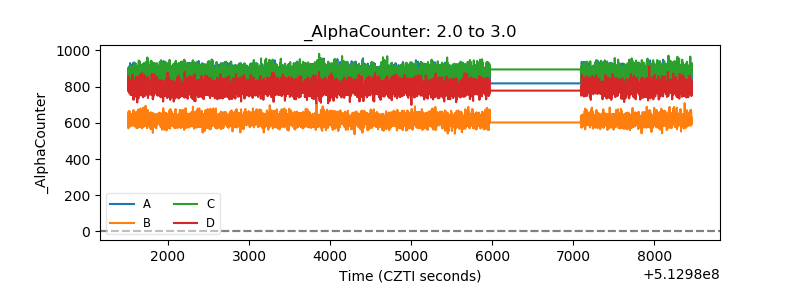 |
| _CPM_Rate | 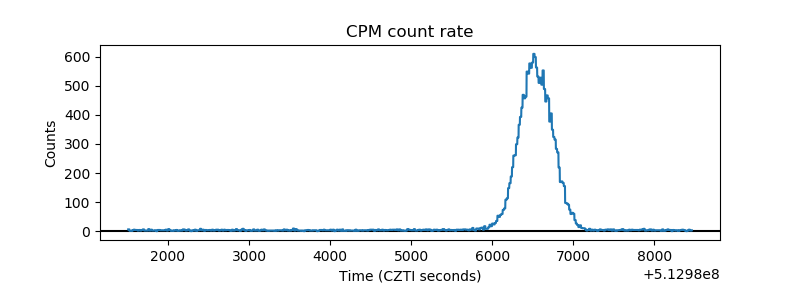 |
| CZT Counter | 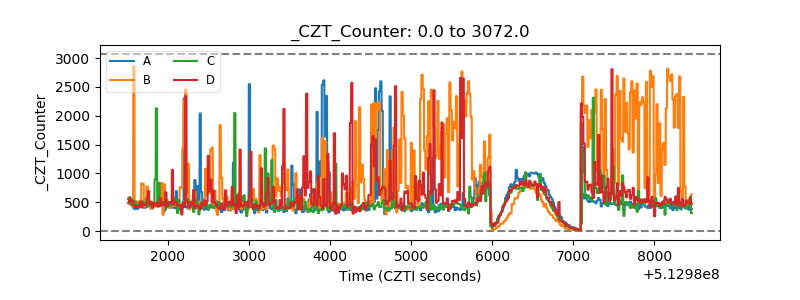 |
| +2.5 Volts monitor | 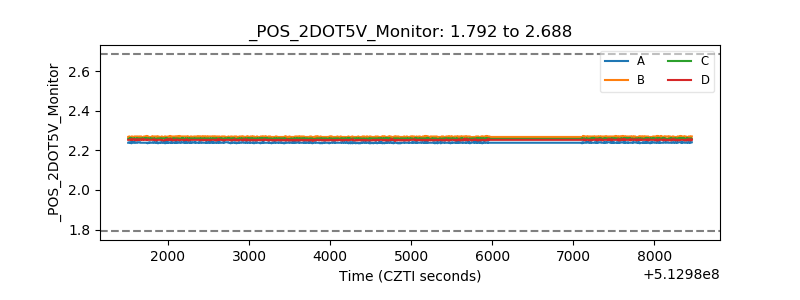 |
| +5 Volts monitor | 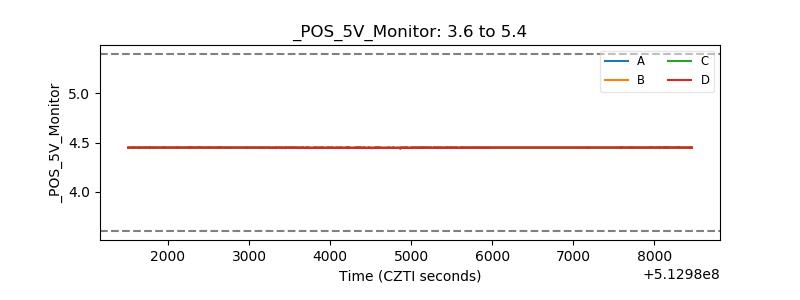 |
| _ROLL_ROT | 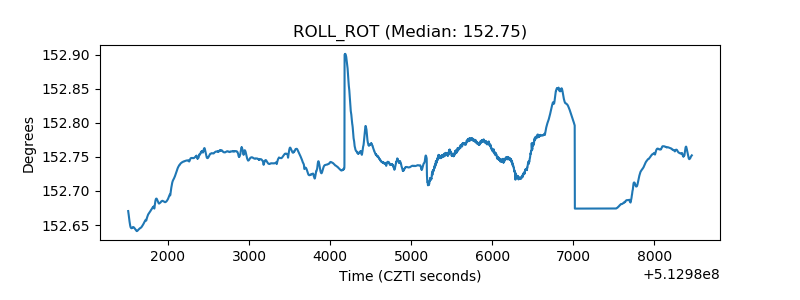 |
| _Roll_DEC | 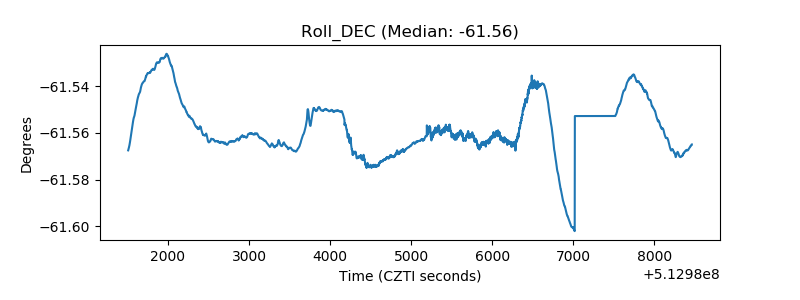 |
| _Roll_RA | 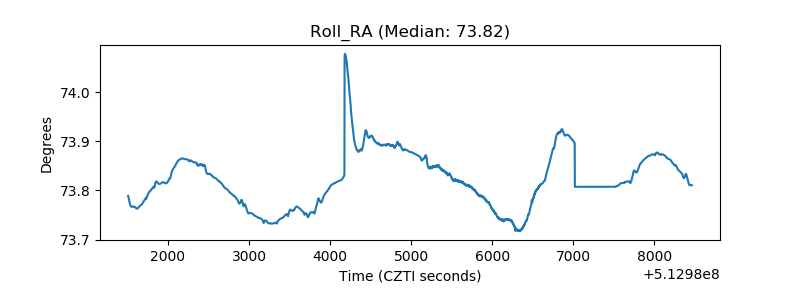 |
| Veto Counter | 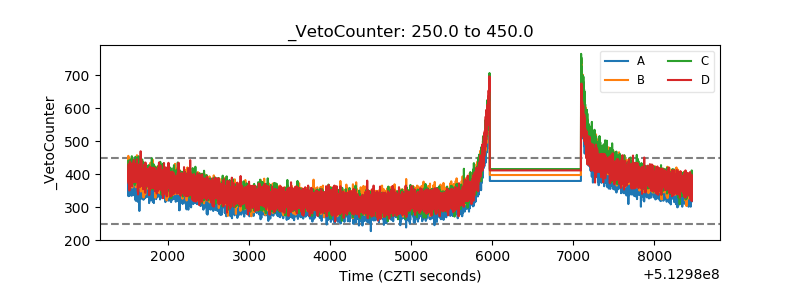 |