| Param | Original file | Final file |
|---|---|---|
| Filename | modeM0/AS1A14_083T14_9000006564_56900cztM0_level2.fits | modeM0/AS1A14_083T14_9000006564_56900cztM0_level2_quad_clean.evt |
| Size (bytes) | 516,648,960 | 89,939,520 |
| Size | 492.7 MB | 85.8 MB |
| Events in quadrant A | 2,971,402 | 628,493 |
| Events in quadrant B | 5,524,367 | 580,755 |
| Events in quadrant C | 3,683,938 | 591,352 |
| Events in quadrant D | 6,442,589 | 472,042 |
| Mode SS | |||
|---|---|---|---|
| Quadrant | BADHDUFLAG | Total packets | Discarded packets |
| A | 0 | 132 | 0 |
| B | 0 | 132 | 0 |
| C | 0 | 132 | 0 |
| D | 0 | 132 | 0 |
| Mode M9 | |||
|---|---|---|---|
| Quadrant | BADHDUFLAG | Total packets | Discarded packets |
| A | 0 | 11 | 0 |
| B | 0 | 11 | 0 |
| C | 0 | 11 | 0 |
| D | 0 | 11 | 0 |
| Mode M0 | |||
|---|---|---|---|
| Quadrant | BADHDUFLAG | Total packets | Discarded packets |
| A | 0 | 13740 | 1 |
| B | 0 | 20967 | 1 |
| C | 0 | 15752 | 1 |
| D | 0 | 23518 | 1 |
| Quadrant | Total seconds | Saturated seconds | Saturation percentage |
|---|---|---|---|
| A | 6457 | 119 | 1.842961% |
| B | 6457 | 1032 | 15.982654% |
| C | 6458 | 243 | 3.762775% |
| D | 6458 | 1240 | 19.200991% |
Noise dominated data is calculated using 1-second bins in cleaned event files. If a bin has >2000 counts, and if more than 50% of those come from <1% of pixels, then it is considered to be noise-dominated and hence unusable.
| Quadrant | # 1 sec bins | Bins with >0 counts | Bins with >2000 counts | High rate bins dominated by noise | Noise dominated (total time) | Noise dominated (detector-on time) | Marked lightcurve |
|---|---|---|---|---|---|---|---|
| A | 7542 | 6458 | 36 | 36 | 0.48% | 0.56% | 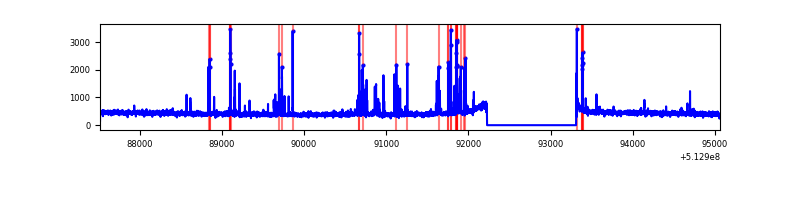 |
| B | 7542 | 6458 | 697 | 697 | 9.24% | 10.79% | 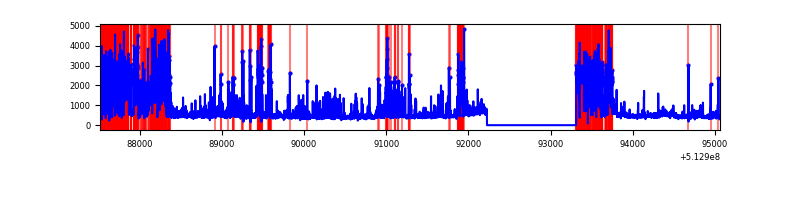 |
| C | 7543 | 6459 | 124 | 124 | 1.64% | 1.92% | 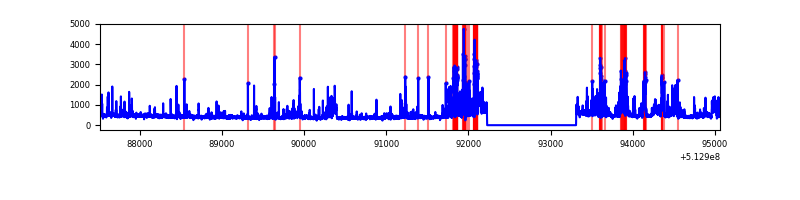 |
| D | 7543 | 6459 | 1019 | 1019 | 13.51% | 15.78% | 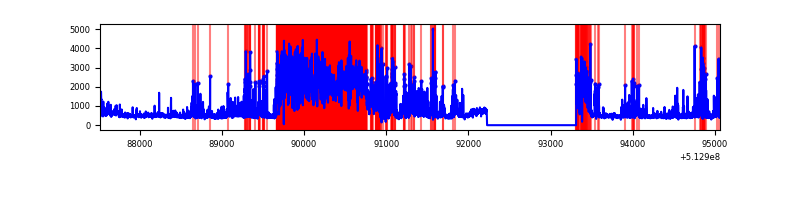 |
Top three noisy pixels from each quadrant. If the there are fewer than three noisy pixels in the level2.evt file, extra rows are filled as -1
| Pixel properties | Quadrant properties | ||||||
|---|---|---|---|---|---|---|---|
| Quadrant | DetID | PixID | Counts | Sigma | Mean | Median | Sigma |
| A | 4 | 13 | 136784 | 792.26 | 691 | 673 | 171.8 |
| A | 6 | 211 | 52780 | 303.3 | 691 | 673 | 171.8 |
| A | 3 | 14 | 38183 | 218.34 | 691 | 673 | 171.8 |
| B | 5 | 185 | 1742745 | 13099.39 | 626 | 604 | 133.0 |
| B | 10 | 16 | 786366 | 5908.25 | 626 | 604 | 133.0 |
| B | 1 | 127 | 165331 | 1238.6 | 626 | 604 | 133.0 |
| C | 13 | 3 | 718213 | 3969.48 | 660 | 654 | 180.8 |
| C | 14 | 254 | 120860 | 664.97 | 660 | 654 | 180.8 |
| C | 14 | 96 | 88828 | 487.77 | 660 | 654 | 180.8 |
| D | 2 | 249 | 1409483 | 8097.45 | 620 | 592 | 174.0 |
| D | 7 | 62 | 955839 | 5490.18 | 620 | 592 | 174.0 |
| D | 8 | 240 | 528601 | 3034.68 | 620 | 592 | 174.0 |
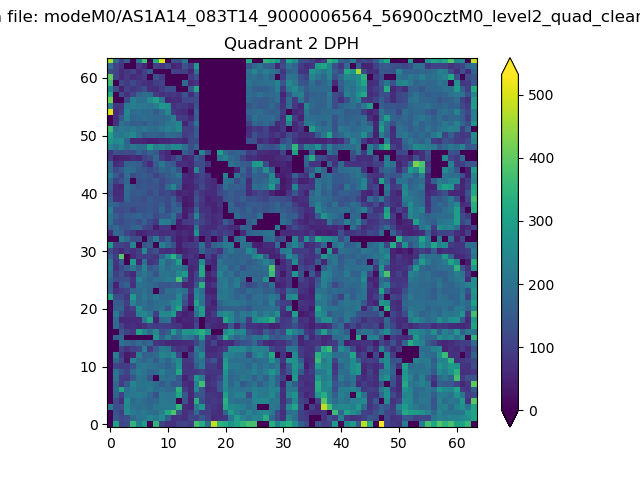
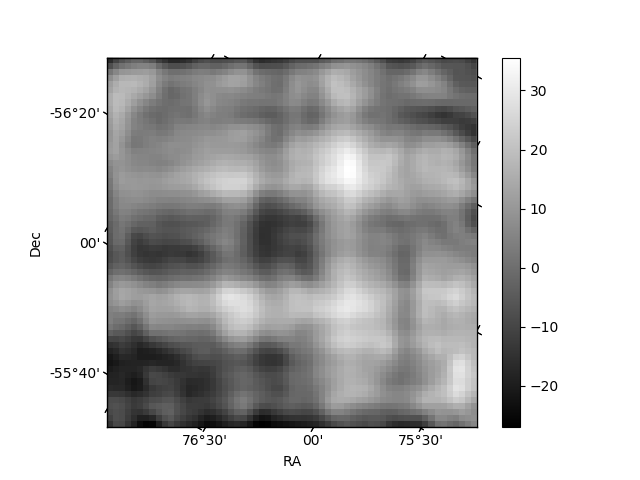
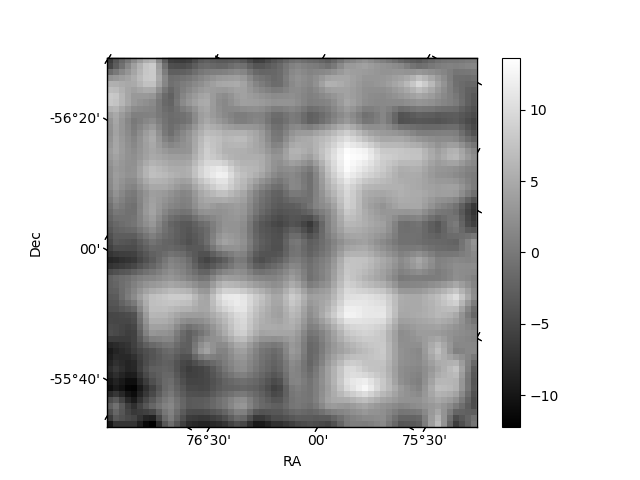
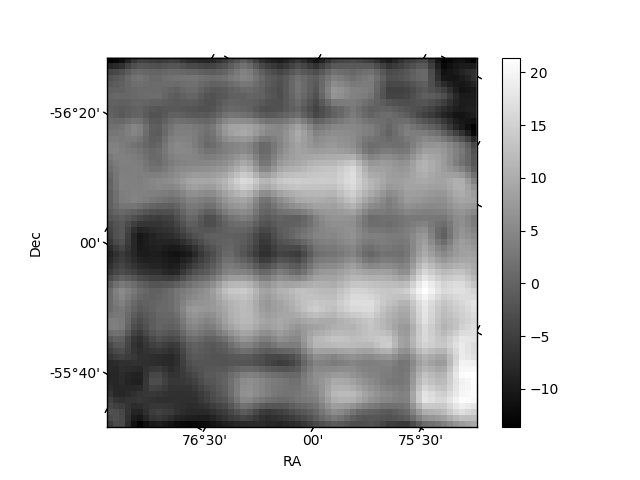
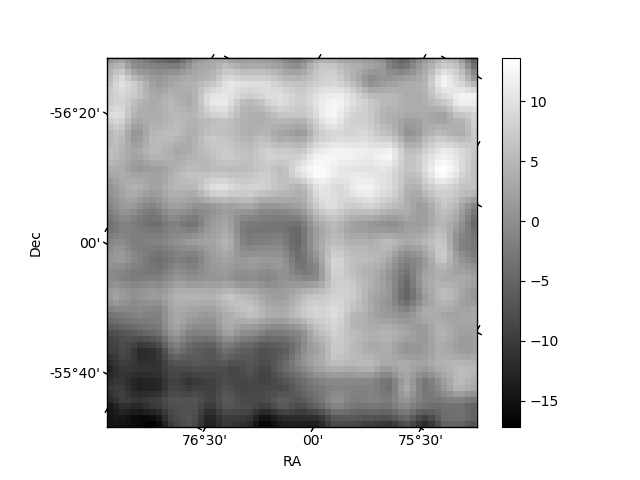
Histogram calculated using DETX and DETY for each event in the final _common_clean file
| Quadrant A | 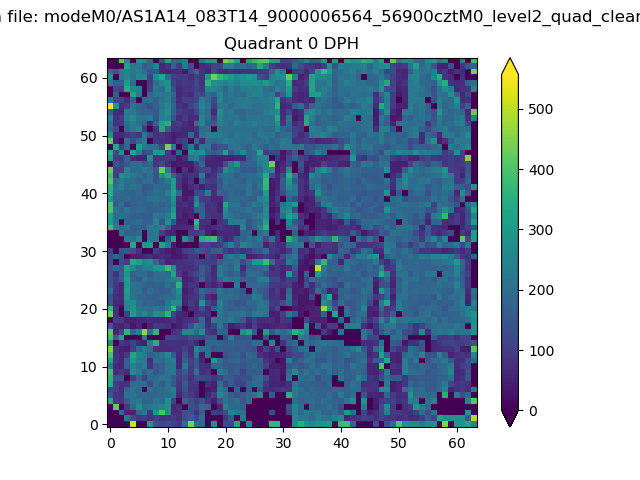 |
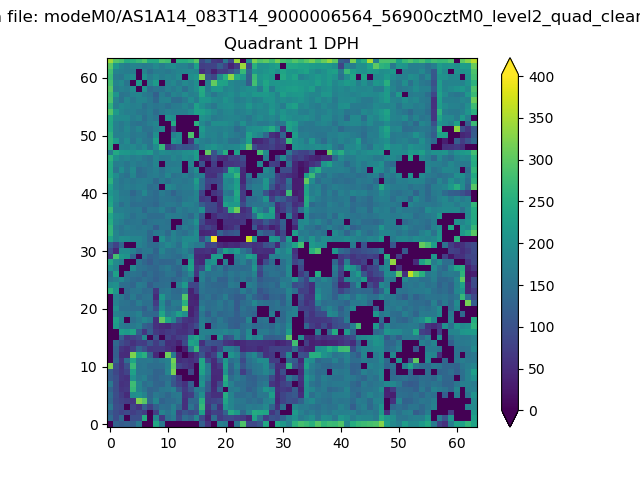 |
Quadrant B |
|---|---|---|---|
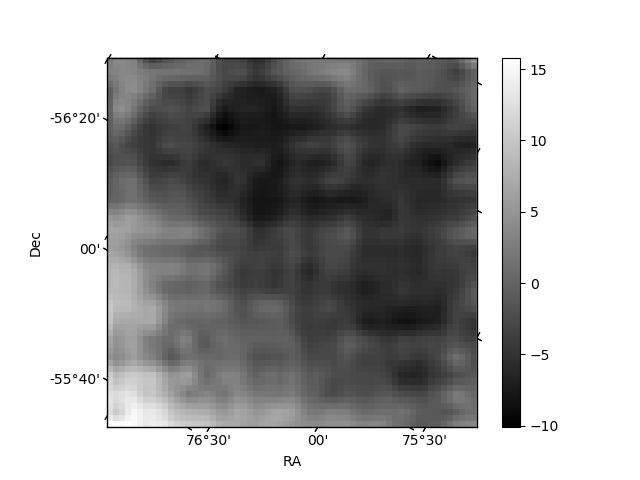
| Quadrant D | 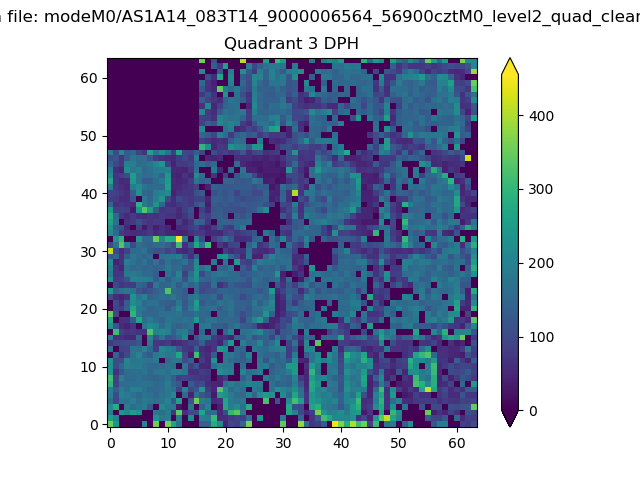 |
 |
Quadrant C |
| Plot type | Count rate plots | Images |
|---|---|---|
| Comparison with Poisson distribution Blue bars denote a histogram of data divided into 1 sec bins. Red curve is a Poisson curve with rate = median count rate of data. |
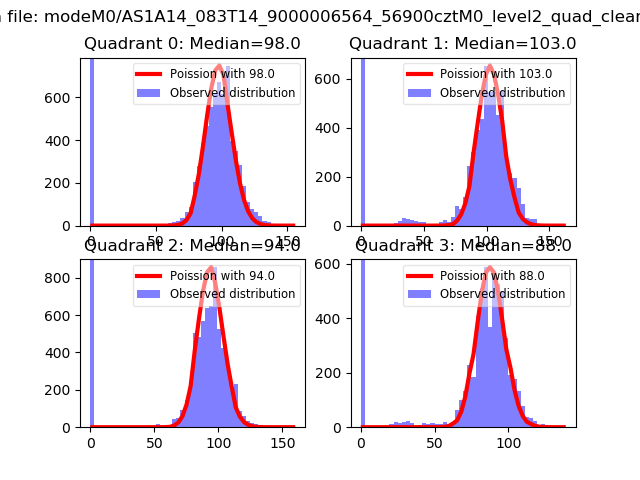 |
 |
| Quadrant-wise count rates Data is divided into 100 sec bins |
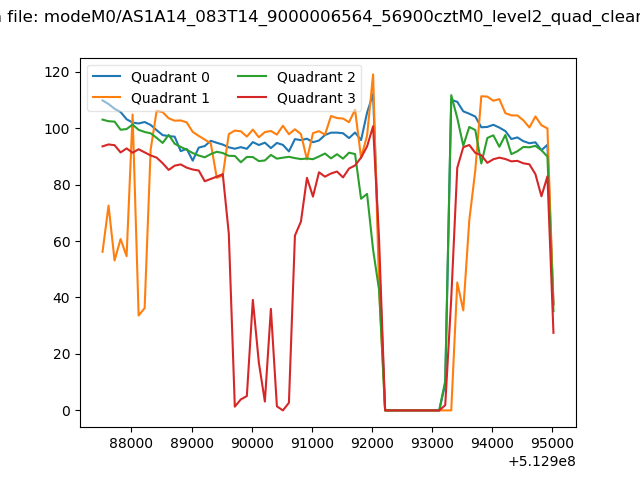 |
|
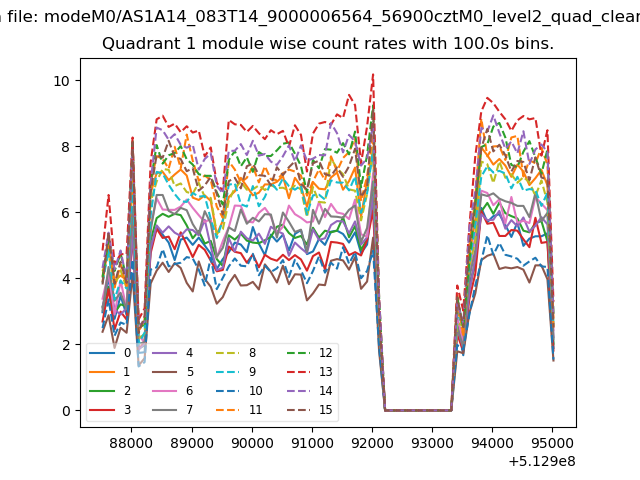
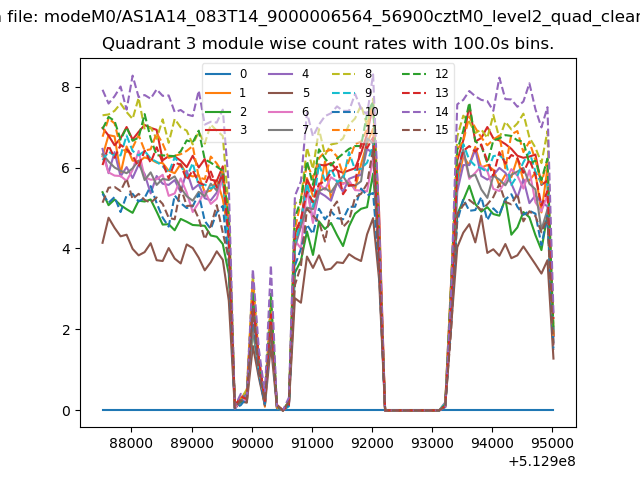
| Module-wise count rates for Quadrant A Data is divided into 100 sec bins |
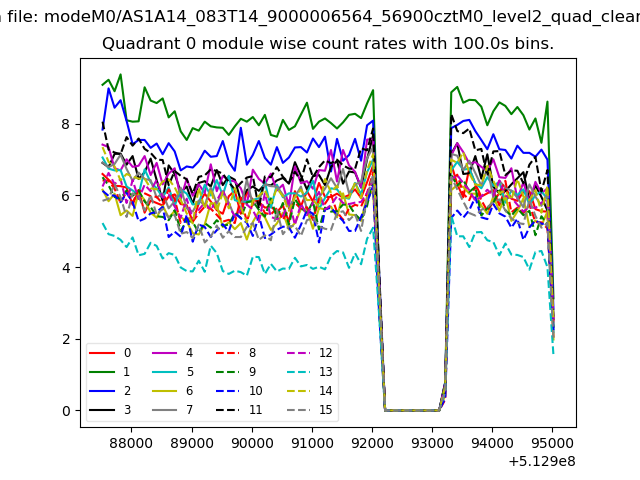 |
 |
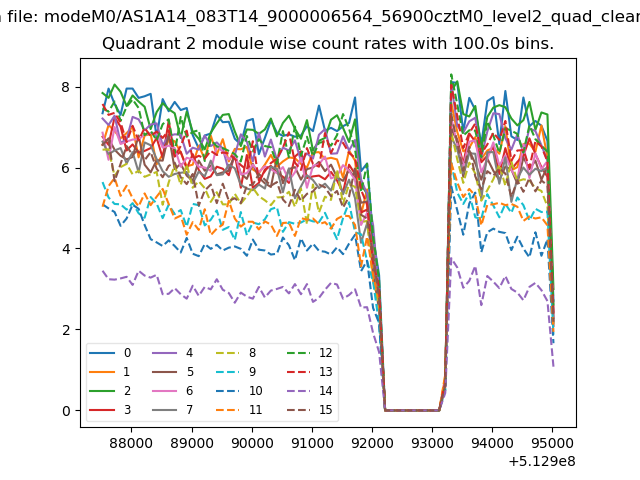
| Module-wise count rates for Quadrant B Data is divided into 100 sec bins |
 |
 |
| Module-wise count rates for Quadrant C Data is divided into 100 sec bins |
 |
 |
| Module-wise count rates for Quadrant D Data is divided into 100 sec bins |
 |
 |
| Parameter | Plot |
|---|---|
| CZT HV Monitor |  |
| D_VDD | 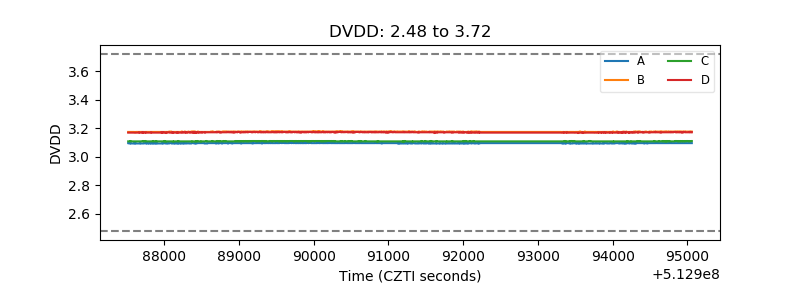 |
| Temperature 1 | 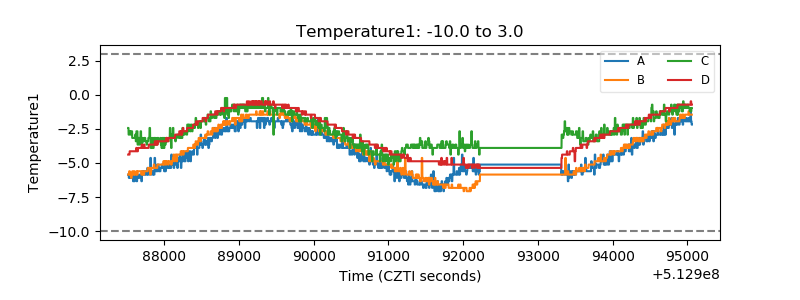 |
| Veto HV Monitor | 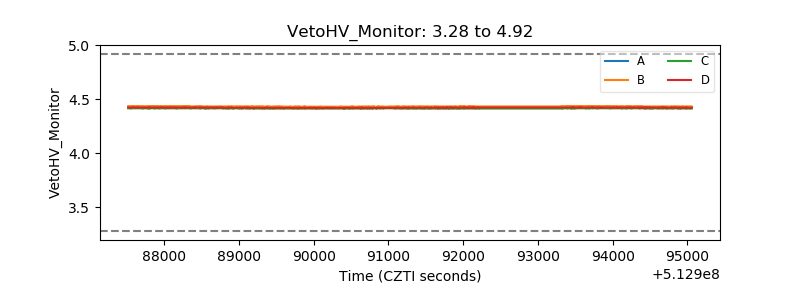 |
| Veto LLD | 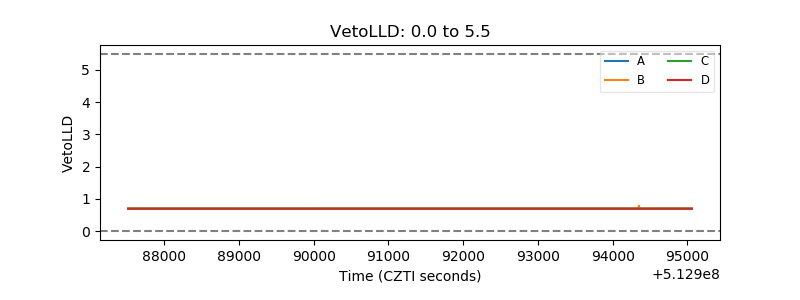 |
| Alpha Counter | 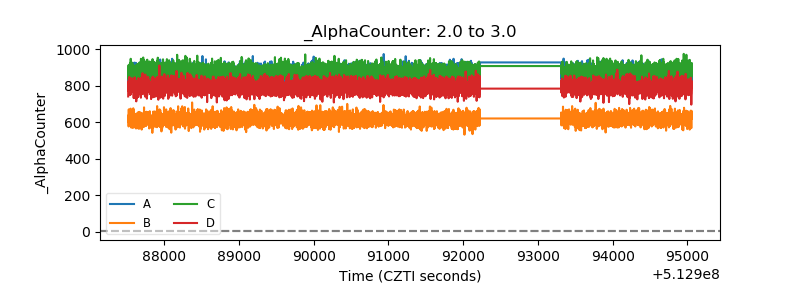 |
| _CPM_Rate | 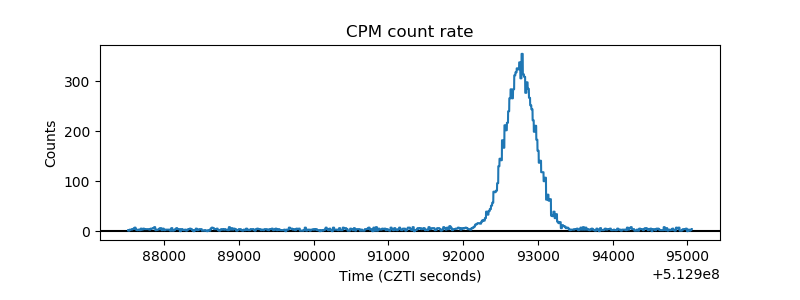 |
| CZT Counter | 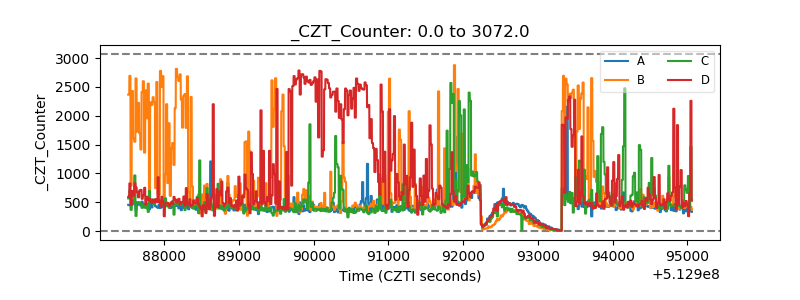 |
| +2.5 Volts monitor |  |
| +5 Volts monitor | 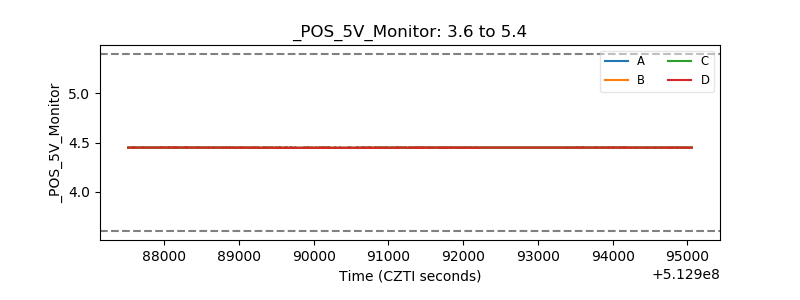 |
| _ROLL_ROT | 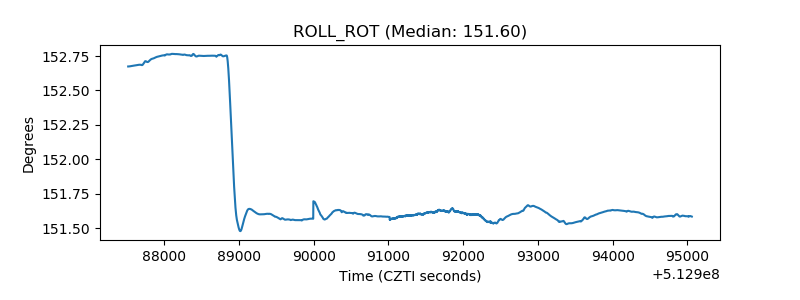 |
| _Roll_DEC | 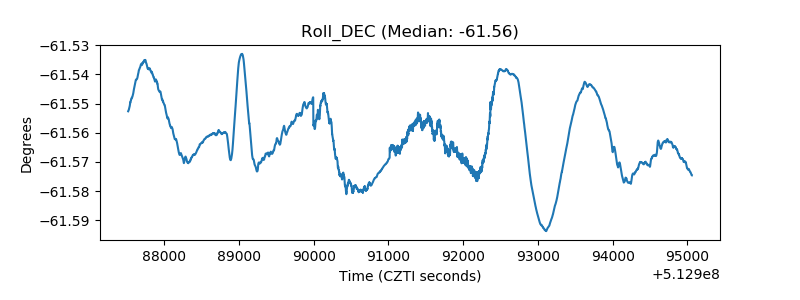 |
| _Roll_RA | 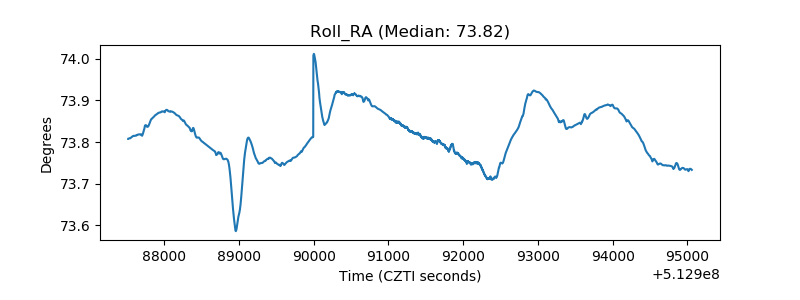 |
| Veto Counter | 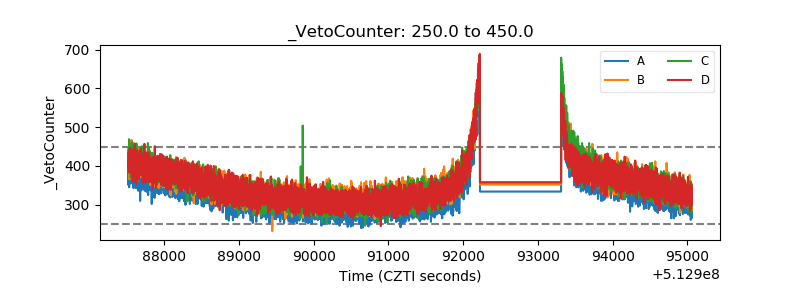 |