| Param | Original file | Final file |
|---|---|---|
| Filename | modeM0/AS1A14_083T14_9000006564_56901cztM0_level2.fits | modeM0/AS1A14_083T14_9000006564_56901cztM0_level2_quad_clean.evt |
| Size (bytes) | 446,719,680 | 84,594,240 |
| Size | 426.0 MB | 80.7 MB |
| Events in quadrant A | 2,710,764 | 573,586 |
| Events in quadrant B | 3,352,221 | 593,544 |
| Events in quadrant C | 3,075,479 | 552,423 |
| Events in quadrant D | 6,922,522 | 415,482 |
| Mode SS | |||
|---|---|---|---|
| Quadrant | BADHDUFLAG | Total packets | Discarded packets |
| A | 0 | 126 | 0 |
| B | 0 | 126 | 0 |
| C | 0 | 126 | 0 |
| D | 0 | 126 | 0 |
| Mode M9 | |||
|---|---|---|---|
| Quadrant | BADHDUFLAG | Total packets | Discarded packets |
| A | 0 | 9 | 0 |
| B | 0 | 9 | 0 |
| C | 0 | 9 | 0 |
| D | 0 | 9 | 0 |
| Mode M0 | |||
|---|---|---|---|
| Quadrant | BADHDUFLAG | Total packets | Discarded packets |
| A | 0 | 12787 | 1 |
| B | 0 | 14508 | 1 |
| C | 0 | 13738 | 2 |
| D | 0 | 24736 | 1 |
| Quadrant | Total seconds | Saturated seconds | Saturation percentage |
|---|---|---|---|
| A | 6101 | 111 | 1.819374% |
| B | 6101 | 304 | 4.982790% |
| C | 6100 | 78 | 1.278689% |
| D | 6101 | 1426 | 23.373218% |
Noise dominated data is calculated using 1-second bins in cleaned event files. If a bin has >2000 counts, and if more than 50% of those come from <1% of pixels, then it is considered to be noise-dominated and hence unusable.
| Quadrant | # 1 sec bins | Bins with >0 counts | Bins with >2000 counts | High rate bins dominated by noise | Noise dominated (total time) | Noise dominated (detector-on time) | Marked lightcurve |
|---|---|---|---|---|---|---|---|
| A | 7016 | 6102 | 14 | 14 | 0.20% | 0.23% | 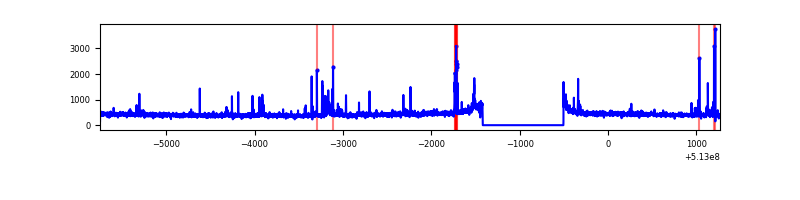 |
| B | 7016 | 6102 | 148 | 148 | 2.11% | 2.43% | 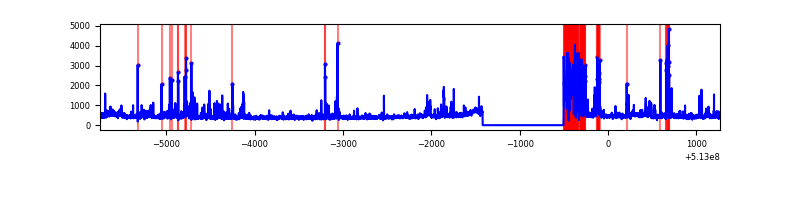 |
| C | 7015 | 6101 | 28 | 28 | 0.40% | 0.46% | 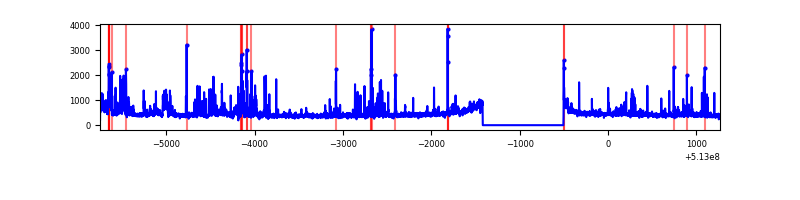 |
| D | 7016 | 6102 | 1264 | 1264 | 18.02% | 20.71% | 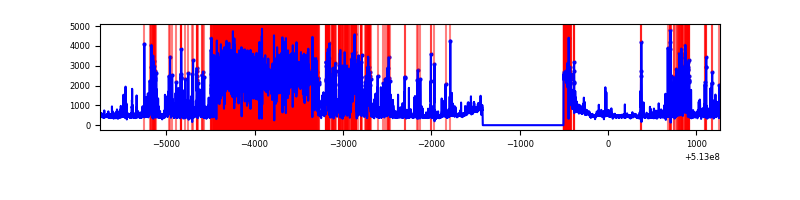 |
Top three noisy pixels from each quadrant. If the there are fewer than three noisy pixels in the level2.evt file, extra rows are filled as -1
| Pixel properties | Quadrant properties | ||||||
|---|---|---|---|---|---|---|---|
| Quadrant | DetID | PixID | Counts | Sigma | Mean | Median | Sigma |
| A | 6 | 211 | 91268 | 569.23 | 639 | 620 | 159.2 |
| A | 3 | 14 | 32114 | 197.77 | 639 | 620 | 159.2 |
| A | 4 | 249 | 31039 | 191.02 | 639 | 620 | 159.2 |
| B | 10 | 16 | 381239 | 2925.41 | 609 | 585 | 130.1 |
| B | 5 | 172 | 254649 | 1952.54 | 609 | 585 | 130.1 |
| B | 10 | 247 | 75284 | 574.08 | 609 | 585 | 130.1 |
| C | 13 | 3 | 353750 | 2122.17 | 612 | 607 | 166.4 |
| C | 7 | 220 | 71917 | 428.53 | 612 | 607 | 166.4 |
| C | 1 | 16 | 48553 | 288.12 | 612 | 607 | 166.4 |
| D | 2 | 249 | 2655062 | 17274.85 | 549 | 525 | 153.7 |
| D | 2 | 31 | 786556 | 5115.23 | 549 | 525 | 153.7 |
| D | 3 | 12 | 393332 | 2556.26 | 549 | 525 | 153.7 |
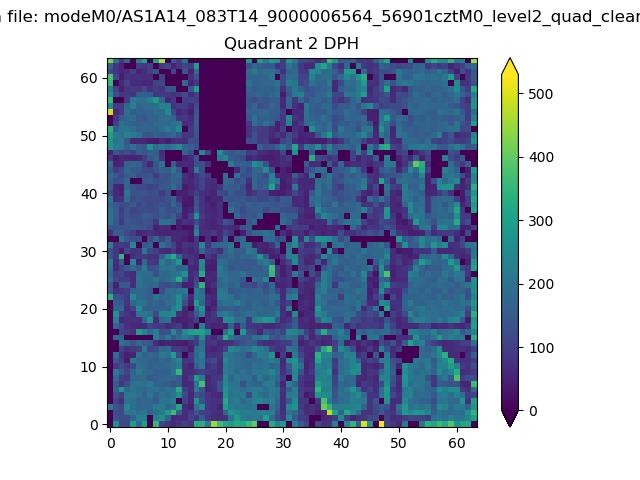
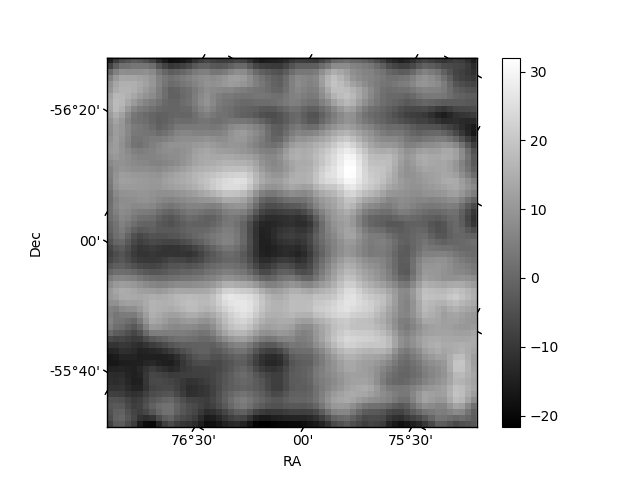
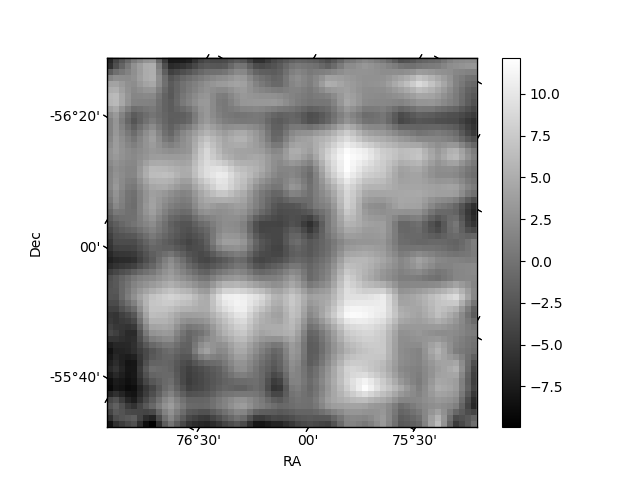
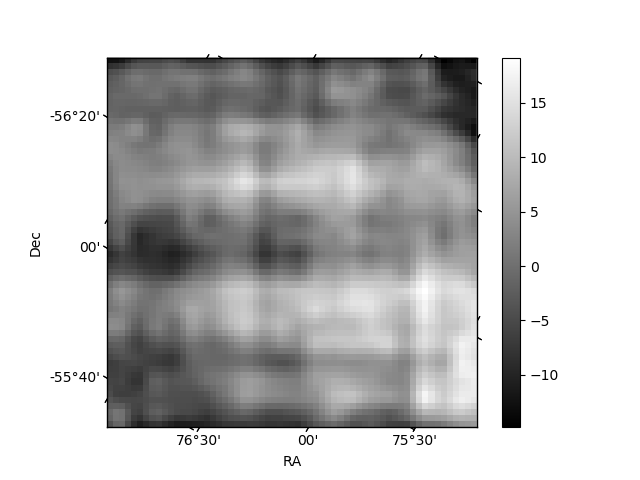
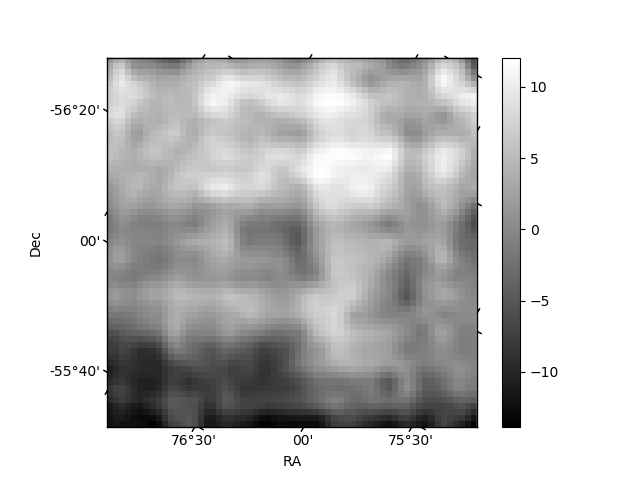
Histogram calculated using DETX and DETY for each event in the final _common_clean file
| Quadrant A | 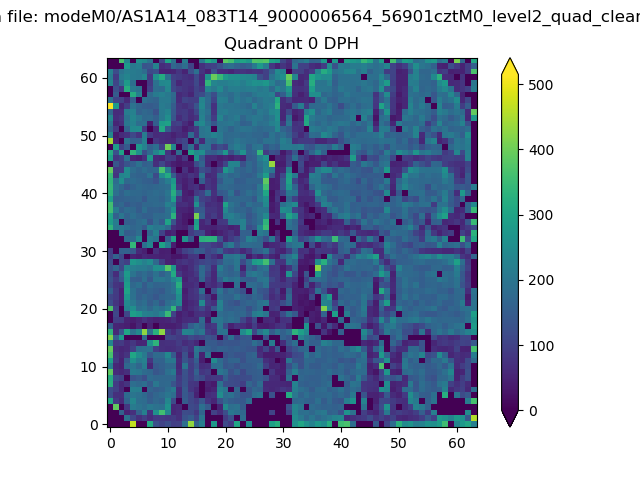 |
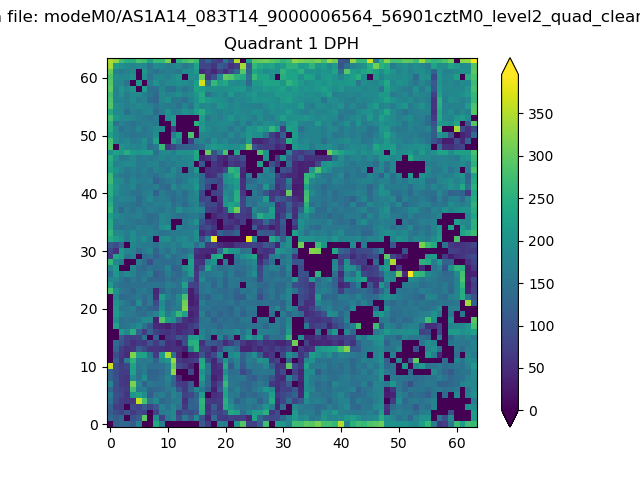 |
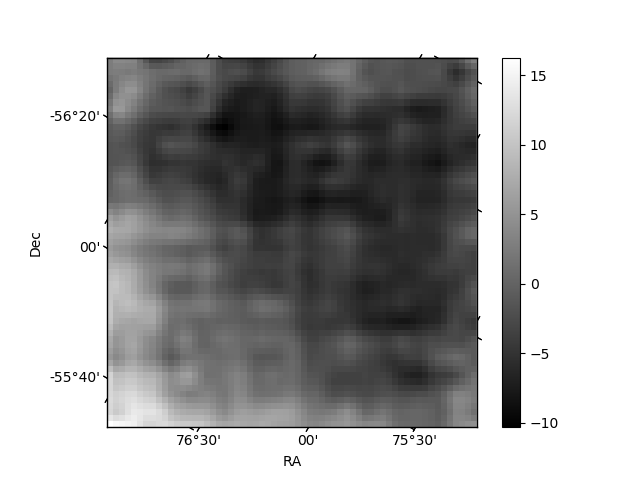
Quadrant B |
|---|---|---|---|
| Quadrant D | 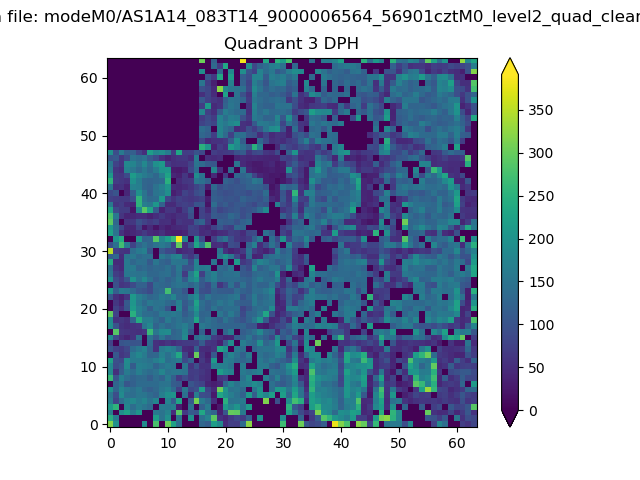 |
 |
Quadrant C |
| Plot type | Count rate plots | Images |
|---|---|---|
| Comparison with Poisson distribution Blue bars denote a histogram of data divided into 1 sec bins. Red curve is a Poisson curve with rate = median count rate of data. |
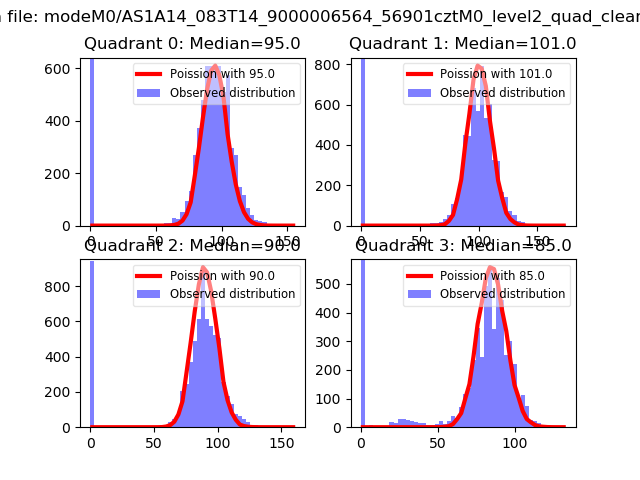 |
 |
| Quadrant-wise count rates Data is divided into 100 sec bins |
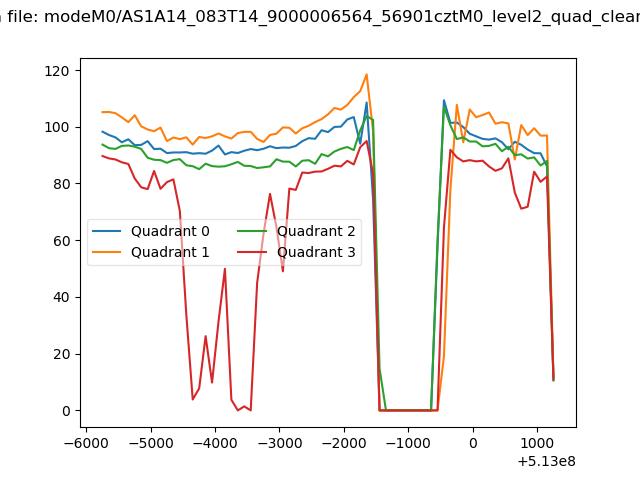 |
|
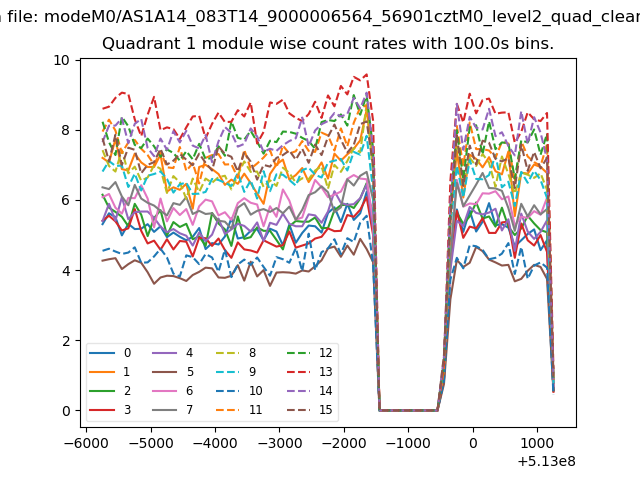
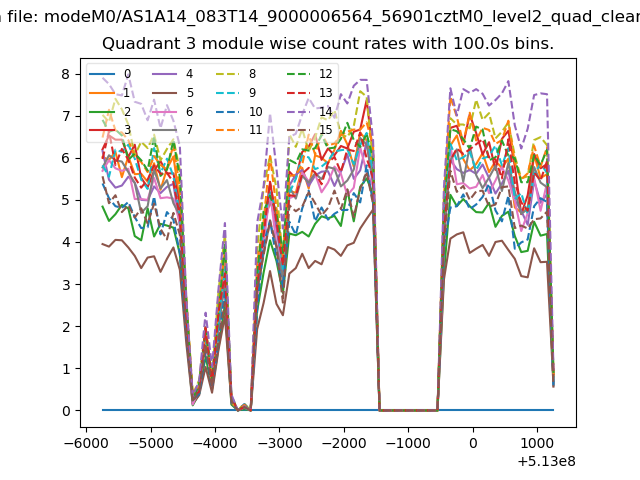
| Module-wise count rates for Quadrant A Data is divided into 100 sec bins |
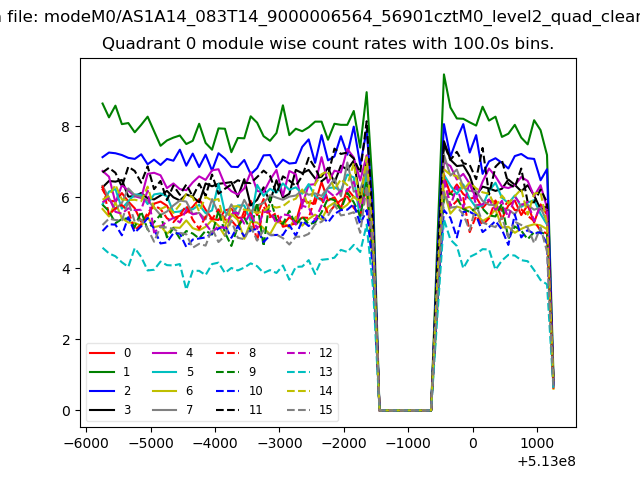 |
 |
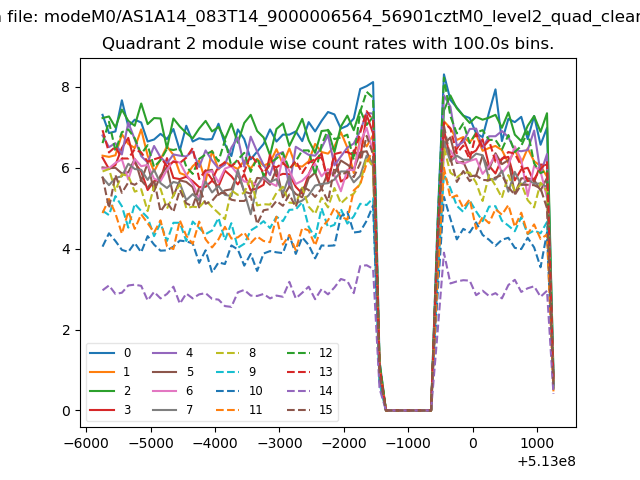
| Module-wise count rates for Quadrant B Data is divided into 100 sec bins |
 |
 |
| Module-wise count rates for Quadrant C Data is divided into 100 sec bins |
 |
 |
| Module-wise count rates for Quadrant D Data is divided into 100 sec bins |
 |
 |
| Parameter | Plot |
|---|---|
| CZT HV Monitor | 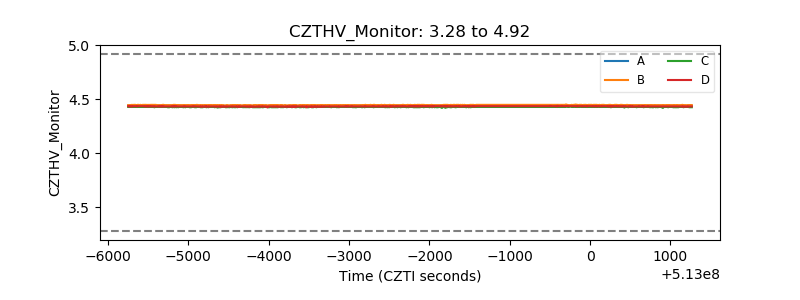 |
| D_VDD | 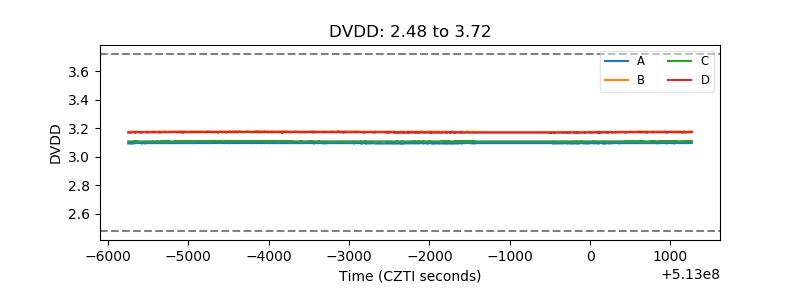 |
| Temperature 1 | 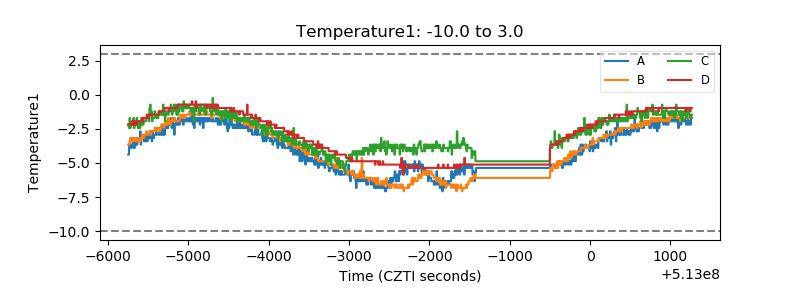 |
| Veto HV Monitor | 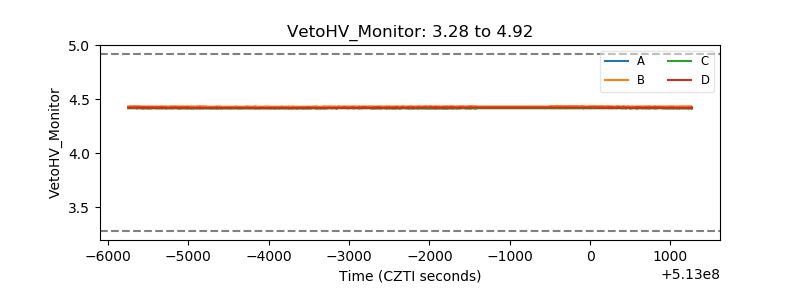 |
| Veto LLD | 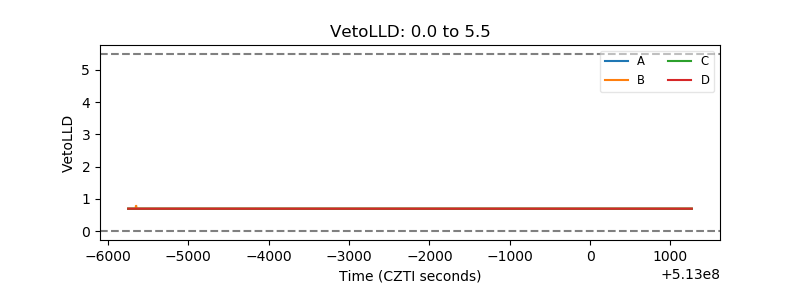 |
| Alpha Counter | 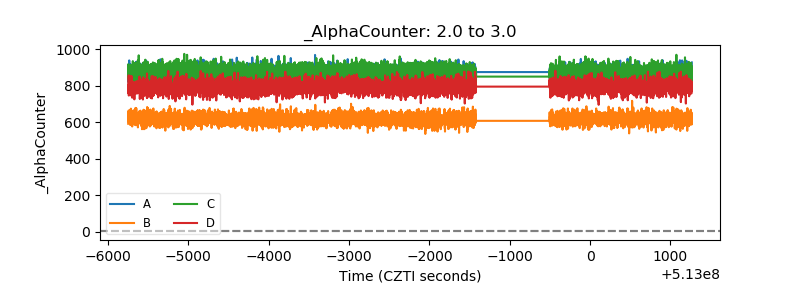 |
| _CPM_Rate | 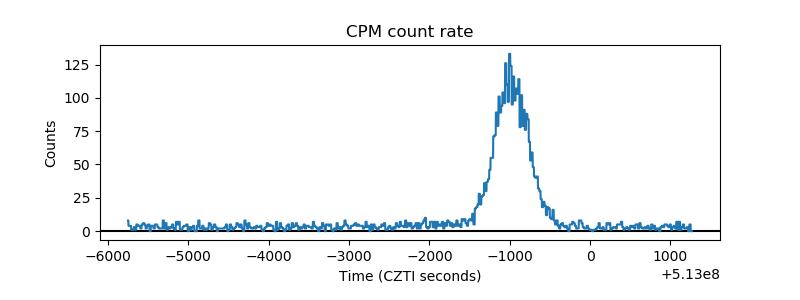 |
| CZT Counter | 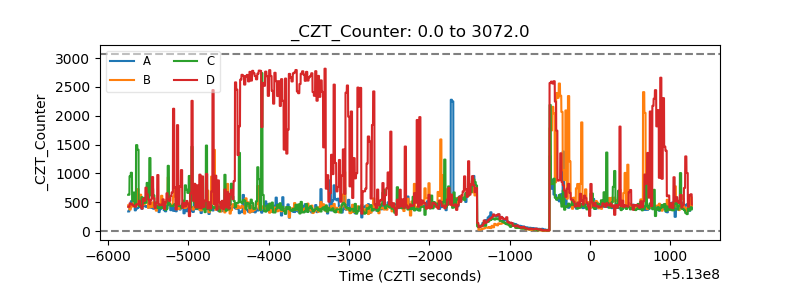 |
| +2.5 Volts monitor | 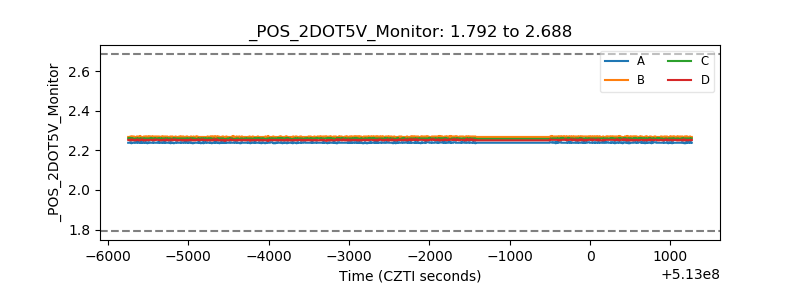 |
| +5 Volts monitor |  |
| _ROLL_ROT | 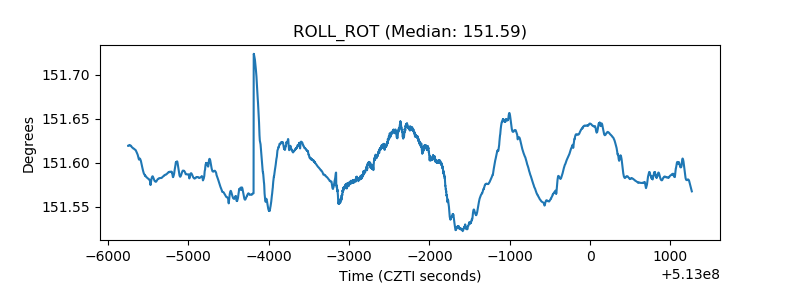 |
| _Roll_DEC | 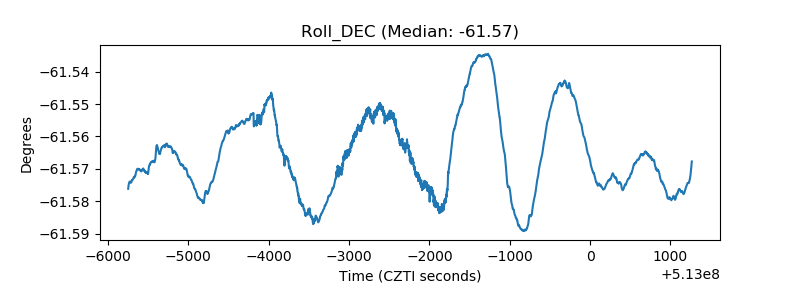 |
| _Roll_RA | 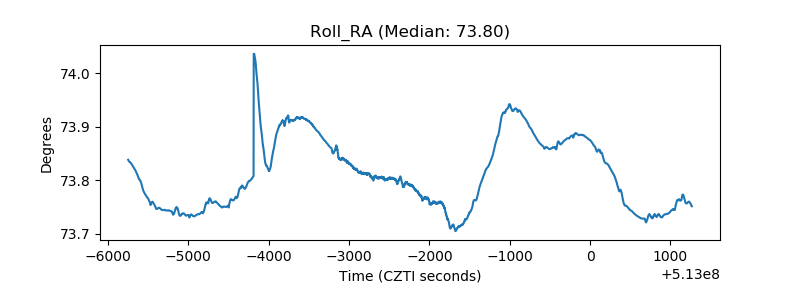 |
| Veto Counter | 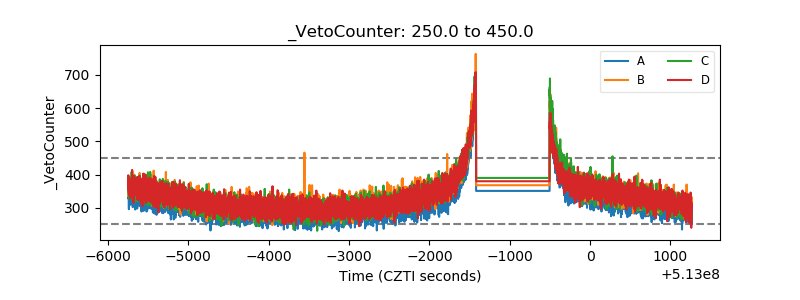 |