| Param | Original file | Final file |
|---|---|---|
| Filename | modeM0/AS1A14_083T14_9000006564_56902cztM0_level2.fits | modeM0/AS1A14_083T14_9000006564_56902cztM0_level2_quad_clean.evt |
| Size (bytes) | 542,727,360 | 90,501,120 |
| Size | 517.6 MB | 86.3 MB |
| Events in quadrant A | 3,071,859 | 618,400 |
| Events in quadrant B | 4,736,105 | 630,506 |
| Events in quadrant C | 4,118,639 | 578,986 |
| Events in quadrant D | 7,651,679 | 453,227 |
| Mode SS | |||
|---|---|---|---|
| Quadrant | BADHDUFLAG | Total packets | Discarded packets |
| A | 0 | 132 | 0 |
| B | 0 | 132 | 0 |
| C | 0 | 132 | 0 |
| D | 0 | 132 | 0 |
| Mode M9 | |||
|---|---|---|---|
| Quadrant | BADHDUFLAG | Total packets | Discarded packets |
| A | 0 | 6 | 0 |
| B | 0 | 6 | 0 |
| C | 0 | 6 | 0 |
| D | 0 | 6 | 0 |
| Mode M0 | |||
|---|---|---|---|
| Quadrant | BADHDUFLAG | Total packets | Discarded packets |
| A | 0 | 14216 | 1 |
| B | 0 | 18707 | 1 |
| C | 0 | 17328 | 1 |
| D | 0 | 27345 | 1 |
| Quadrant | Total seconds | Saturated seconds | Saturation percentage |
|---|---|---|---|
| A | 6589 | 105 | 1.593565% |
| B | 6589 | 430 | 6.526028% |
| C | 6590 | 293 | 4.446131% |
| D | 6590 | 1513 | 22.959029% |
Noise dominated data is calculated using 1-second bins in cleaned event files. If a bin has >2000 counts, and if more than 50% of those come from <1% of pixels, then it is considered to be noise-dominated and hence unusable.
| Quadrant | # 1 sec bins | Bins with >0 counts | Bins with >2000 counts | High rate bins dominated by noise | Noise dominated (total time) | Noise dominated (detector-on time) | Marked lightcurve |
|---|---|---|---|---|---|---|---|
| A | 7169 | 6590 | 30 | 30 | 0.42% | 0.46% | 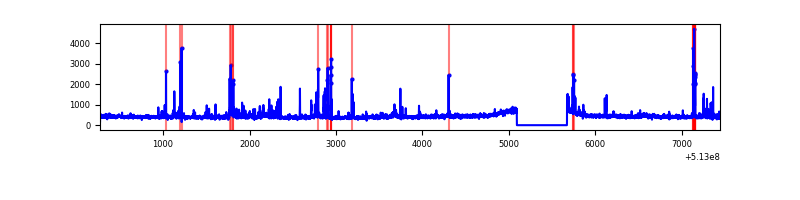 |
| B | 7169 | 6590 | 216 | 216 | 3.01% | 3.28% | 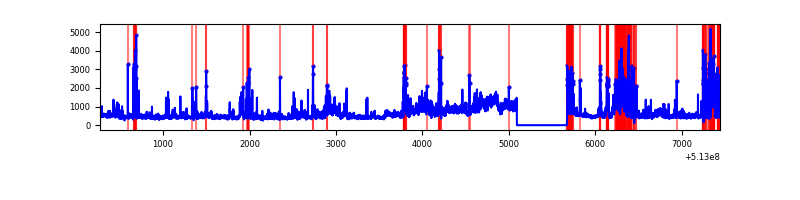 |
| C | 7170 | 6591 | 223 | 223 | 3.11% | 3.38% | 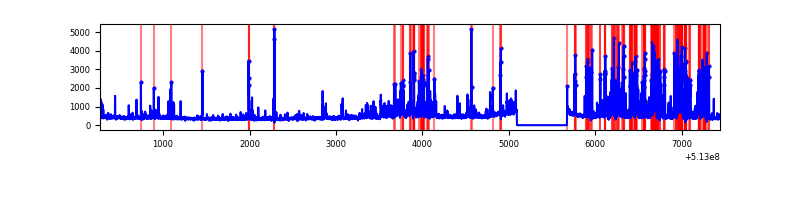 |
| D | 7170 | 6591 | 1332 | 1332 | 18.58% | 20.21% | 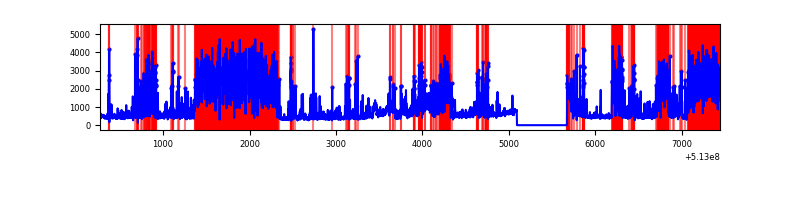 |
Top three noisy pixels from each quadrant. If the there are fewer than three noisy pixels in the level2.evt file, extra rows are filled as -1
| Pixel properties | Quadrant properties | ||||||
|---|---|---|---|---|---|---|---|
| Quadrant | DetID | PixID | Counts | Sigma | Mean | Median | Sigma |
| A | 4 | 249 | 129995 | 757.79 | 683 | 664 | 170.7 |
| A | 10 | 251 | 120604 | 702.76 | 683 | 664 | 170.7 |
| A | 6 | 211 | 82602 | 480.1 | 683 | 664 | 170.7 |
| B | 5 | 172 | 951972 | 6773.36 | 658 | 634 | 140.5 |
| B | 5 | 185 | 576692 | 4101.43 | 658 | 634 | 140.5 |
| B | 0 | 171 | 130968 | 927.96 | 658 | 634 | 140.5 |
| C | 12 | 254 | 647227 | 3651.88 | 646 | 639 | 177.1 |
| C | 13 | 3 | 336189 | 1895.16 | 646 | 639 | 177.1 |
| C | 9 | 38 | 319730 | 1802.2 | 646 | 639 | 177.1 |
| D | 2 | 249 | 2984177 | 17685.97 | 595 | 567 | 168.7 |
| D | 7 | 96 | 1068657 | 6331.32 | 595 | 567 | 168.7 |
| D | 8 | 240 | 756524 | 4481.09 | 595 | 567 | 168.7 |
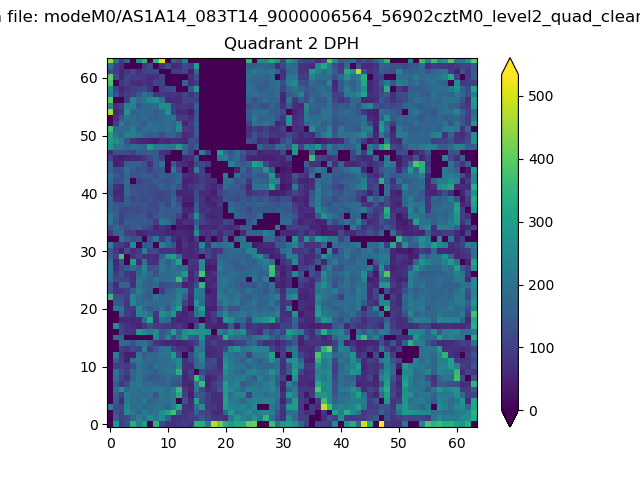
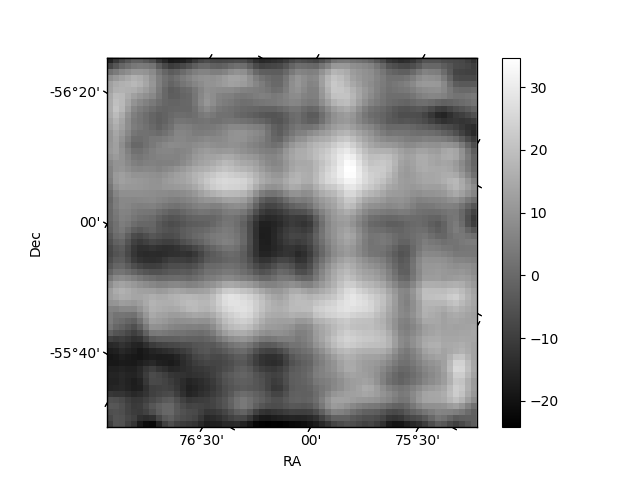
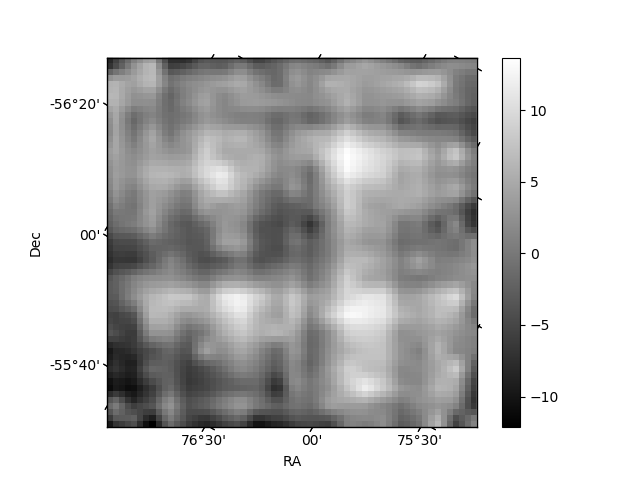
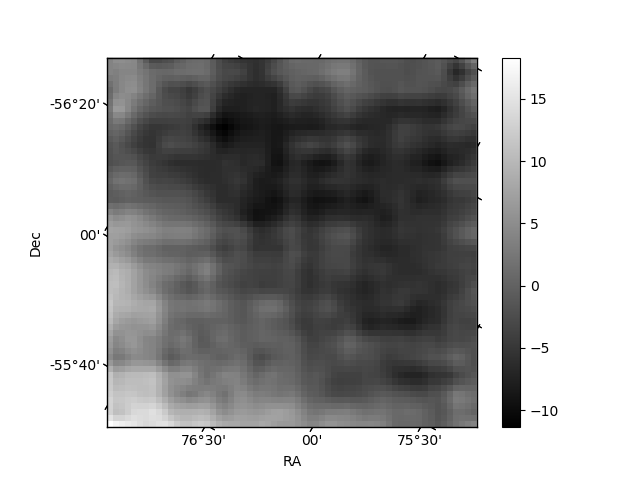
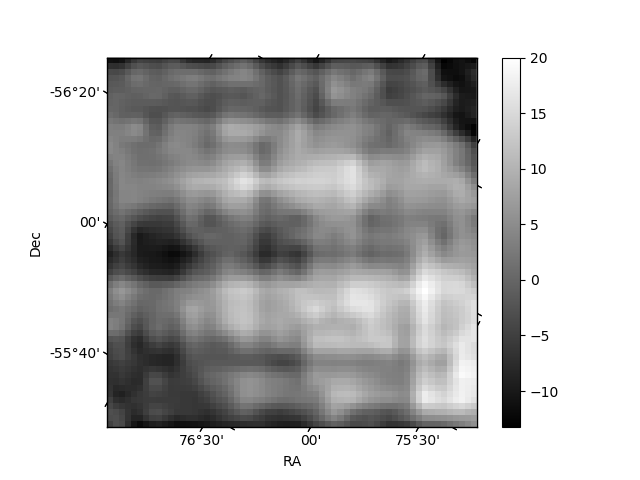
Histogram calculated using DETX and DETY for each event in the final _common_clean file
| Quadrant A | 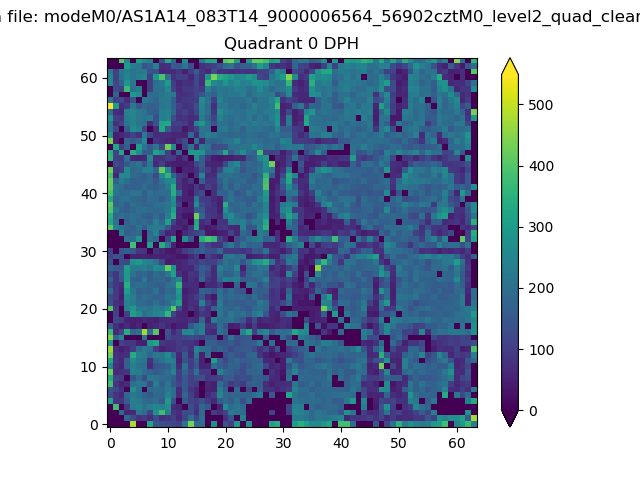 |
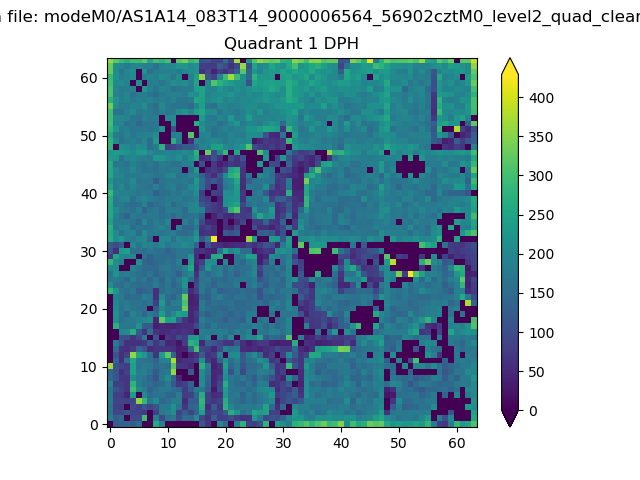 |
Quadrant B |
|---|---|---|---|
| Quadrant D | 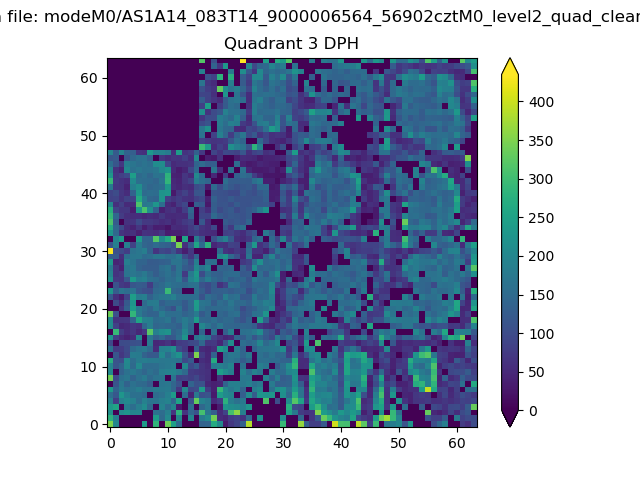 |
 |
Quadrant C |
| Plot type | Count rate plots | Images |
|---|---|---|
| Comparison with Poisson distribution Blue bars denote a histogram of data divided into 1 sec bins. Red curve is a Poisson curve with rate = median count rate of data. |
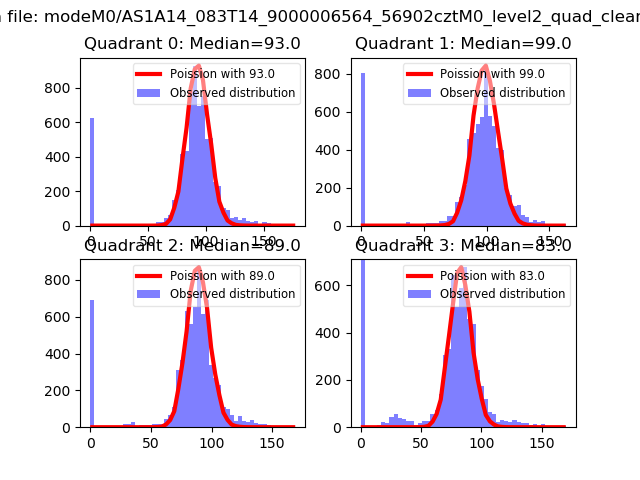 |
 |
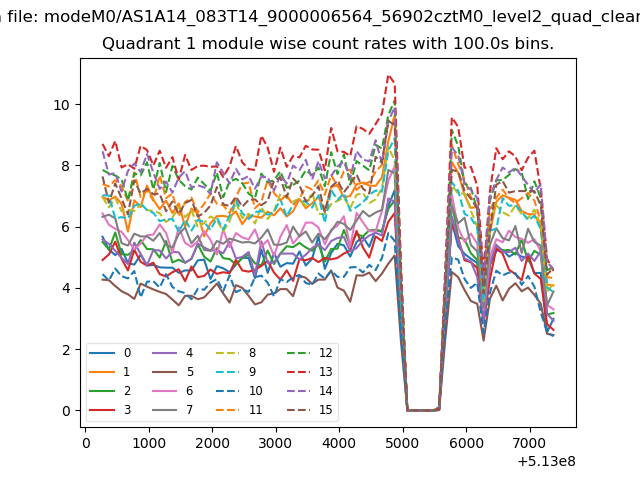
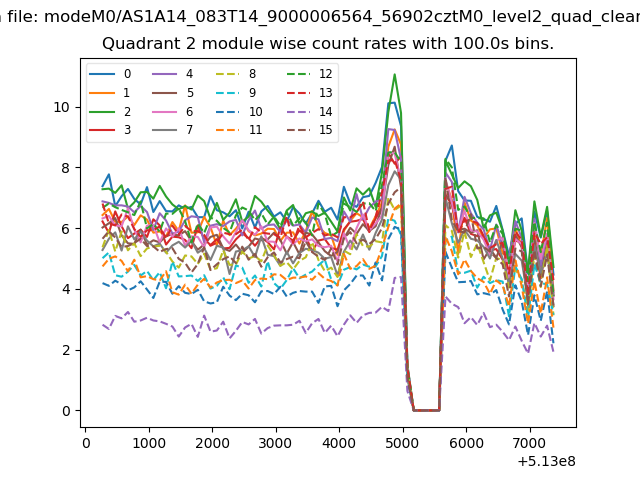
| Quadrant-wise count rates Data is divided into 100 sec bins |
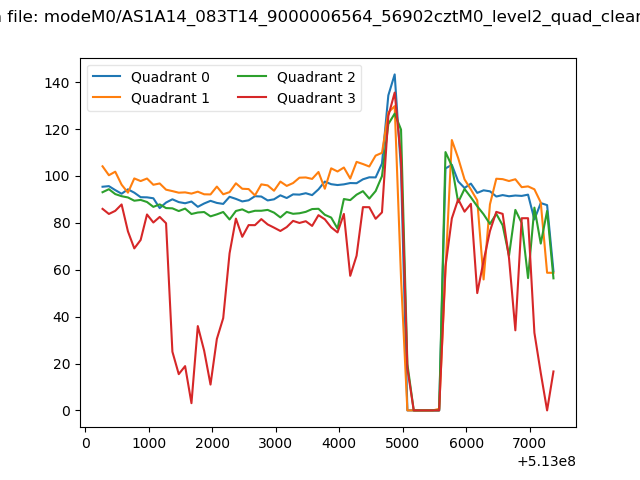 |
|
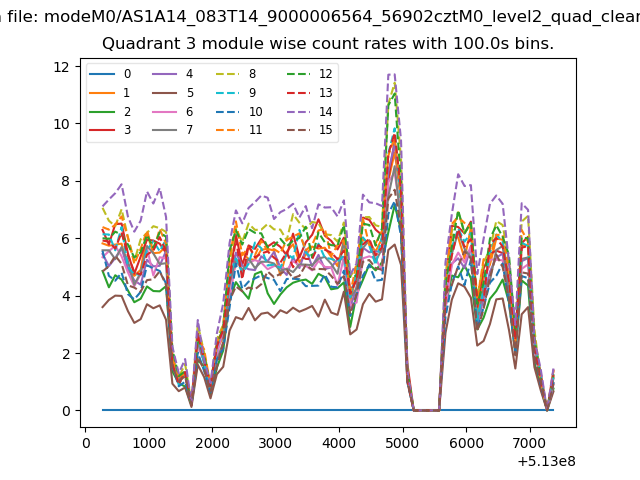
| Module-wise count rates for Quadrant A Data is divided into 100 sec bins |
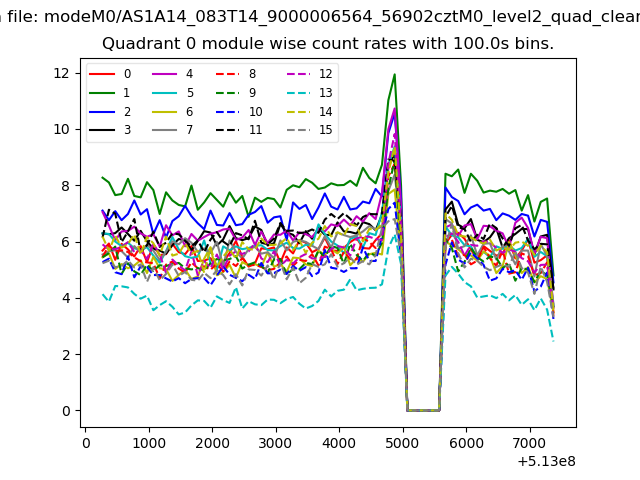 |
 |
| Module-wise count rates for Quadrant B Data is divided into 100 sec bins |
 |
 |
| Module-wise count rates for Quadrant C Data is divided into 100 sec bins |
 |
 |
| Module-wise count rates for Quadrant D Data is divided into 100 sec bins |
 |
 |
| Parameter | Plot |
|---|---|
| CZT HV Monitor | 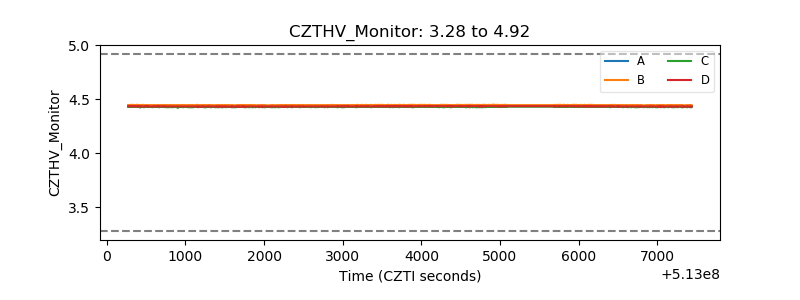 |
| D_VDD | 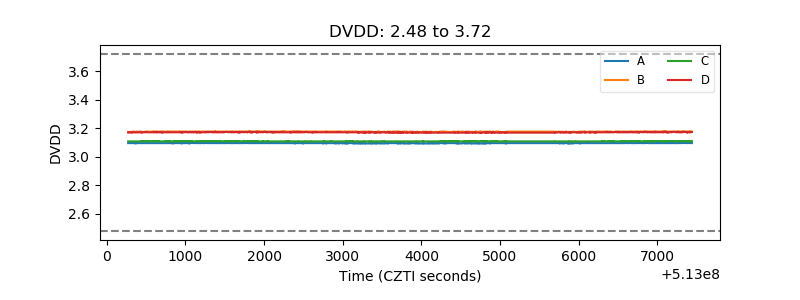 |
| Temperature 1 | 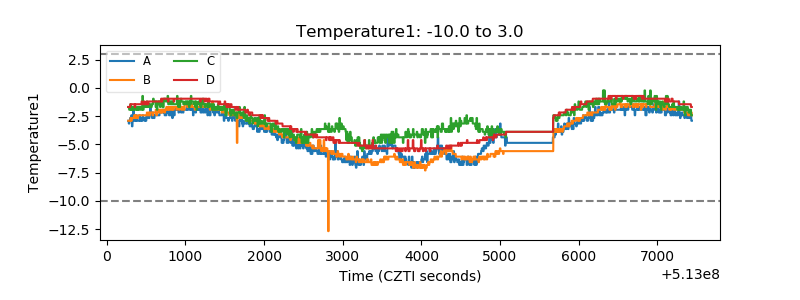 |
| Veto HV Monitor | 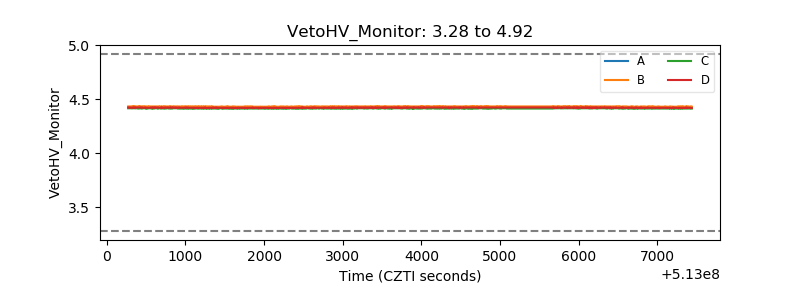 |
| Veto LLD | 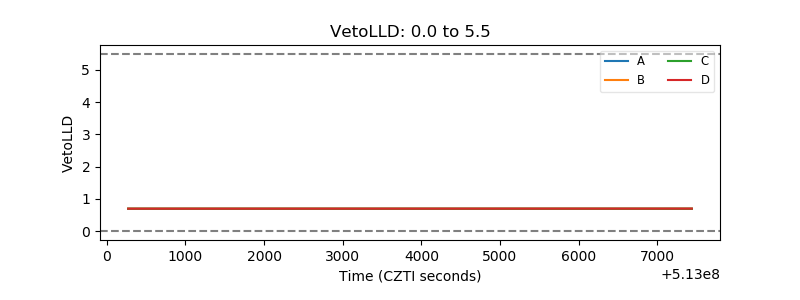 |
| Alpha Counter | 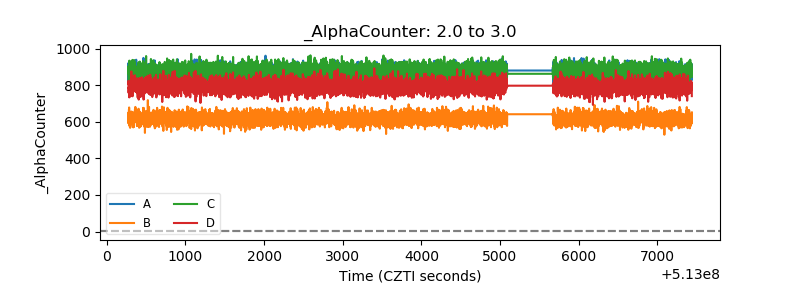 |
| _CPM_Rate | 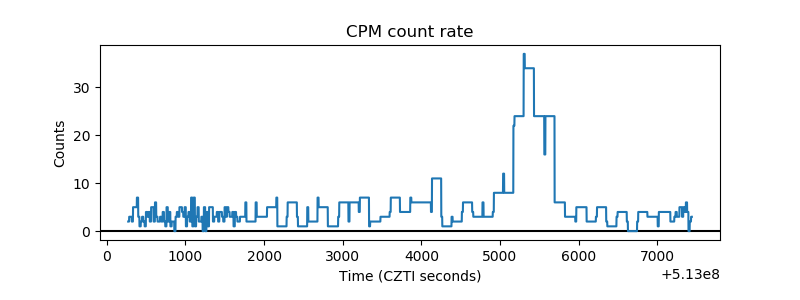 |
| CZT Counter | 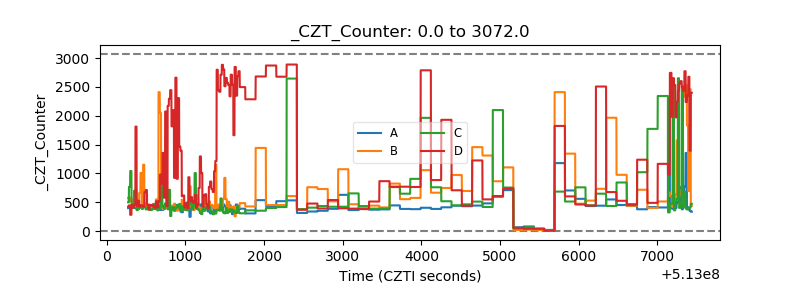 |
| +2.5 Volts monitor | 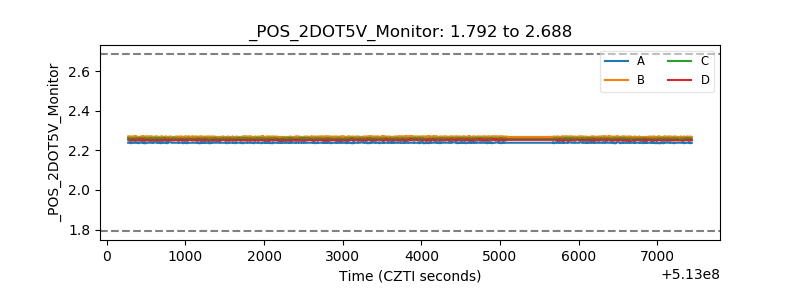 |
| +5 Volts monitor |  |
| _ROLL_ROT | 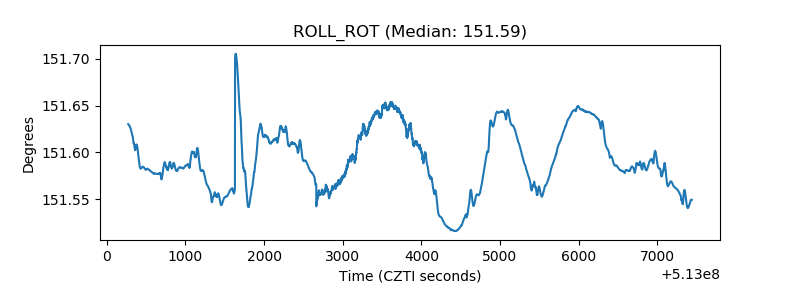 |
| _Roll_DEC | 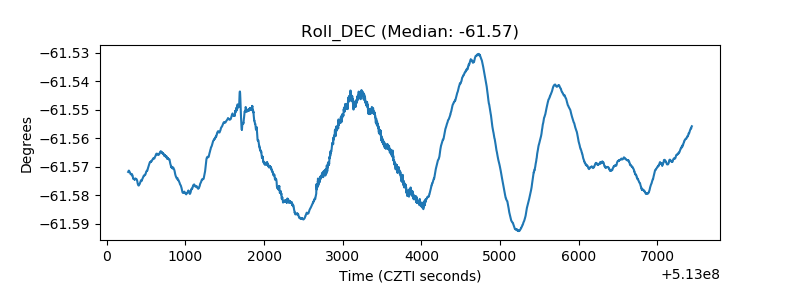 |
| _Roll_RA | 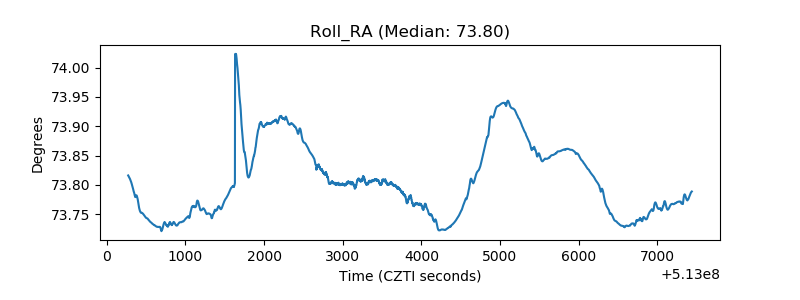 |
| Veto Counter | 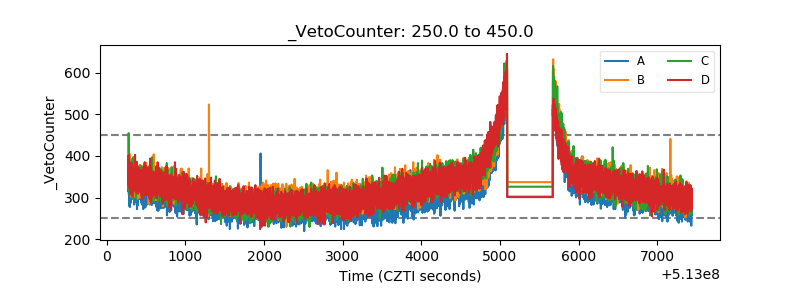 |