| Param | Original file | Final file |
|---|---|---|
| Filename | modeM0/AS1A14_083T14_9000006564_56903cztM0_level2.fits | modeM0/AS1A14_083T14_9000006564_56903cztM0_level2_quad_clean.evt |
| Size (bytes) | 664,839,360 | 96,638,400 |
| Size | 634.0 MB | 92.2 MB |
| Events in quadrant A | 5,987,588 | 635,044 |
| Events in quadrant B | 4,585,426 | 700,604 |
| Events in quadrant C | 6,530,295 | 587,427 |
| Events in quadrant D | 6,949,891 | 502,369 |
| Mode SS | |||
|---|---|---|---|
| Quadrant | BADHDUFLAG | Total packets | Discarded packets |
| A | 0 | 144 | 2 |
| B | 0 | 144 | 0 |
| C | 0 | 144 | 0 |
| D | 0 | 144 | 0 |
| Mode M0 | |||
|---|---|---|---|
| Quadrant | BADHDUFLAG | Total packets | Discarded packets |
| A | 0 | 22946 | 47 |
| B | 0 | 18824 | 222 |
| C | 0 | 24755 | 125 |
| D | 0 | 25861 | 124 |
| Quadrant | Total seconds | Saturated seconds | Saturation percentage |
|---|---|---|---|
| A | 7193 | 534 | 7.423884% |
| B | 7183 | 318 | 4.427120% |
| C | 7189 | 827 | 11.503686% |
| D | 7181 | 1259 | 17.532377% |
Noise dominated data is calculated using 1-second bins in cleaned event files. If a bin has >2000 counts, and if more than 50% of those come from <1% of pixels, then it is considered to be noise-dominated and hence unusable.
| Quadrant | # 1 sec bins | Bins with >0 counts | Bins with >2000 counts | High rate bins dominated by noise | Noise dominated (total time) | Noise dominated (detector-on time) | Marked lightcurve |
|---|---|---|---|---|---|---|---|
| A | 7205 | 7200 | 510 | 510 | 7.08% | 7.08% | 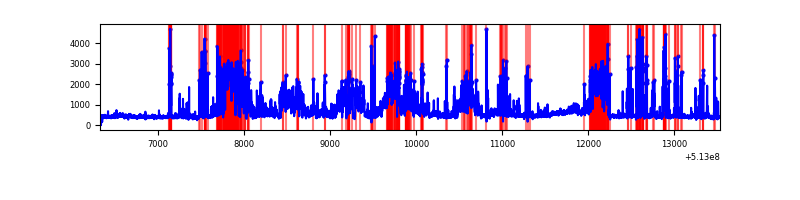 |
| B | 7199 | 7191 | 245 | 245 | 3.40% | 3.41% | 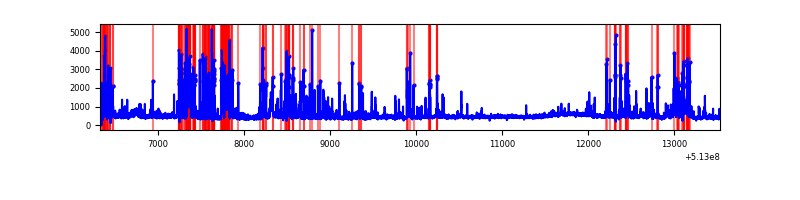 |
| C | 7197 | 7195 | 679 | 679 | 9.43% | 9.44% | 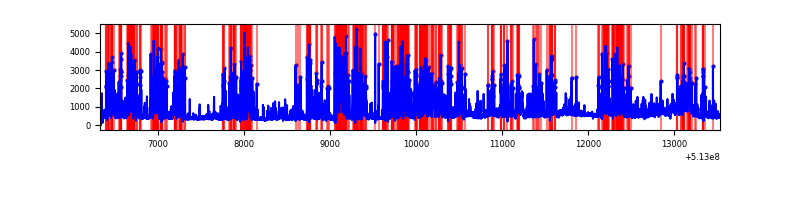 |
| D | 7196 | 7191 | 1128 | 1128 | 15.68% | 15.69% | 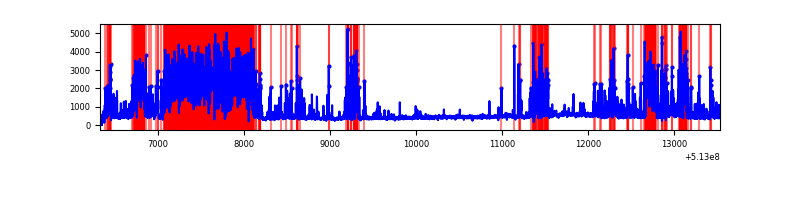 |
Top three noisy pixels from each quadrant. If the there are fewer than three noisy pixels in the level2.evt file, extra rows are filled as -1
| Pixel properties | Quadrant properties | ||||||
|---|---|---|---|---|---|---|---|
| Quadrant | DetID | PixID | Counts | Sigma | Mean | Median | Sigma |
| A | 4 | 249 | 2375248 | 13191.79 | 727 | 710 | 180.0 |
| A | 3 | 62 | 319535 | 1771.24 | 727 | 710 | 180.0 |
| A | 10 | 251 | 286817 | 1589.47 | 727 | 710 | 180.0 |
| B | 5 | 185 | 818666 | 5288.75 | 724 | 696 | 154.7 |
| B | 5 | 172 | 381953 | 2465.09 | 724 | 696 | 154.7 |
| B | 0 | 171 | 122366 | 786.68 | 724 | 696 | 154.7 |
| C | 12 | 254 | 1936565 | 10294.09 | 685 | 677 | 188.1 |
| C | 13 | 3 | 1449442 | 7703.81 | 685 | 677 | 188.1 |
| C | 9 | 38 | 205735 | 1090.4 | 685 | 677 | 188.1 |
| D | 2 | 249 | 2687548 | 14454.97 | 658 | 628 | 185.9 |
| D | 8 | 240 | 1177062 | 6328.93 | 658 | 628 | 185.9 |
| D | 3 | 12 | 202729 | 1087.25 | 658 | 628 | 185.9 |
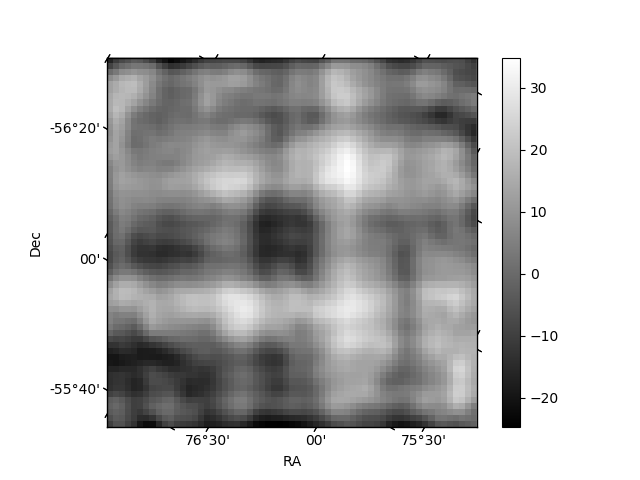
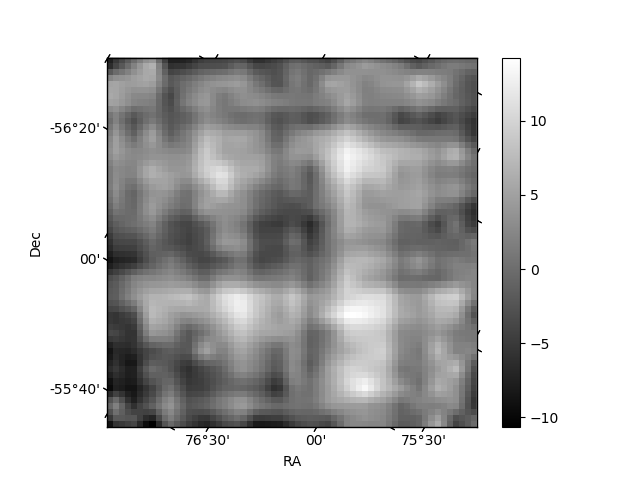
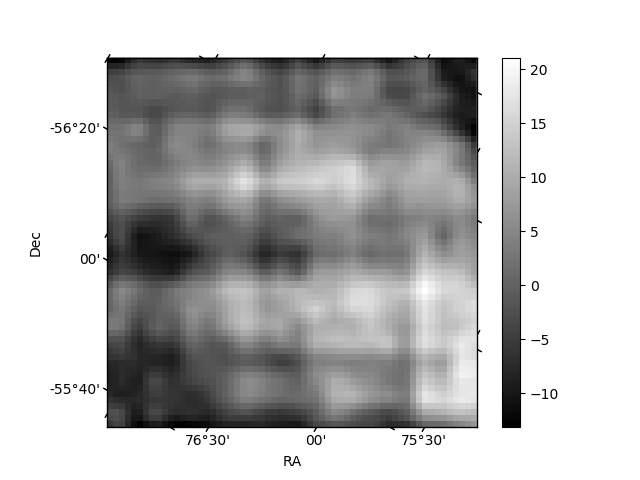
Histogram calculated using DETX and DETY for each event in the final _common_clean file
| Quadrant A | 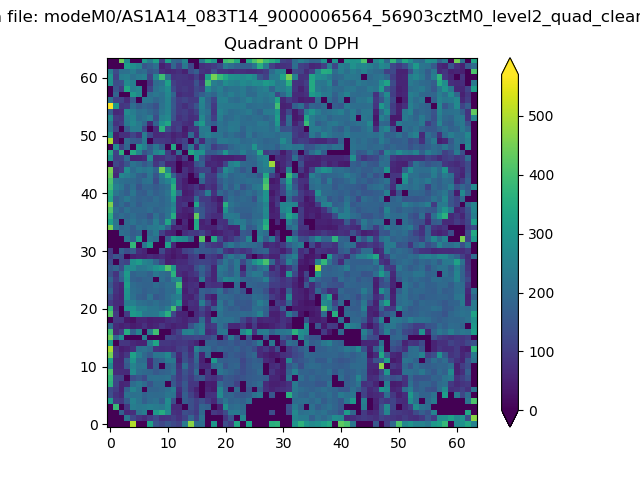 |
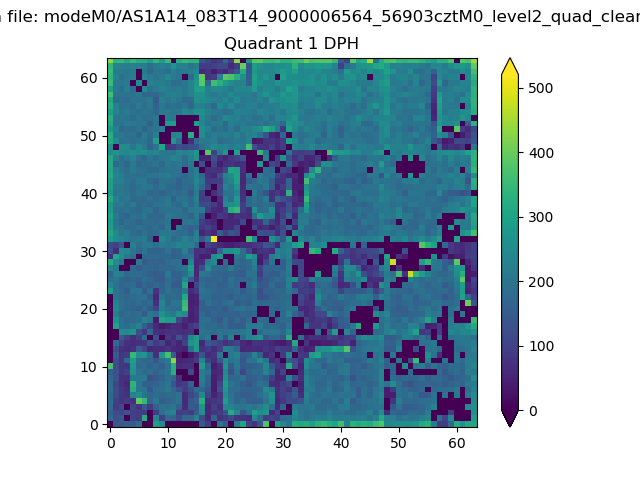 |
Quadrant B |
|---|---|---|---|
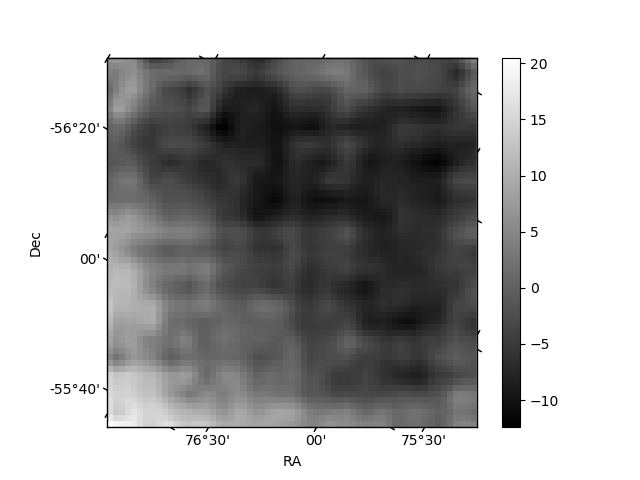
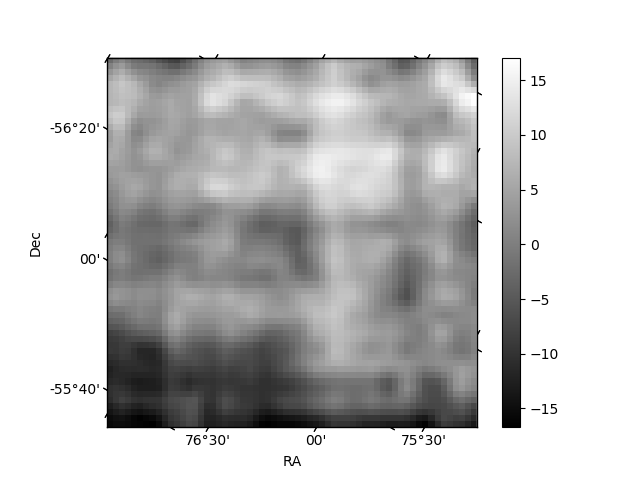
| Quadrant D | 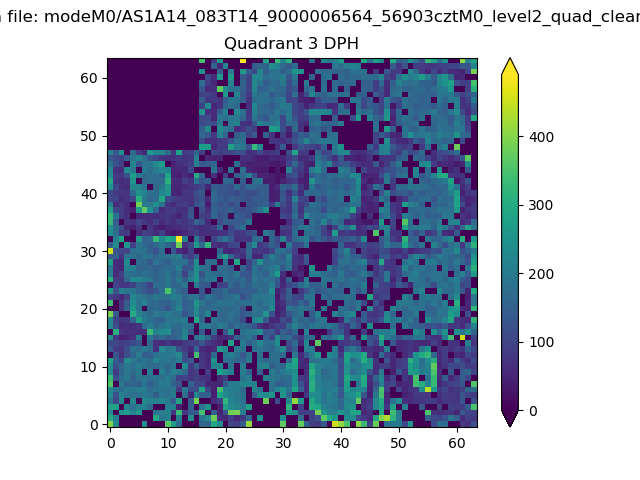 |
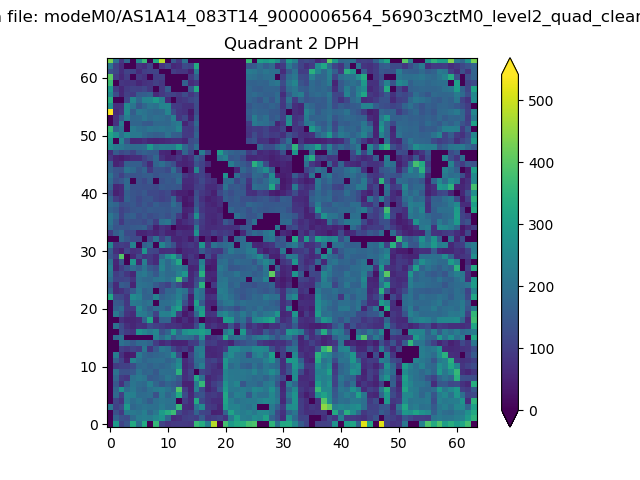 |
Quadrant C |
| Plot type | Count rate plots | Images |
|---|---|---|
| Comparison with Poisson distribution Blue bars denote a histogram of data divided into 1 sec bins. Red curve is a Poisson curve with rate = median count rate of data. |
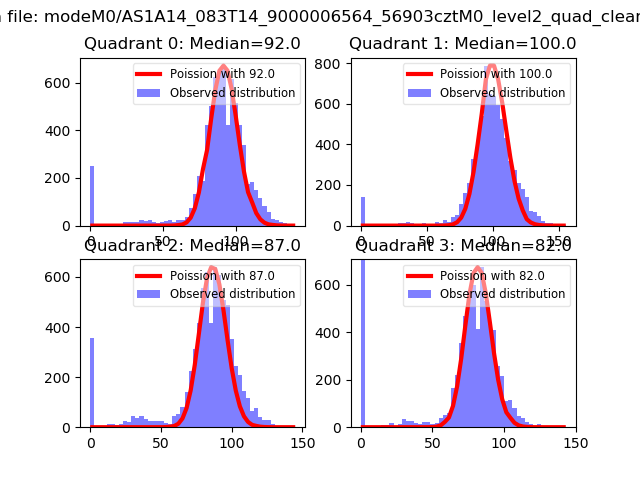 |
 |
| Quadrant-wise count rates Data is divided into 100 sec bins |
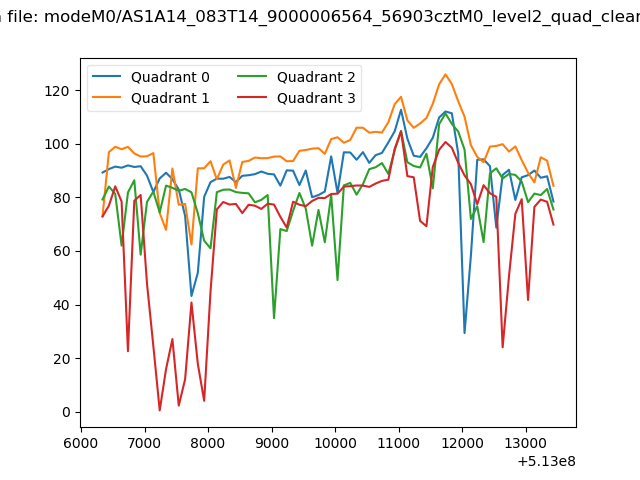 |
|
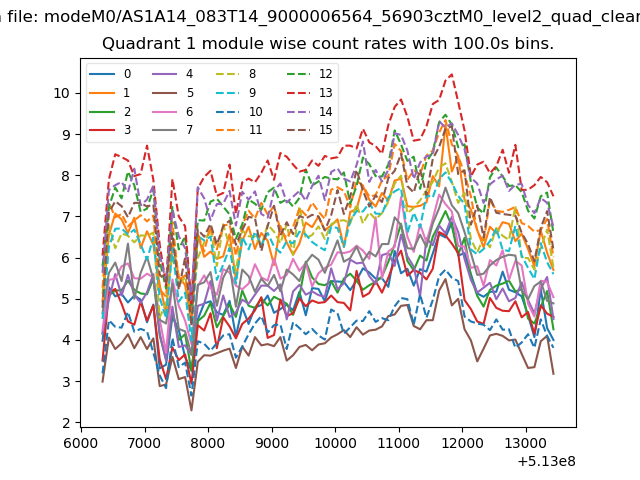
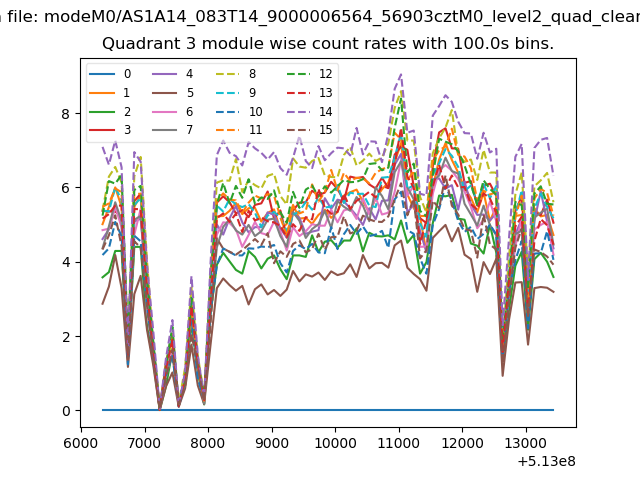
| Module-wise count rates for Quadrant A Data is divided into 100 sec bins |
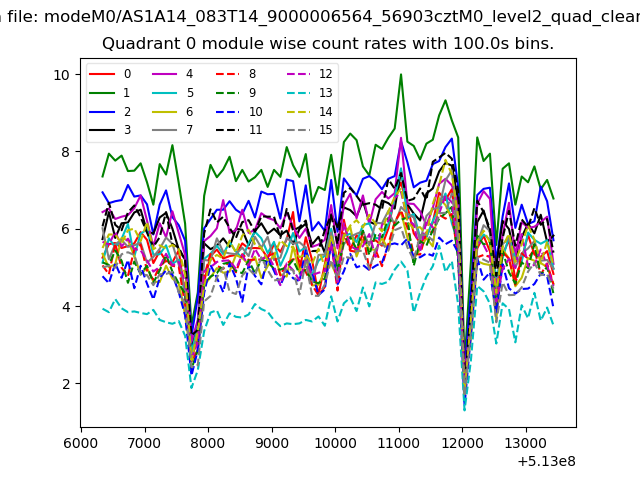 |
 |
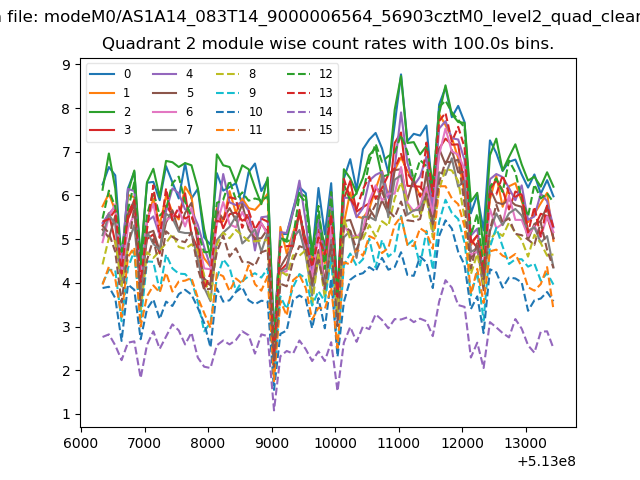
| Module-wise count rates for Quadrant B Data is divided into 100 sec bins |
 |
 |
| Module-wise count rates for Quadrant C Data is divided into 100 sec bins |
 |
 |
| Module-wise count rates for Quadrant D Data is divided into 100 sec bins |
 |
 |
| Parameter | Plot |
|---|---|
| CZT HV Monitor | 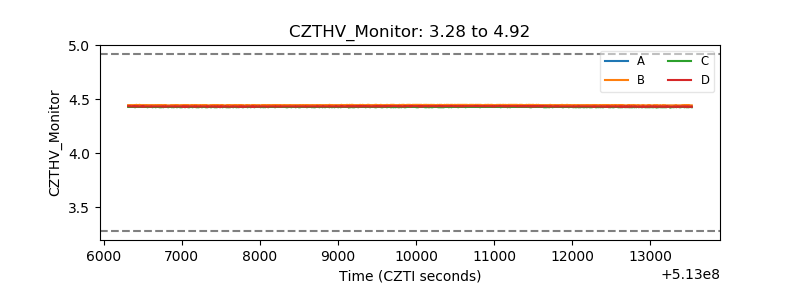 |
| D_VDD | 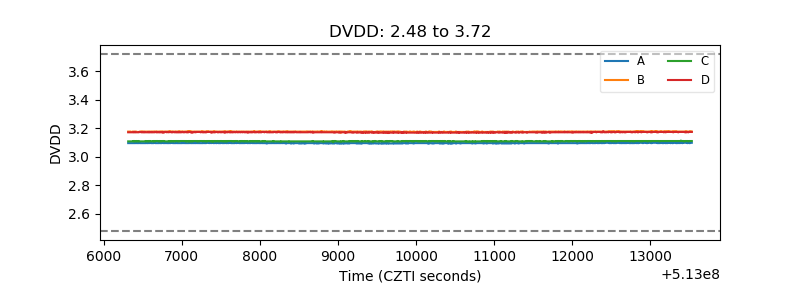 |
| Temperature 1 | 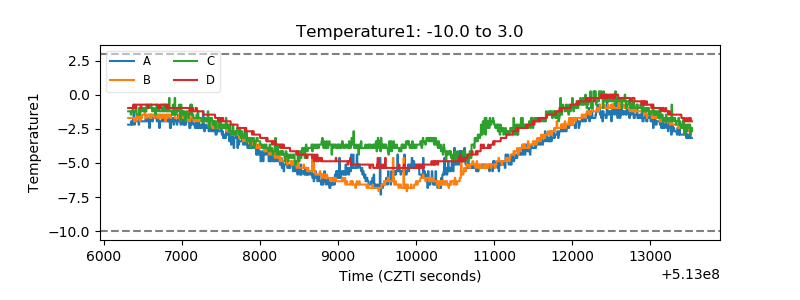 |
| Veto HV Monitor |  |
| Veto LLD | 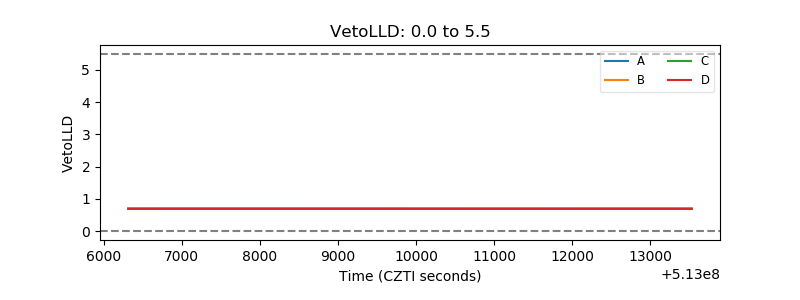 |
| Alpha Counter | 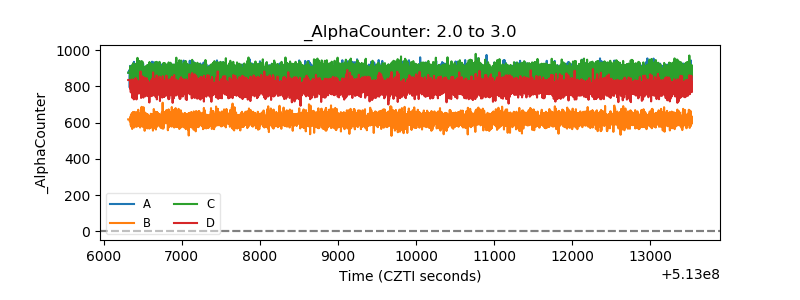 |
| _CPM_Rate | 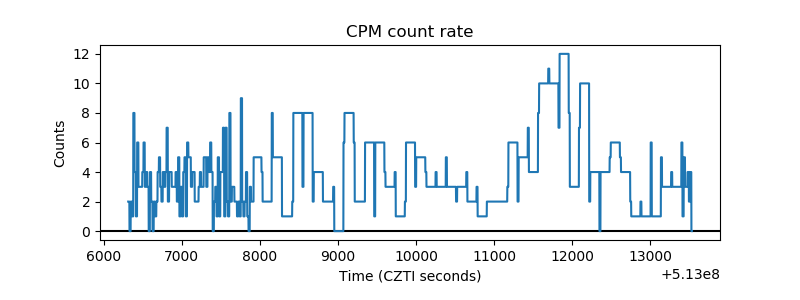 |
| CZT Counter | 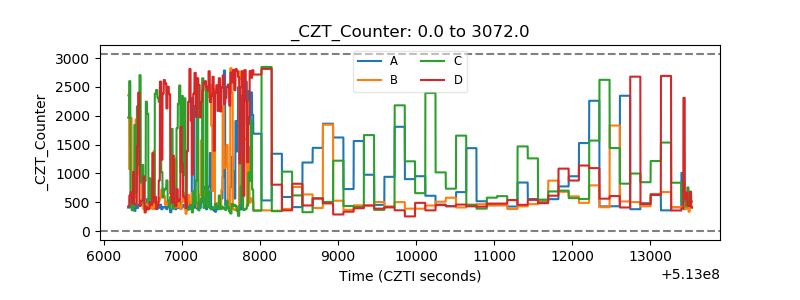 |
| +2.5 Volts monitor |  |
| +5 Volts monitor | 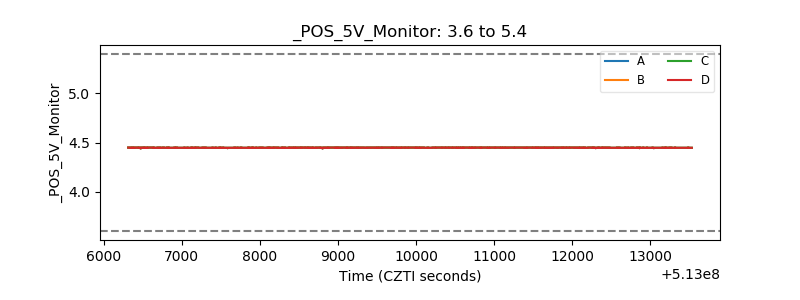 |
| _ROLL_ROT | 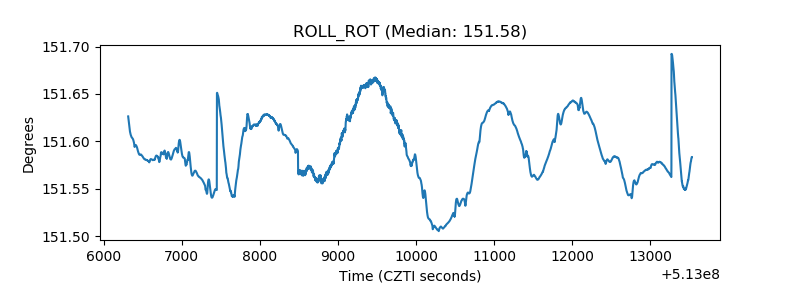 |
| _Roll_DEC | 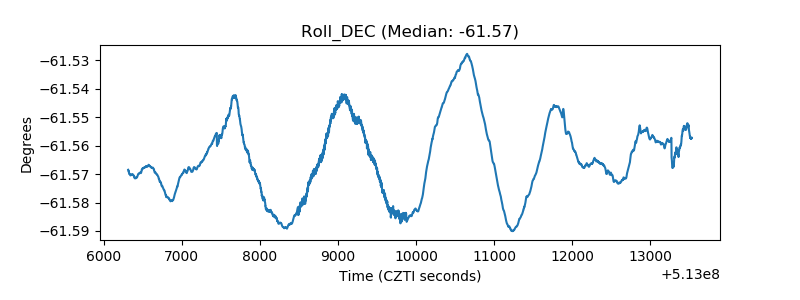 |
| _Roll_RA | 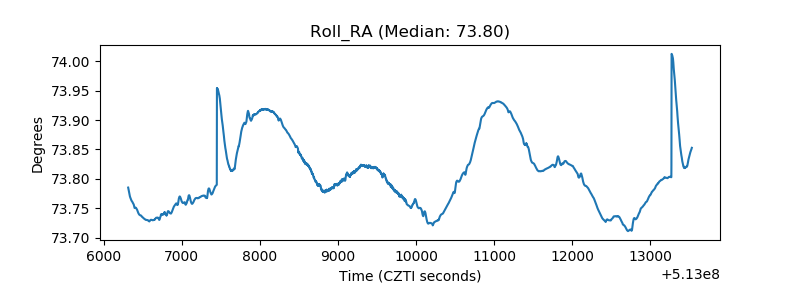 |
| Veto Counter | 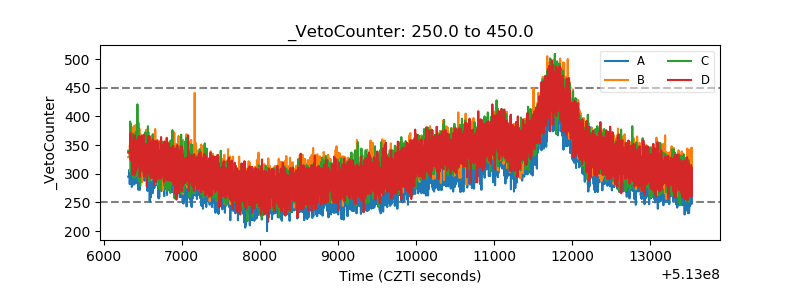 |