| Param | Original file | Final file |
|---|---|---|
| Filename | modeM0/AS1A14_083T14_9000006564_56904cztM0_level2.fits | modeM0/AS1A14_083T14_9000006564_56904cztM0_level2_quad_clean.evt |
| Size (bytes) | 600,073,920 | 95,558,400 |
| Size | 572.3 MB | 91.1 MB |
| Events in quadrant A | 3,948,333 | 641,289 |
| Events in quadrant B | 4,675,590 | 664,036 |
| Events in quadrant C | 7,103,459 | 545,826 |
| Events in quadrant D | 5,929,415 | 543,266 |
| Mode SS | |||
|---|---|---|---|
| Quadrant | BADHDUFLAG | Total packets | Discarded packets |
| A | 0 | 146 | 2 |
| B | 0 | 146 | 2 |
| C | 0 | 146 | 2 |
| D | 0 | 146 | 4 |
| Mode M0 | |||
|---|---|---|---|
| Quadrant | BADHDUFLAG | Total packets | Discarded packets |
| A | 0 | 17652 | 361 |
| B | 0 | 19166 | 262 |
| C | 0 | 26315 | 305 |
| D | 0 | 23088 | 348 |
| Quadrant | Total seconds | Saturated seconds | Saturation percentage |
|---|---|---|---|
| A | 7153 | 303 | 4.235985% |
| B | 7166 | 538 | 7.507675% |
| C | 7166 | 1105 | 15.420039% |
| D | 7159 | 720 | 10.057271% |
Noise dominated data is calculated using 1-second bins in cleaned event files. If a bin has >2000 counts, and if more than 50% of those come from <1% of pixels, then it is considered to be noise-dominated and hence unusable.
| Quadrant | # 1 sec bins | Bins with >0 counts | Bins with >2000 counts | High rate bins dominated by noise | Noise dominated (total time) | Noise dominated (detector-on time) | Marked lightcurve |
|---|---|---|---|---|---|---|---|
| A | 7205 | 7178 | 231 | 231 | 3.21% | 3.22% | 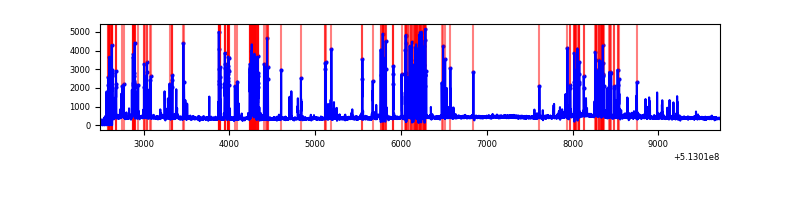 |
| B | 7224 | 7179 | 377 | 377 | 5.22% | 5.25% | 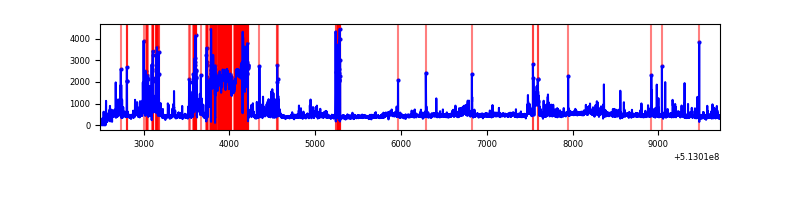 |
| C | 7201 | 7182 | 933 | 933 | 12.96% | 12.99% | 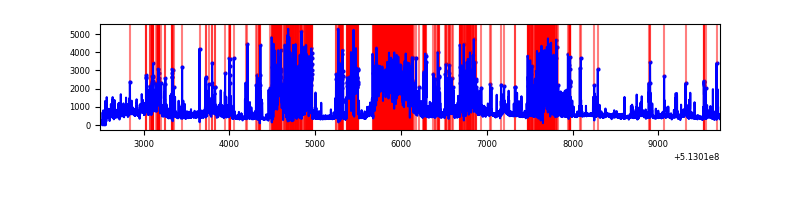 |
| D | 7179 | 7172 | 635 | 635 | 8.85% | 8.85% | 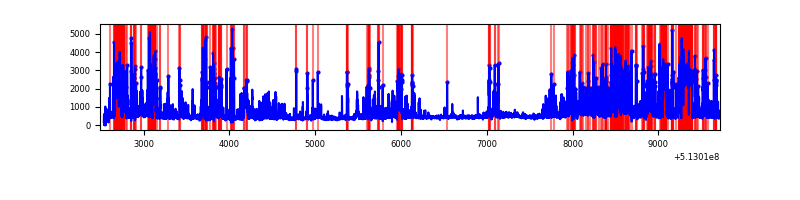 |
Top three noisy pixels from each quadrant. If the there are fewer than three noisy pixels in the level2.evt file, extra rows are filled as -1
| Pixel properties | Quadrant properties | ||||||
|---|---|---|---|---|---|---|---|
| Quadrant | DetID | PixID | Counts | Sigma | Mean | Median | Sigma |
| A | 3 | 62 | 741633 | 4182.99 | 714 | 698 | 177.1 |
| A | 4 | 249 | 332538 | 1873.42 | 714 | 698 | 177.1 |
| A | 10 | 251 | 32480 | 179.43 | 714 | 698 | 177.1 |
| B | 5 | 172 | 1344341 | 9122.57 | 687 | 663 | 147.3 |
| B | 8 | 128 | 125159 | 845.23 | 687 | 663 | 147.3 |
| B | 5 | 185 | 104908 | 707.75 | 687 | 663 | 147.3 |
| C | 12 | 254 | 2768899 | 15148.07 | 657 | 649 | 182.7 |
| C | 13 | 3 | 975944 | 5336.89 | 657 | 649 | 182.7 |
| C | 1 | 16 | 277269 | 1513.69 | 657 | 649 | 182.7 |
| D | 8 | 240 | 797277 | 4175.97 | 669 | 638 | 190.8 |
| D | 2 | 249 | 725154 | 3797.9 | 669 | 638 | 190.8 |
| D | 3 | 12 | 633276 | 3316.28 | 669 | 638 | 190.8 |
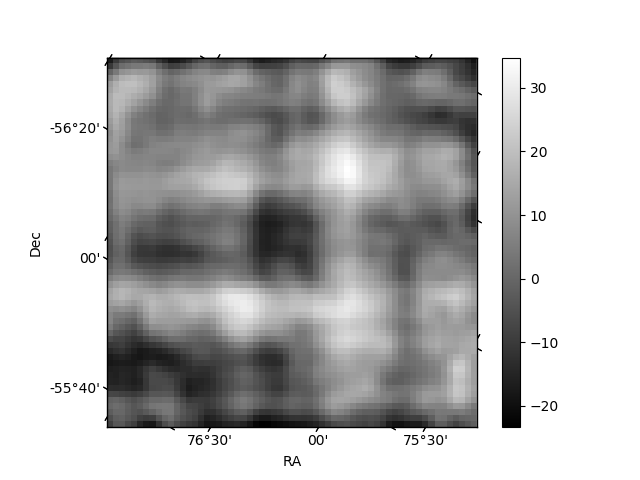
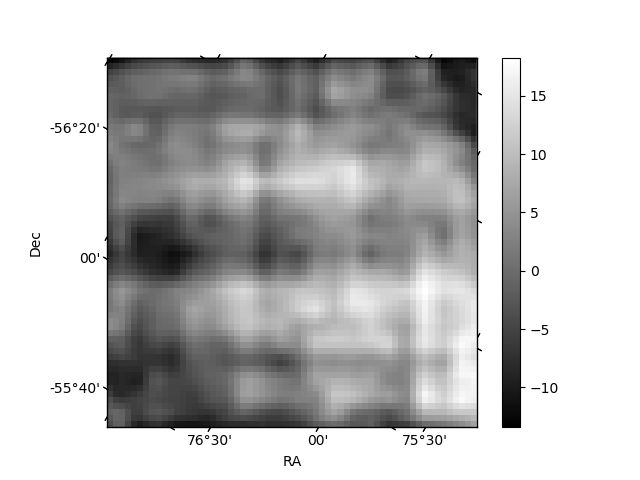
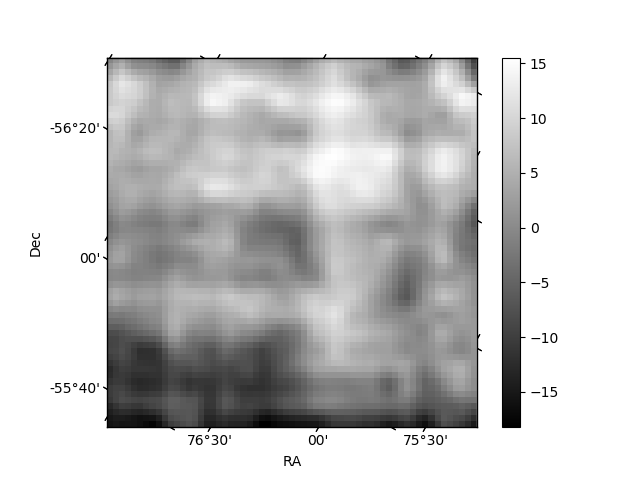
Histogram calculated using DETX and DETY for each event in the final _common_clean file
| Quadrant A | 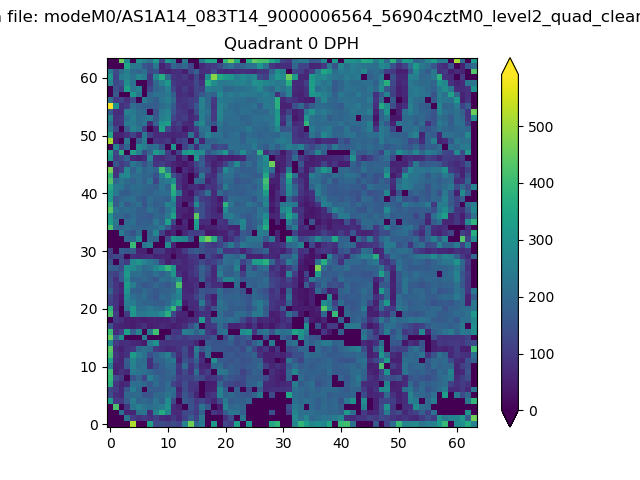 |
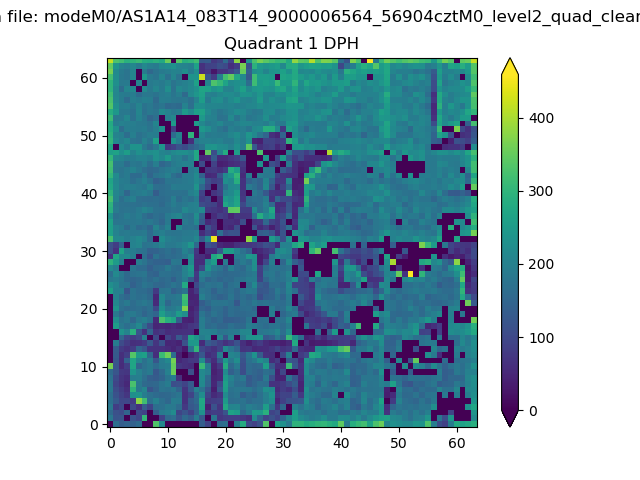 |
Quadrant B |
|---|---|---|---|
| Quadrant D | 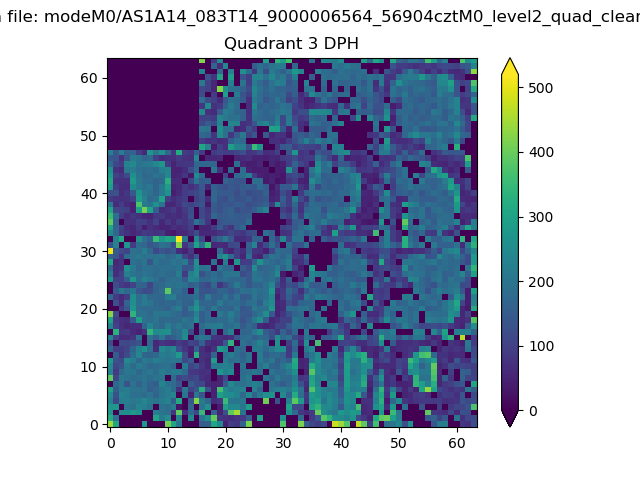 |
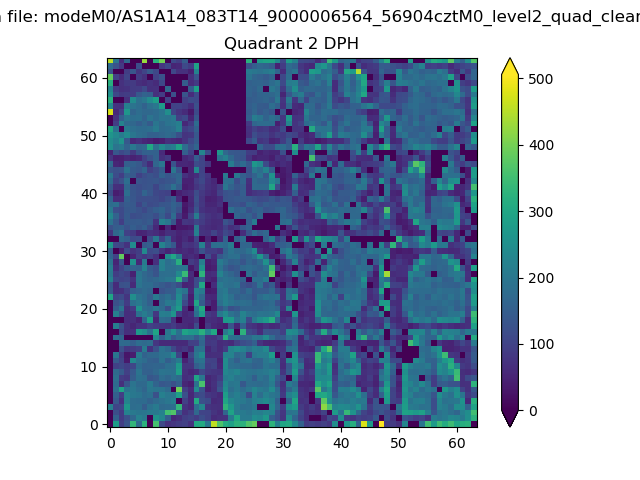 |
Quadrant C |
| Plot type | Count rate plots | Images |
|---|---|---|
| Comparison with Poisson distribution Blue bars denote a histogram of data divided into 1 sec bins. Red curve is a Poisson curve with rate = median count rate of data. |
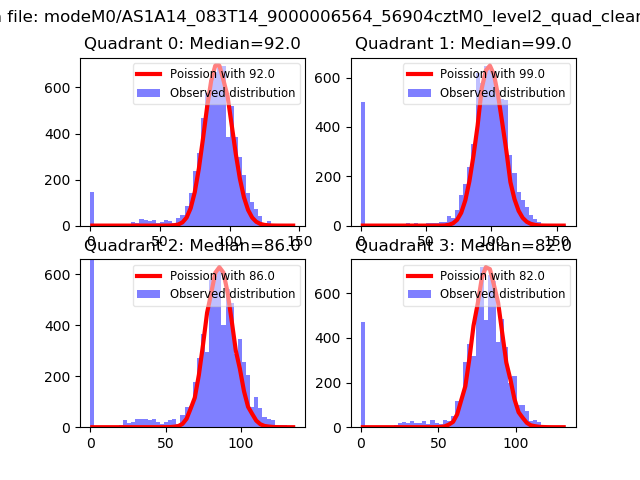 |
 |
| Quadrant-wise count rates Data is divided into 100 sec bins |
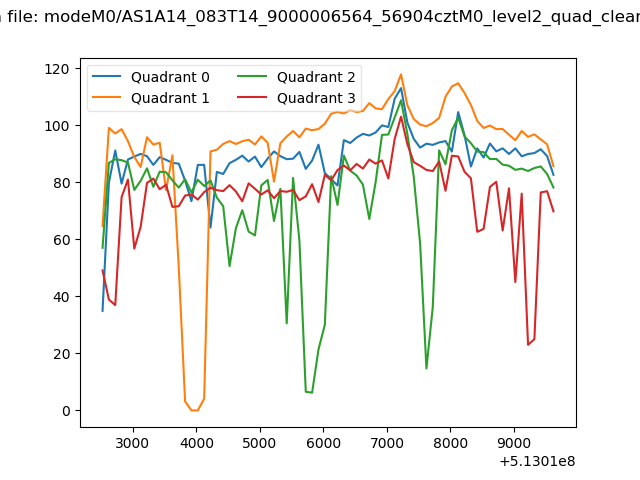 |
|
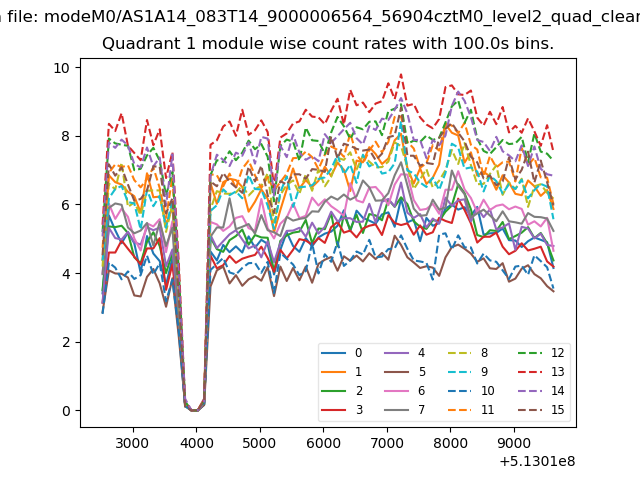
| Module-wise count rates for Quadrant A Data is divided into 100 sec bins |
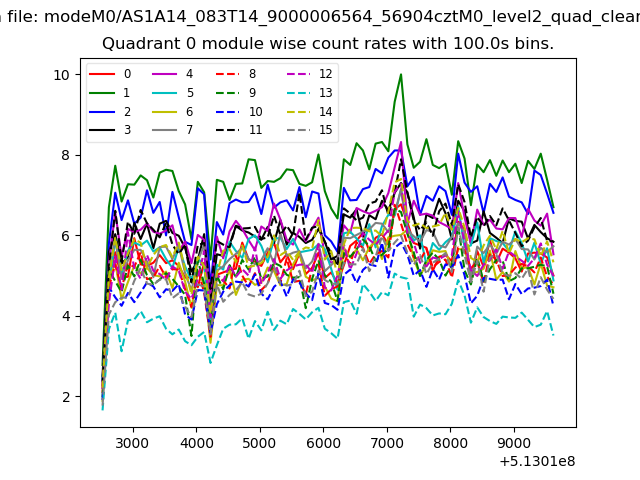 |
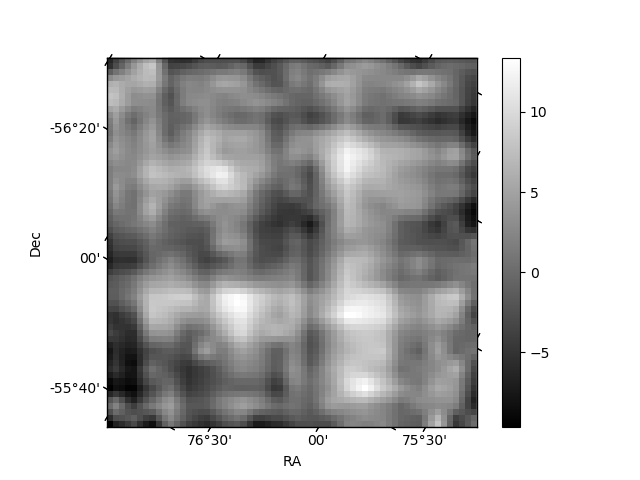 |
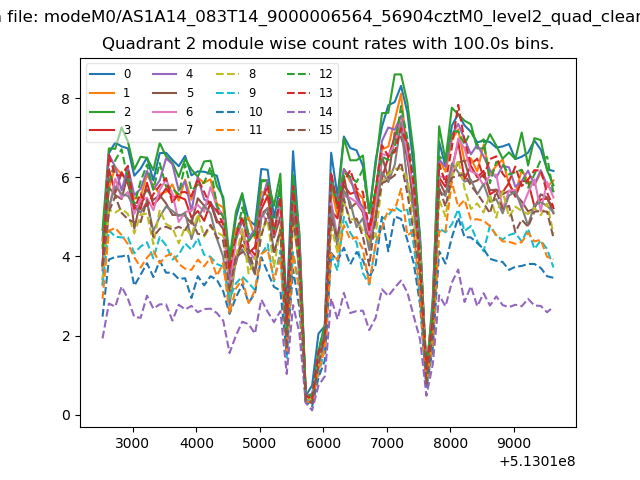
| Module-wise count rates for Quadrant B Data is divided into 100 sec bins |
 |
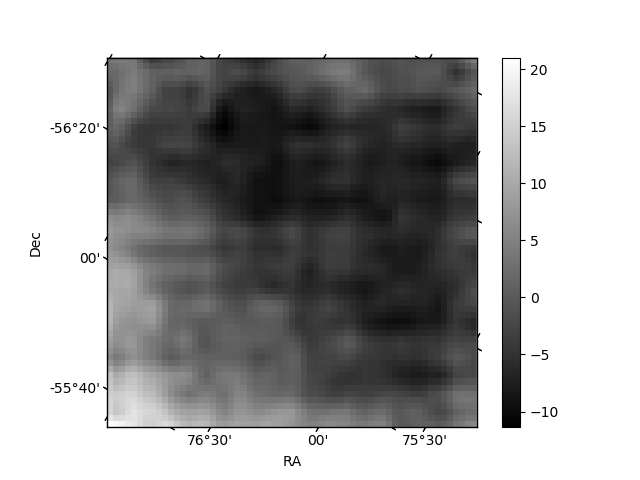 |
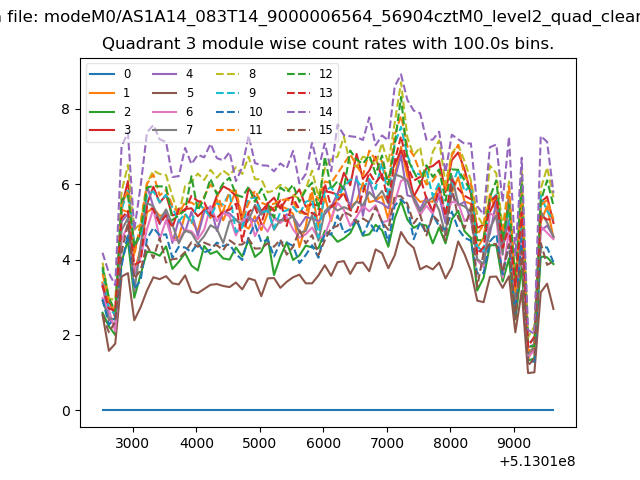
| Module-wise count rates for Quadrant C Data is divided into 100 sec bins |
 |
 |
| Module-wise count rates for Quadrant D Data is divided into 100 sec bins |
 |
 |
| Parameter | Plot |
|---|---|
| CZT HV Monitor | 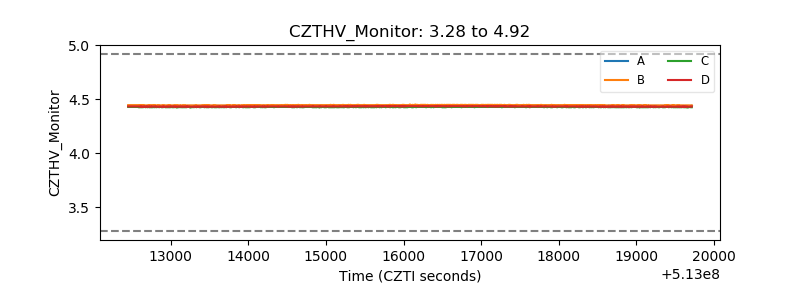 |
| D_VDD | 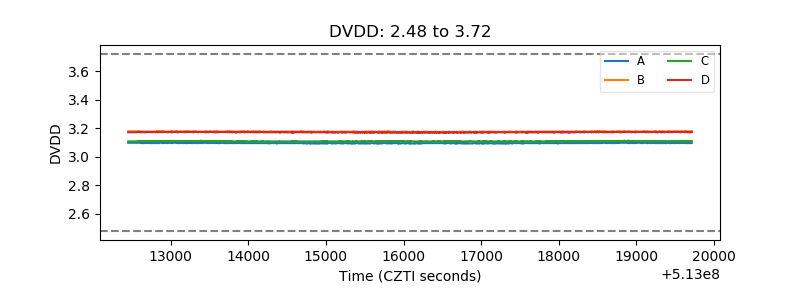 |
| Temperature 1 | 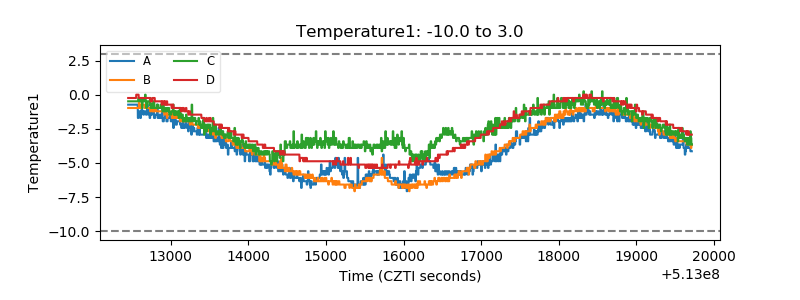 |
| Veto HV Monitor | 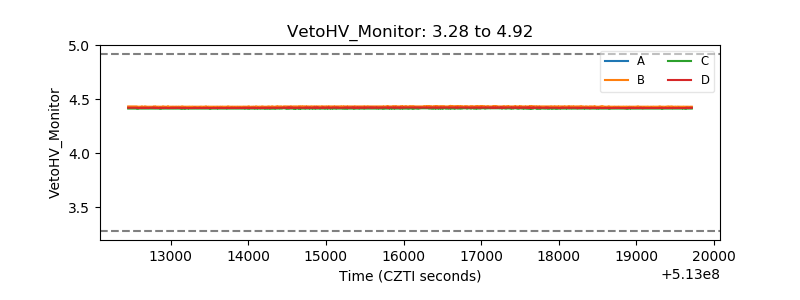 |
| Veto LLD | 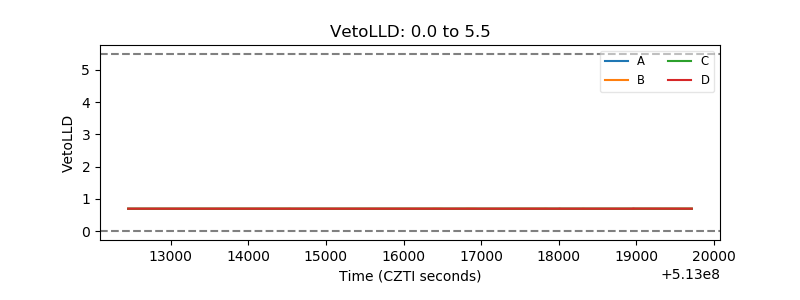 |
| Alpha Counter | 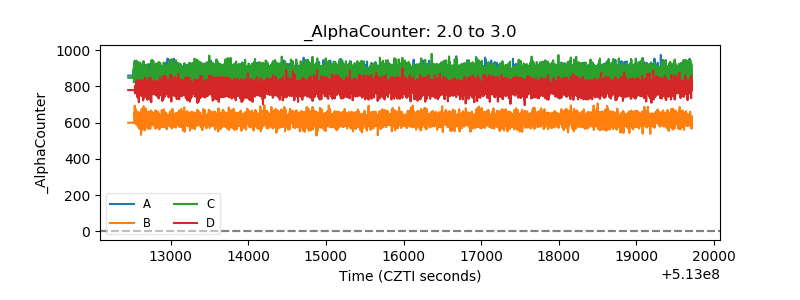 |
| _CPM_Rate | 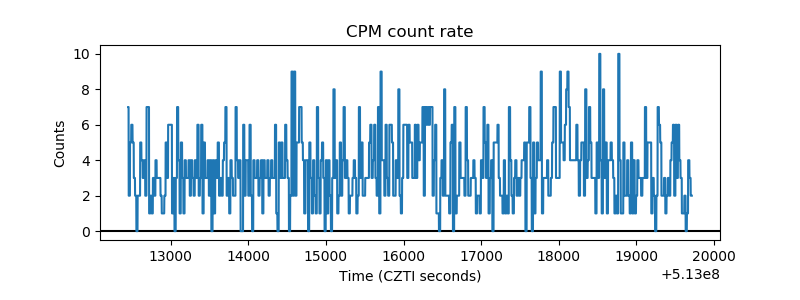 |
| CZT Counter | 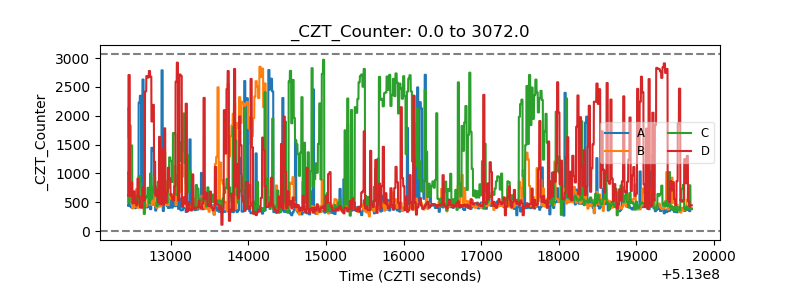 |
| +2.5 Volts monitor |  |
| +5 Volts monitor |  |
| _ROLL_ROT | 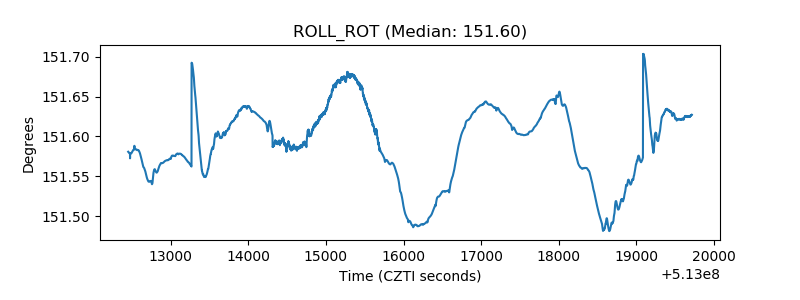 |
| _Roll_DEC | 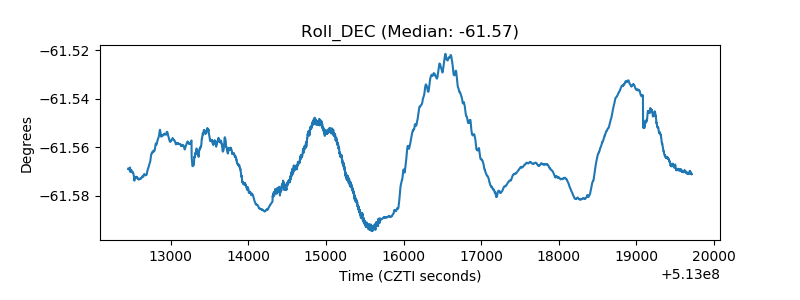 |
| _Roll_RA | 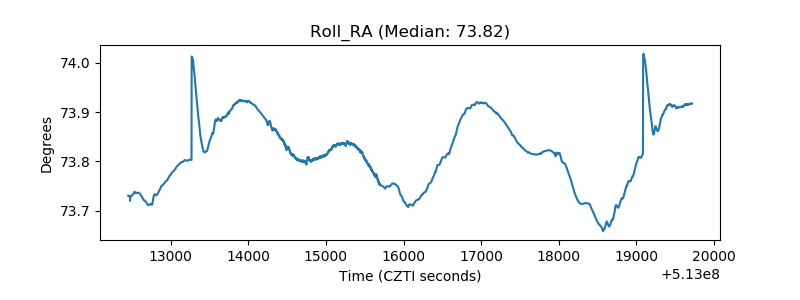 |
| Veto Counter | 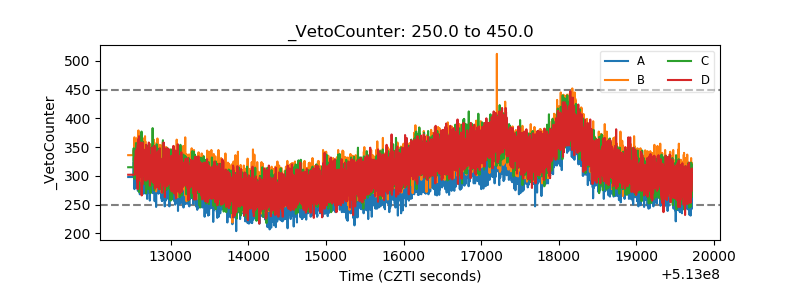 |