| Param | Original file | Final file |
|---|---|---|
| Filename | modeM0/AS1A14_083T14_9000006564_56908cztM0_level2.fits | modeM0/AS1A14_083T14_9000006564_56908cztM0_level2_quad_clean.evt |
| Size (bytes) | 1,587,530,880 | 237,787,200 |
| Size | 1.5 GB | 226.8 MB |
| Events in quadrant A | 9,142,403 | 1,687,163 |
| Events in quadrant B | 21,905,639 | 1,227,633 |
| Events in quadrant C | 11,243,240 | 1,576,863 |
| Events in quadrant D | 15,025,879 | 1,416,674 |
| Mode SS | |||
|---|---|---|---|
| Quadrant | BADHDUFLAG | Total packets | Discarded packets |
| A | 0 | 380 | 0 |
| B | 0 | 380 | 0 |
| C | 0 | 380 | 0 |
| D | 0 | 380 | 0 |
| Mode M9 | |||
|---|---|---|---|
| Quadrant | BADHDUFLAG | Total packets | Discarded packets |
| A | 0 | 15 | 0 |
| B | 0 | 15 | 0 |
| C | 0 | 15 | 0 |
| D | 0 | 15 | 0 |
| Mode M0 | |||
|---|---|---|---|
| Quadrant | BADHDUFLAG | Total packets | Discarded packets |
| A | 0 | 41263 | 3 |
| B | 0 | 78230 | 3 |
| C | 0 | 46225 | 3 |
| D | 0 | 58015 | 3 |
| Quadrant | Total seconds | Saturated seconds | Saturation percentage |
|---|---|---|---|
| A | 18725 | 239 | 1.276368% |
| B | 18726 | 5226 | 27.907722% |
| C | 18726 | 549 | 2.931753% |
| D | 18725 | 1409 | 7.524700% |
Noise dominated data is calculated using 1-second bins in cleaned event files. If a bin has >2000 counts, and if more than 50% of those come from <1% of pixels, then it is considered to be noise-dominated and hence unusable.
| Quadrant | # 1 sec bins | Bins with >0 counts | Bins with >2000 counts | High rate bins dominated by noise | Noise dominated (total time) | Noise dominated (detector-on time) | Marked lightcurve |
|---|---|---|---|---|---|---|---|
| A | 20226 | 18729 | 151 | 151 | 0.75% | 0.81% | 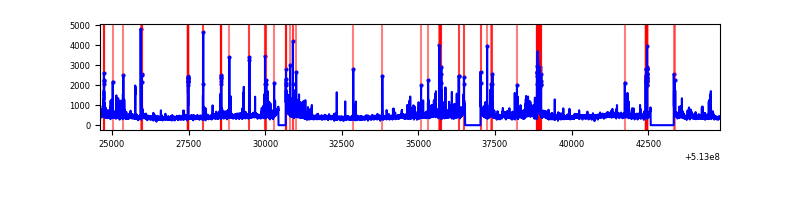 |
| B | 20227 | 18729 | 4389 | 4389 | 21.70% | 23.43% | 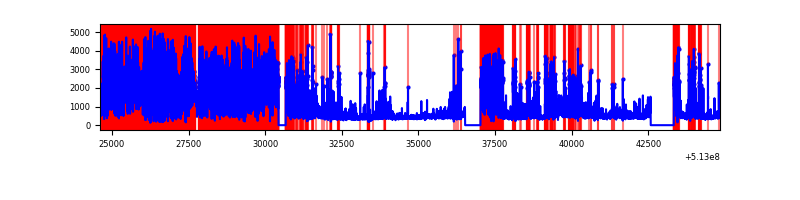 |
| C | 20227 | 18730 | 469 | 469 | 2.32% | 2.50% | 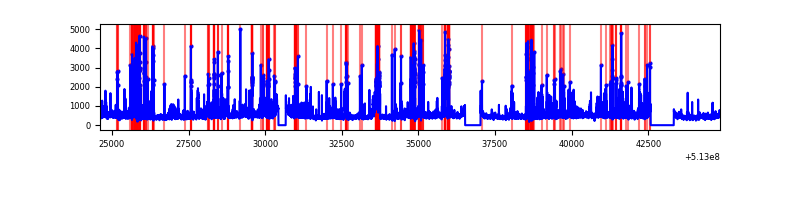 |
| D | 20226 | 18728 | 1280 | 1280 | 6.33% | 6.83% | 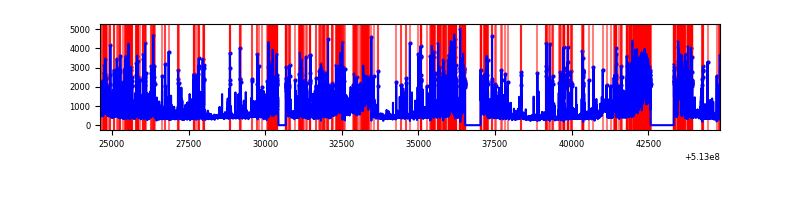 |
Top three noisy pixels from each quadrant. If the there are fewer than three noisy pixels in the level2.evt file, extra rows are filled as -1
| Pixel properties | Quadrant properties | ||||||
|---|---|---|---|---|---|---|---|
| Quadrant | DetID | PixID | Counts | Sigma | Mean | Median | Sigma |
| A | 3 | 14 | 599119 | 1251.32 | 1918 | 1868 | 477.3 |
| A | 4 | 249 | 205822 | 427.31 | 1918 | 1868 | 477.3 |
| A | 13 | 153 | 180808 | 374.9 | 1918 | 1868 | 477.3 |
| B | 5 | 185 | 11011411 | 31974.97 | 1617 | 1559 | 344.3 |
| B | 5 | 172 | 2307274 | 6696.29 | 1617 | 1559 | 344.3 |
| B | 10 | 16 | 1316168 | 3817.91 | 1617 | 1559 | 344.3 |
| C | 13 | 3 | 1783607 | 3545.45 | 1842 | 1826 | 502.6 |
| C | 1 | 16 | 1026569 | 2039.07 | 1842 | 1826 | 502.6 |
| C | 12 | 249 | 524438 | 1039.91 | 1842 | 1826 | 502.6 |
| D | 2 | 249 | 2211173 | 4373.46 | 1788 | 1705 | 505.2 |
| D | 8 | 240 | 1299652 | 2569.18 | 1788 | 1705 | 505.2 |
| D | 15 | 142 | 1091887 | 2157.92 | 1788 | 1705 | 505.2 |
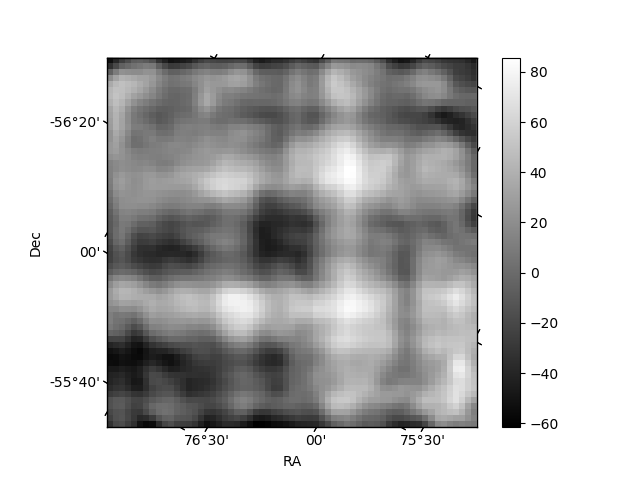
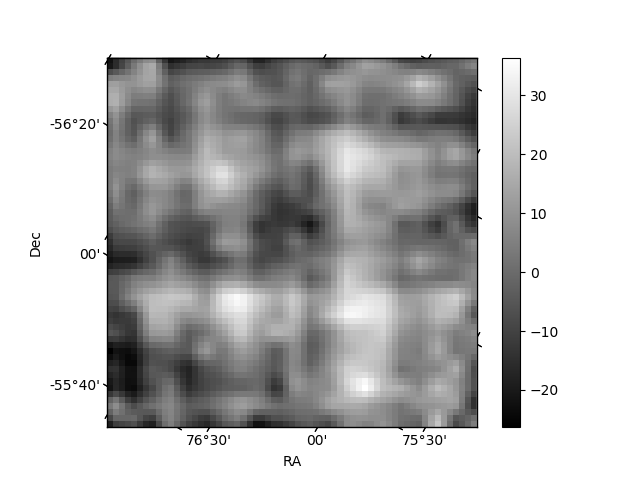
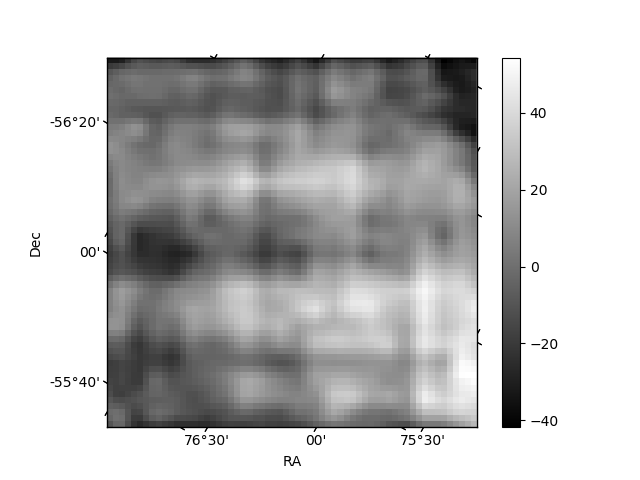
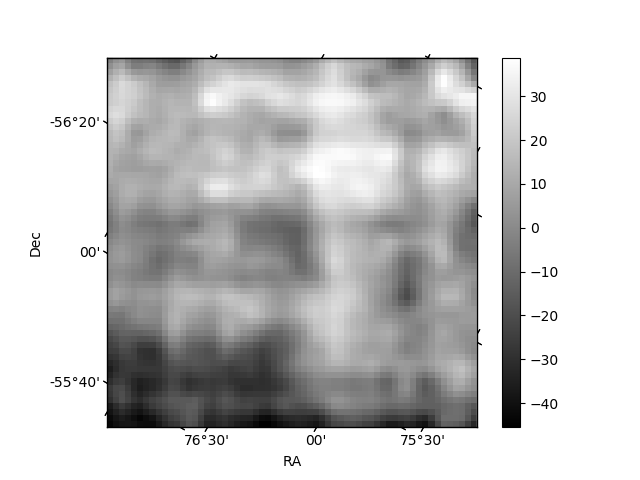
Histogram calculated using DETX and DETY for each event in the final _common_clean file
| Quadrant A | 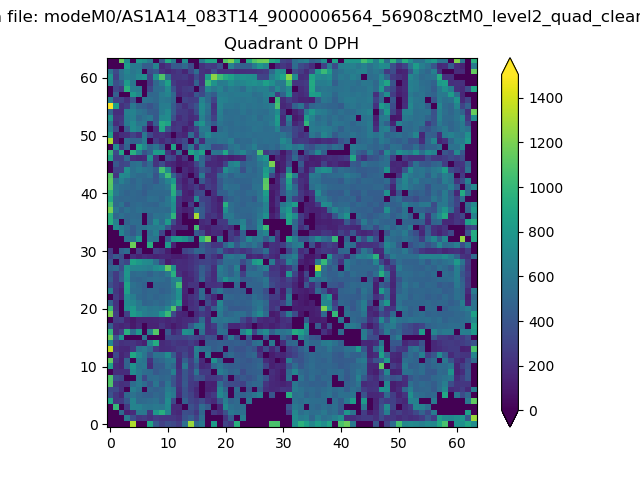 |
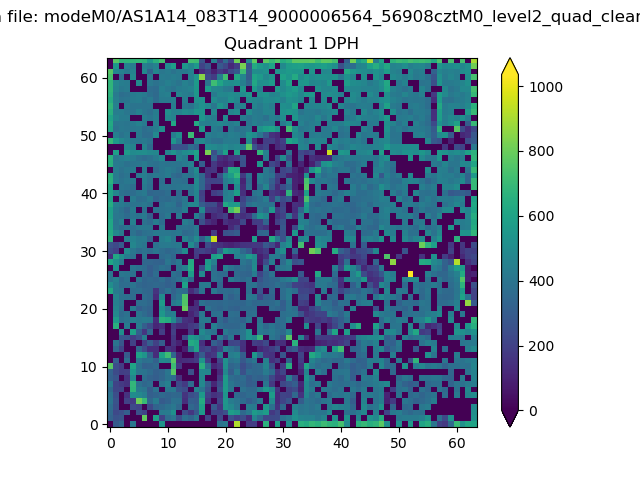 |
Quadrant B |
|---|---|---|---|
| Quadrant D | 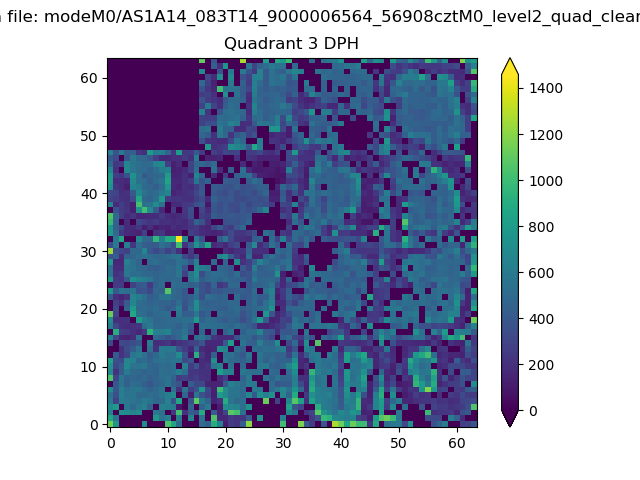 |
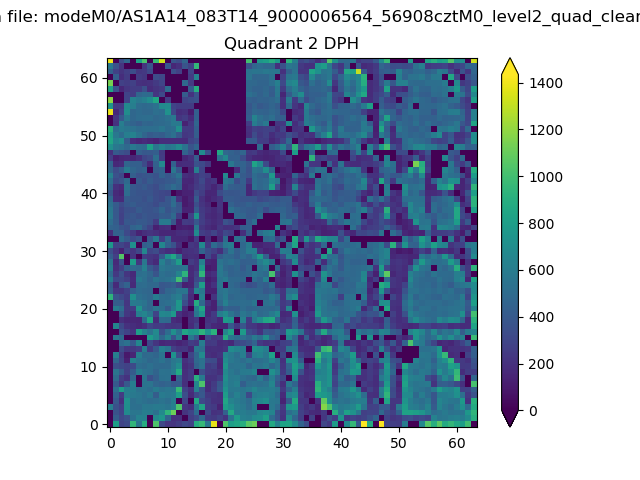 |
Quadrant C |
| Plot type | Count rate plots | Images |
|---|---|---|
| Comparison with Poisson distribution Blue bars denote a histogram of data divided into 1 sec bins. Red curve is a Poisson curve with rate = median count rate of data. |
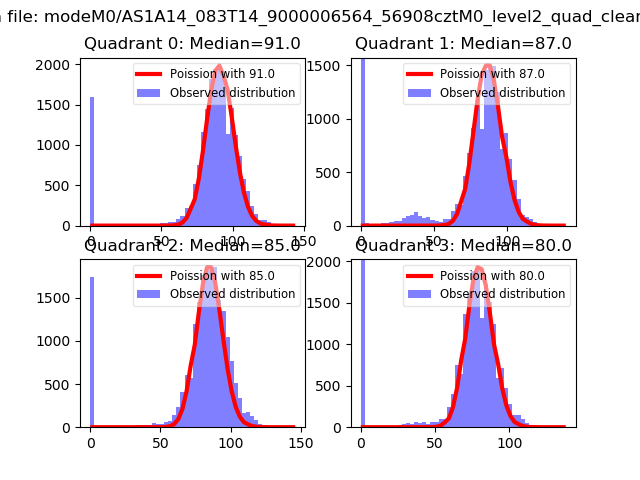 |
 |
| Quadrant-wise count rates Data is divided into 100 sec bins |
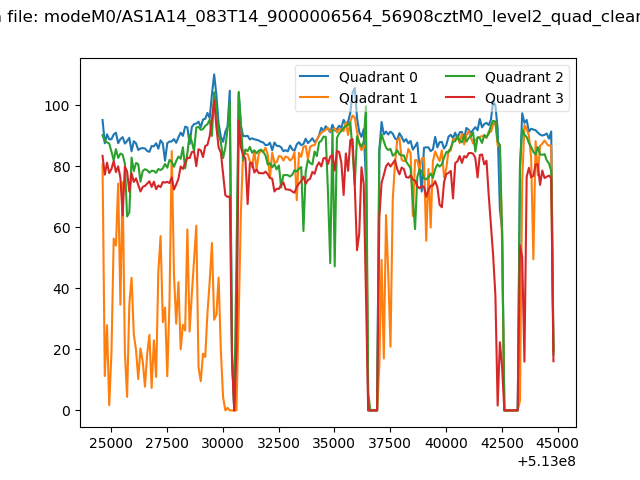 |
|
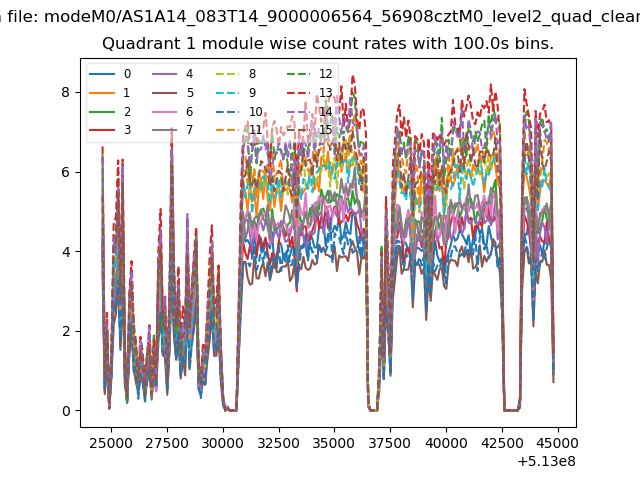
| Module-wise count rates for Quadrant A Data is divided into 100 sec bins |
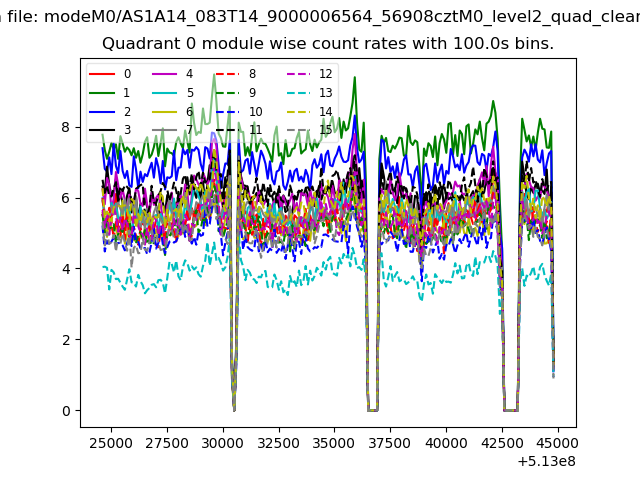 |
 |
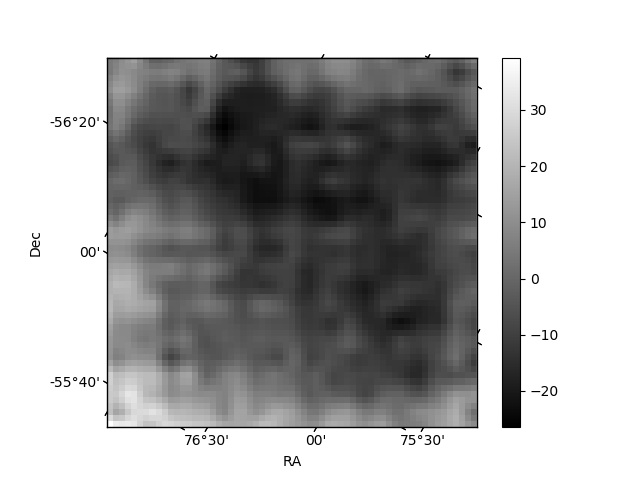
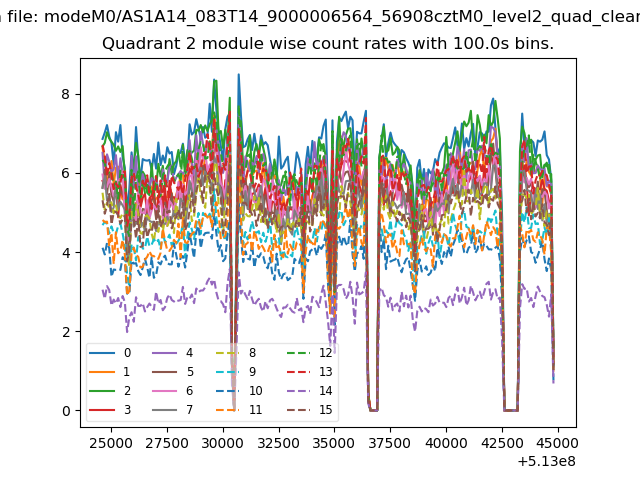
| Module-wise count rates for Quadrant B Data is divided into 100 sec bins |
 |
 |
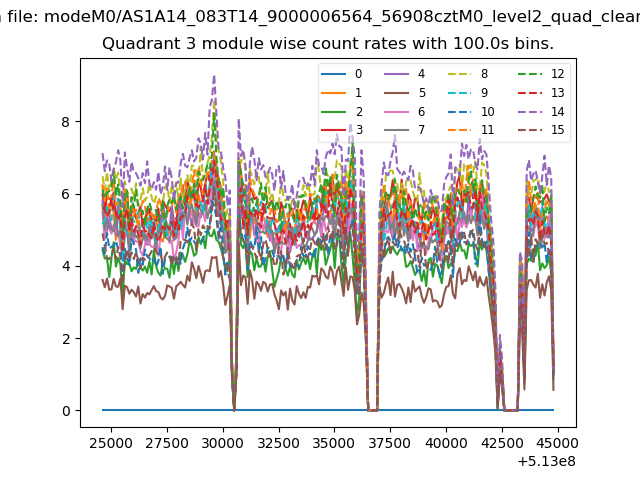
| Module-wise count rates for Quadrant C Data is divided into 100 sec bins |
 |
 |
| Module-wise count rates for Quadrant D Data is divided into 100 sec bins |
 |
 |
| Parameter | Plot |
|---|---|
| CZT HV Monitor | 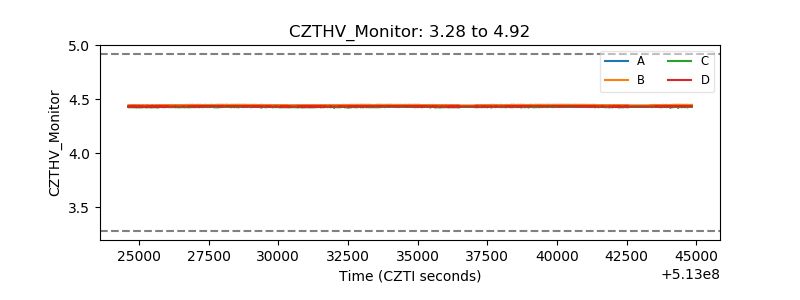 |
| D_VDD | 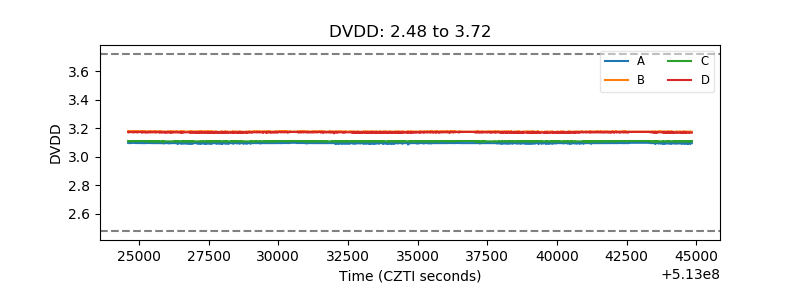 |
| Temperature 1 | 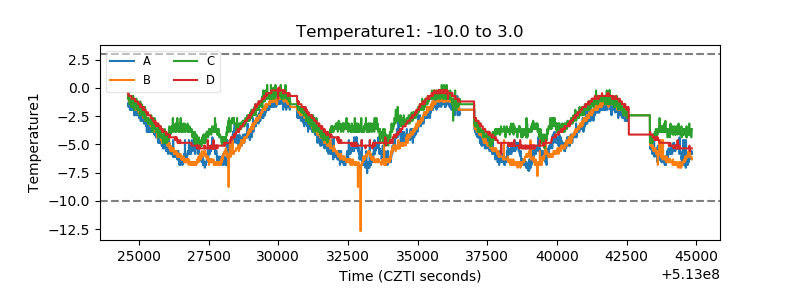 |
| Veto HV Monitor | 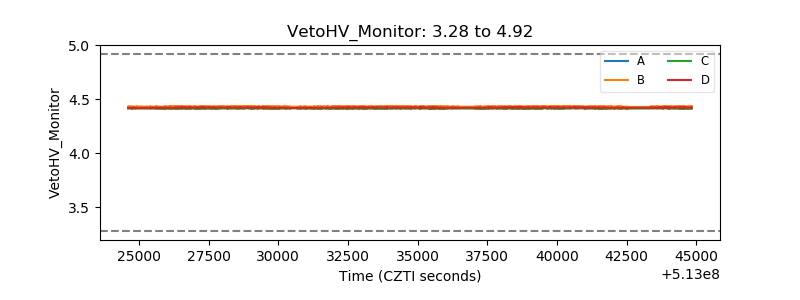 |
| Veto LLD | 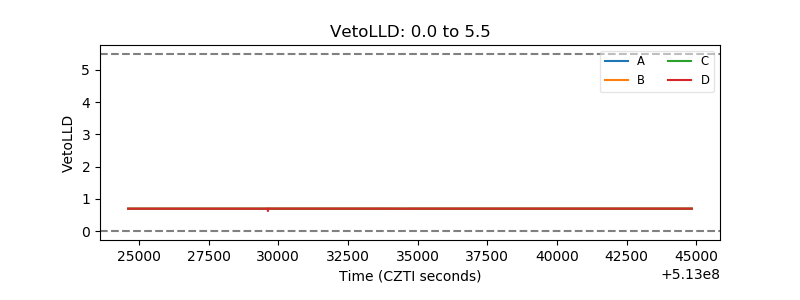 |
| Alpha Counter | 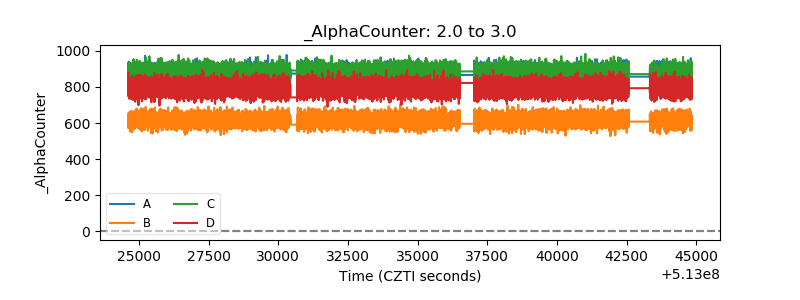 |
| _CPM_Rate | 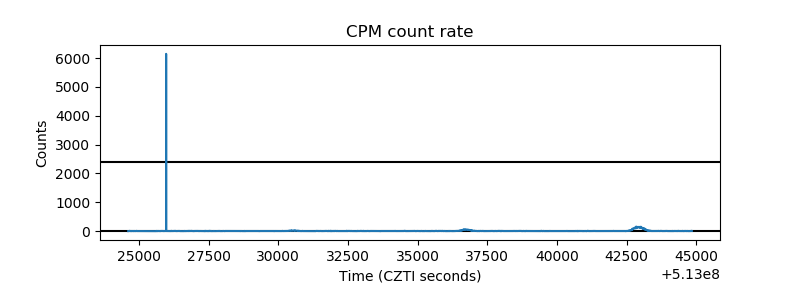 |
| CZT Counter | 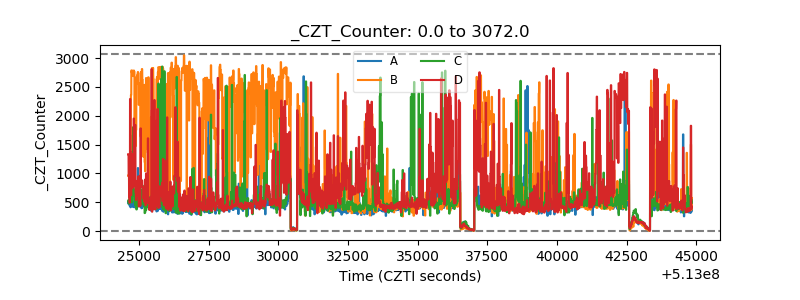 |
| +2.5 Volts monitor |  |
| +5 Volts monitor | 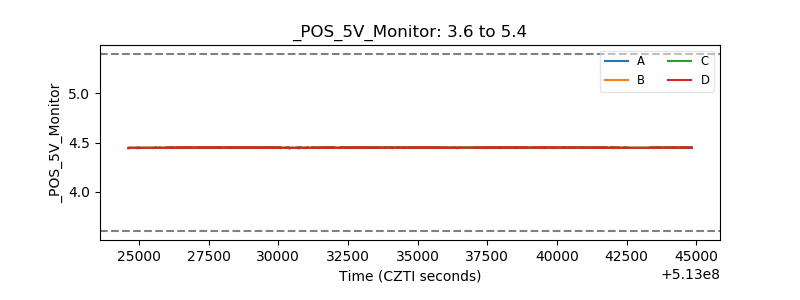 |
| _ROLL_ROT | 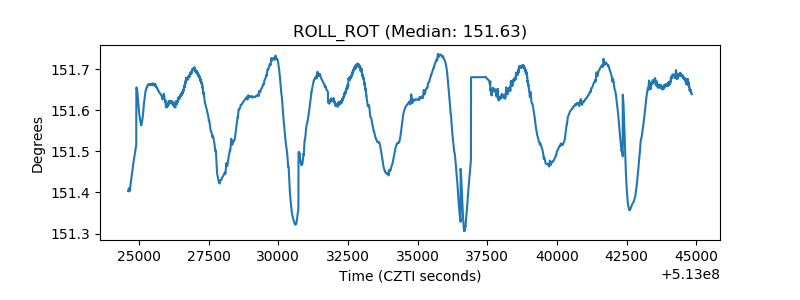 |
| _Roll_DEC | 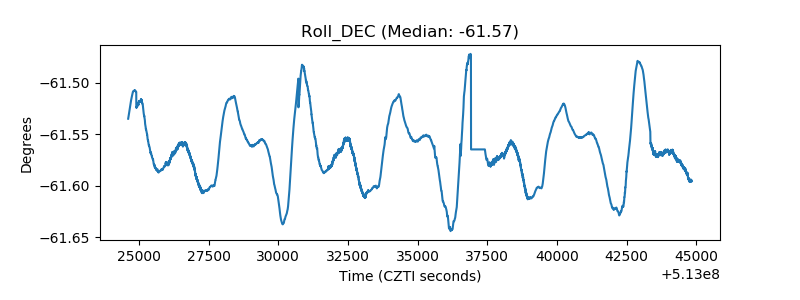 |
| _Roll_RA | 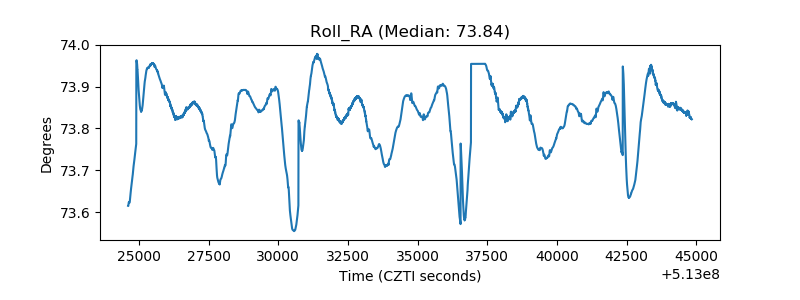 |
| Veto Counter | 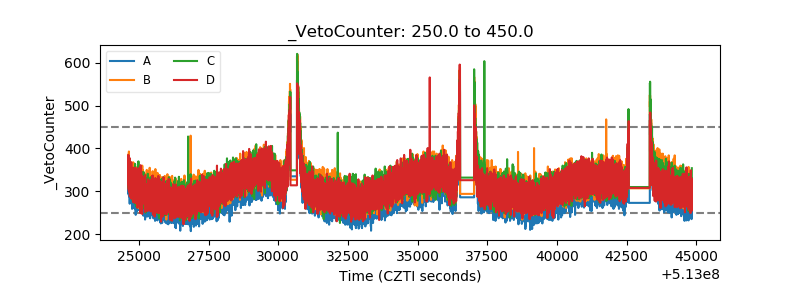 |