| Param | Original file | Final file |
|---|---|---|
| Filename | modeM0/AS1A14_083T14_9000006564_56909cztM0_level2.fits | modeM0/AS1A14_083T14_9000006564_56909cztM0_level2_quad_clean.evt |
| Size (bytes) | 493,974,720 | 99,823,680 |
| Size | 471.1 MB | 95.2 MB |
| Events in quadrant A | 3,591,056 | 666,482 |
| Events in quadrant B | 5,280,925 | 664,540 |
| Events in quadrant C | 3,673,907 | 626,602 |
| Events in quadrant D | 5,174,328 | 558,625 |
| Mode SS | |||
|---|---|---|---|
| Quadrant | BADHDUFLAG | Total packets | Discarded packets |
| A | 0 | 150 | 0 |
| B | 0 | 150 | 0 |
| C | 0 | 150 | 0 |
| D | 0 | 150 | 0 |
| Mode M9 | |||
|---|---|---|---|
| Quadrant | BADHDUFLAG | Total packets | Discarded packets |
| A | 0 | 16 | 0 |
| B | 0 | 16 | 0 |
| C | 0 | 16 | 0 |
| D | 0 | 16 | 0 |
| Mode M0 | |||
|---|---|---|---|
| Quadrant | BADHDUFLAG | Total packets | Discarded packets |
| A | 0 | 16171 | 2 |
| B | 0 | 20816 | 2 |
| C | 0 | 16278 | 2 |
| D | 0 | 20643 | 2 |
| Quadrant | Total seconds | Saturated seconds | Saturation percentage |
|---|---|---|---|
| A | 7267 | 136 | 1.871474% |
| B | 7267 | 652 | 8.972066% |
| C | 7268 | 140 | 1.926252% |
| D | 7268 | 558 | 7.677490% |
Noise dominated data is calculated using 1-second bins in cleaned event files. If a bin has >2000 counts, and if more than 50% of those come from <1% of pixels, then it is considered to be noise-dominated and hence unusable.
| Quadrant | # 1 sec bins | Bins with >0 counts | Bins with >2000 counts | High rate bins dominated by noise | Noise dominated (total time) | Noise dominated (detector-on time) | Marked lightcurve |
|---|---|---|---|---|---|---|---|
| A | 8892 | 7269 | 89 | 89 | 1.00% | 1.22% | 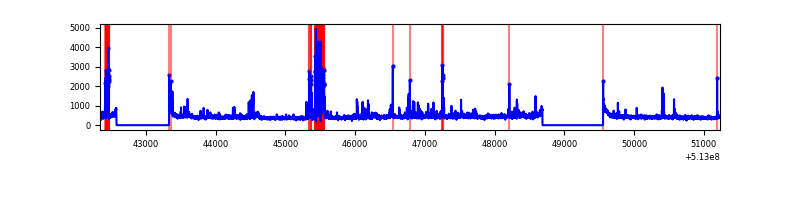 |
| B | 8892 | 7269 | 461 | 461 | 5.18% | 6.34% | 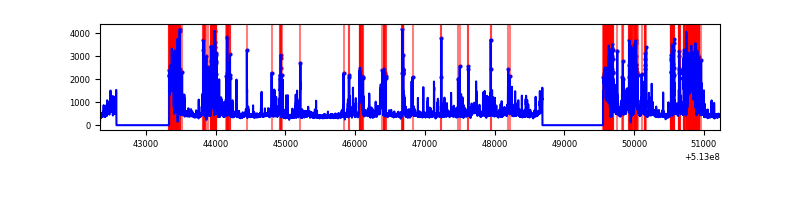 |
| C | 8893 | 7270 | 87 | 87 | 0.98% | 1.20% | 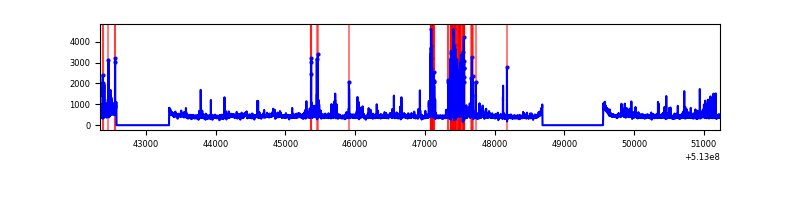 |
| D | 8893 | 7270 | 460 | 460 | 5.17% | 6.33% | 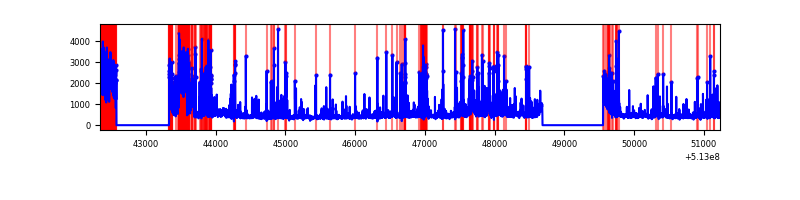 |
Top three noisy pixels from each quadrant. If the there are fewer than three noisy pixels in the level2.evt file, extra rows are filled as -1
| Pixel properties | Quadrant properties | ||||||
|---|---|---|---|---|---|---|---|
| Quadrant | DetID | PixID | Counts | Sigma | Mean | Median | Sigma |
| A | 13 | 248 | 269868 | 1451.09 | 748 | 729 | 185.5 |
| A | 13 | 153 | 97795 | 523.34 | 748 | 729 | 185.5 |
| A | 8 | 6 | 86935 | 464.79 | 748 | 729 | 185.5 |
| B | 10 | 16 | 1322671 | 8614.13 | 710 | 685 | 153.5 |
| B | 5 | 172 | 678037 | 4413.66 | 710 | 685 | 153.5 |
| B | 5 | 185 | 219280 | 1424.38 | 710 | 685 | 153.5 |
| C | 13 | 3 | 507199 | 2529.9 | 729 | 721 | 200.2 |
| C | 1 | 16 | 134946 | 670.47 | 729 | 721 | 200.2 |
| C | 14 | 254 | 75248 | 372.27 | 729 | 721 | 200.2 |
| D | 8 | 240 | 710611 | 3616.08 | 701 | 669 | 196.3 |
| D | 2 | 249 | 669758 | 3408.0 | 701 | 669 | 196.3 |
| D | 11 | 129 | 441523 | 2245.49 | 701 | 669 | 196.3 |
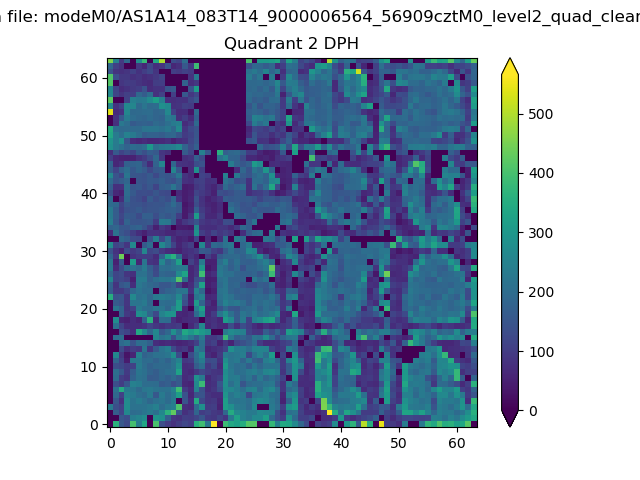
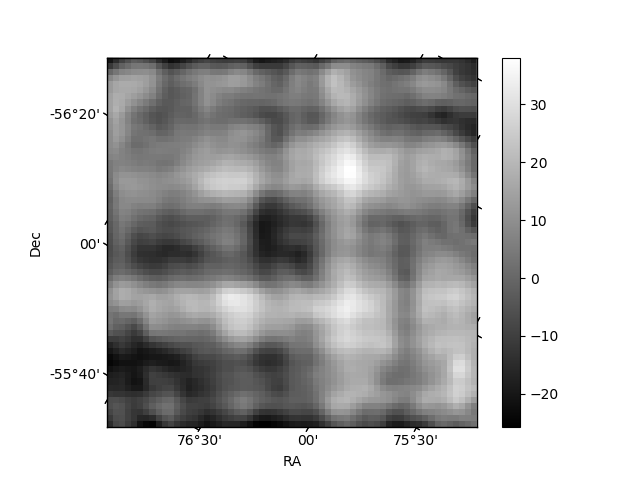
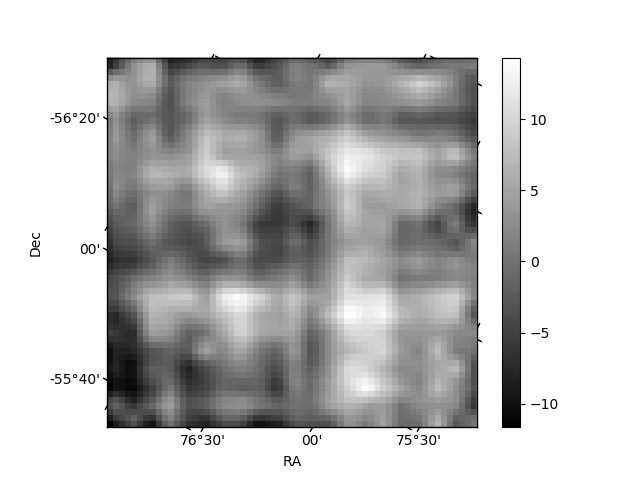
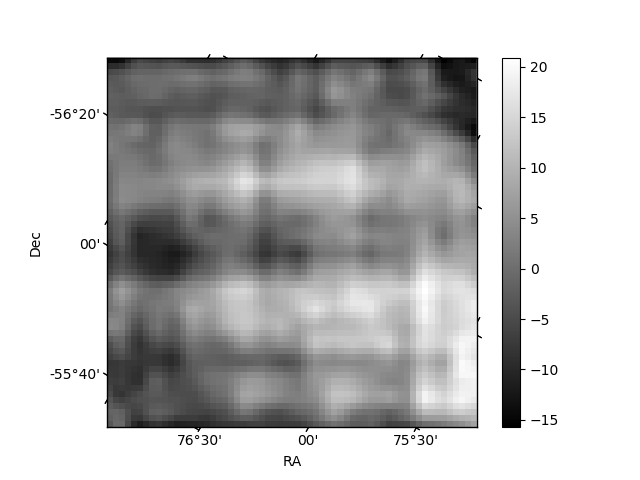
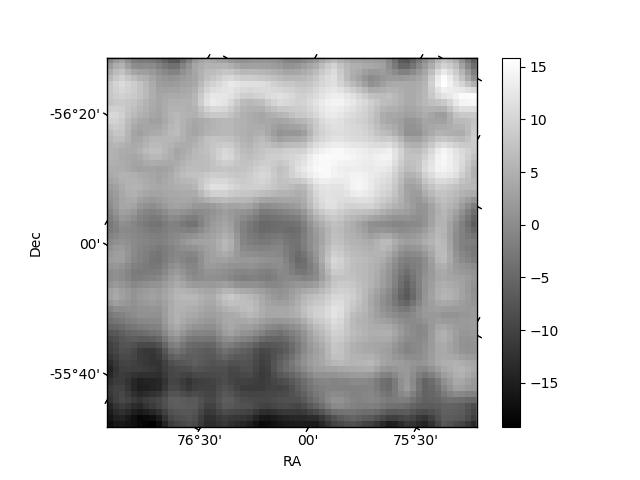
Histogram calculated using DETX and DETY for each event in the final _common_clean file
| Quadrant A | 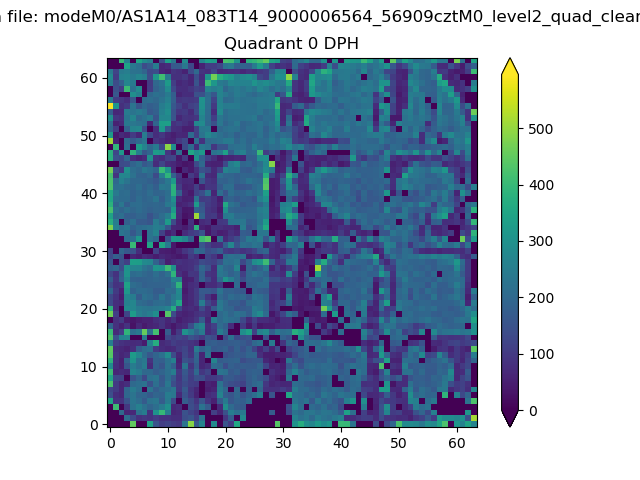 |
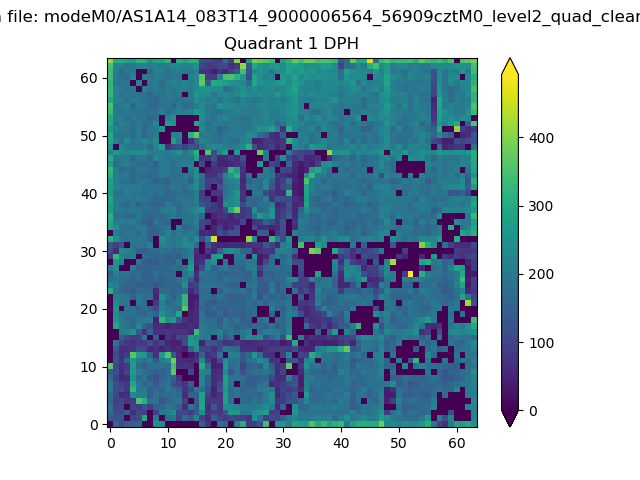 |
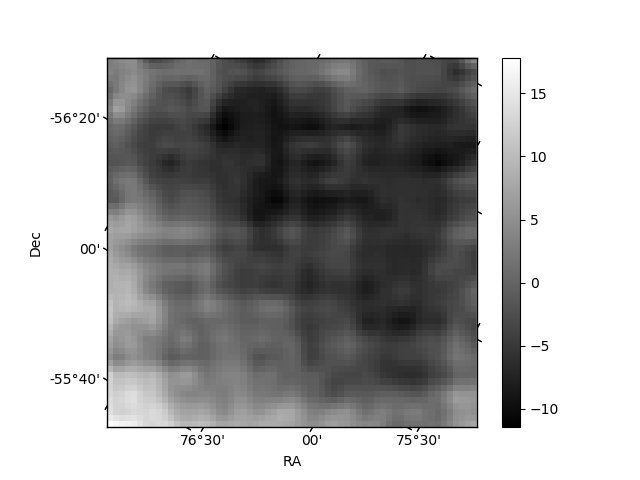
Quadrant B |
|---|---|---|---|
| Quadrant D | 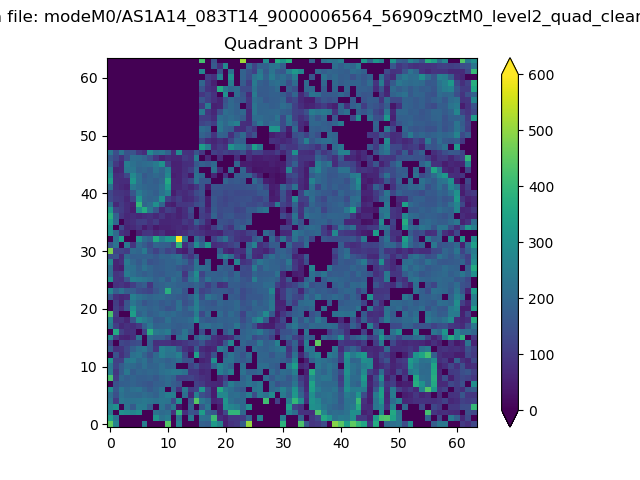 |
 |
Quadrant C |
| Plot type | Count rate plots | Images |
|---|---|---|
| Comparison with Poisson distribution Blue bars denote a histogram of data divided into 1 sec bins. Red curve is a Poisson curve with rate = median count rate of data. |
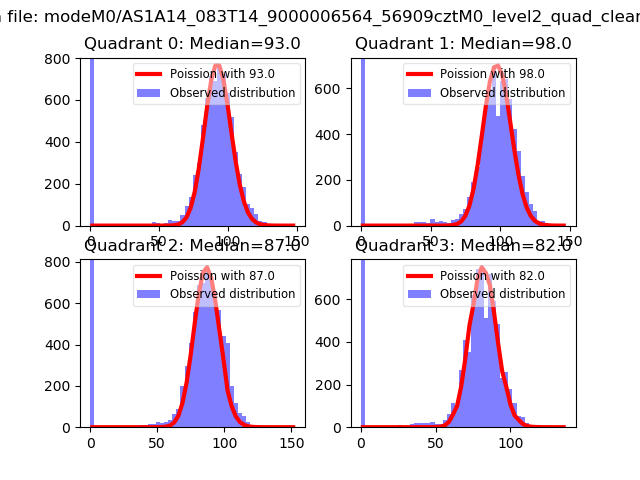 |
 |
| Quadrant-wise count rates Data is divided into 100 sec bins |
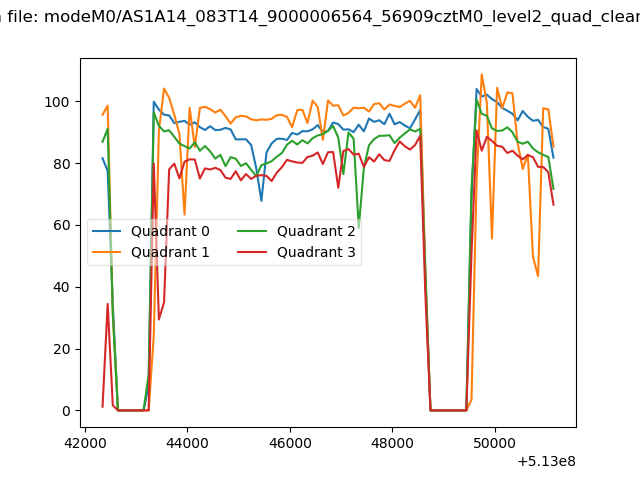 |
|
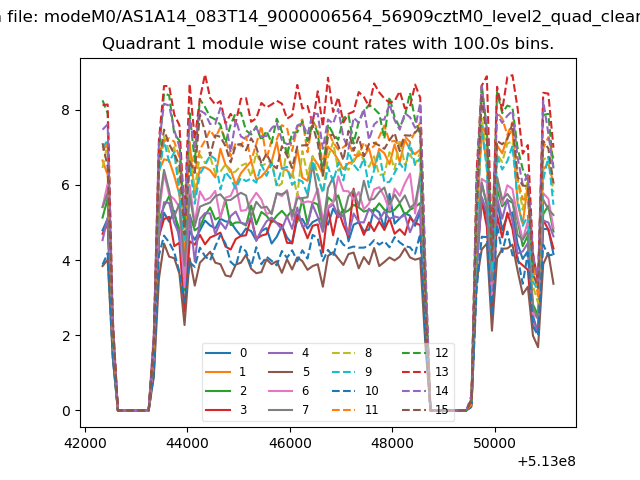
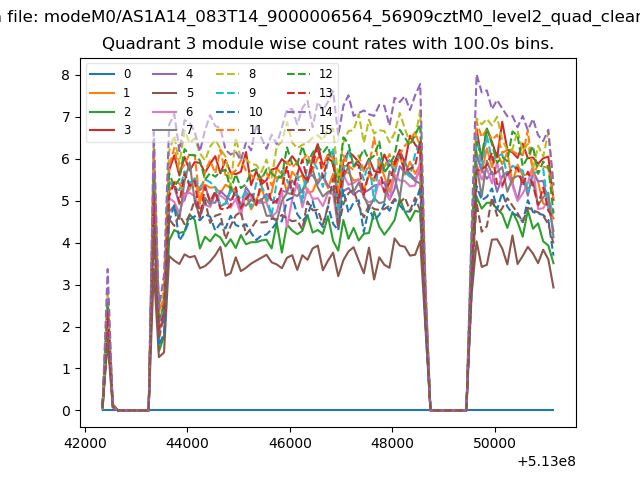
| Module-wise count rates for Quadrant A Data is divided into 100 sec bins |
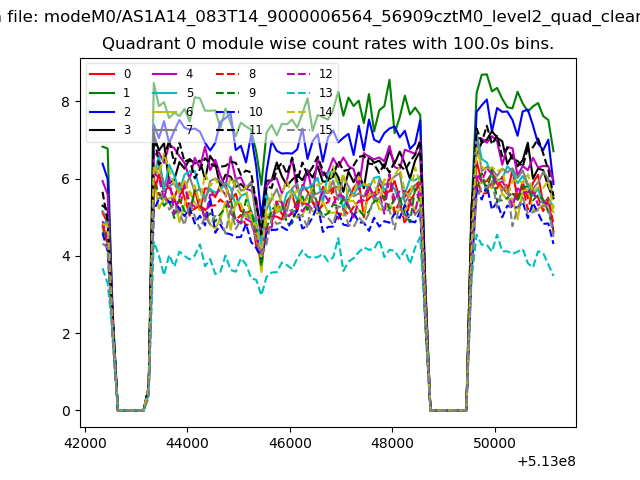 |
 |
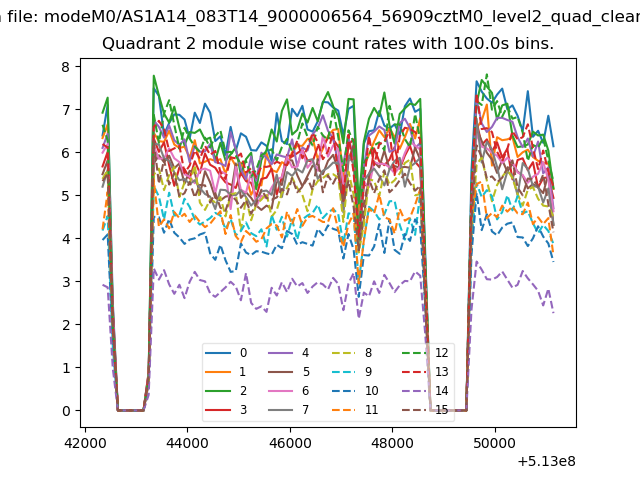
| Module-wise count rates for Quadrant B Data is divided into 100 sec bins |
 |
 |
| Module-wise count rates for Quadrant C Data is divided into 100 sec bins |
 |
 |
| Module-wise count rates for Quadrant D Data is divided into 100 sec bins |
 |
 |
| Parameter | Plot |
|---|---|
| CZT HV Monitor | 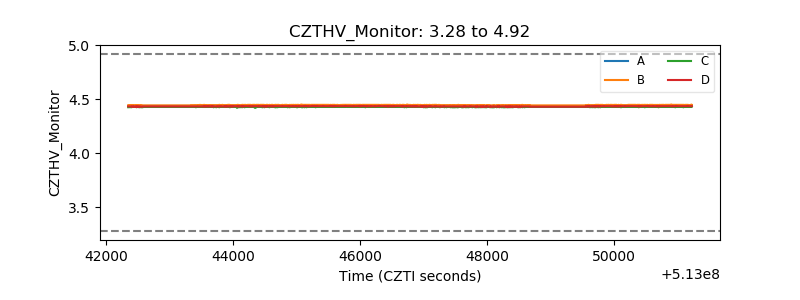 |
| D_VDD | 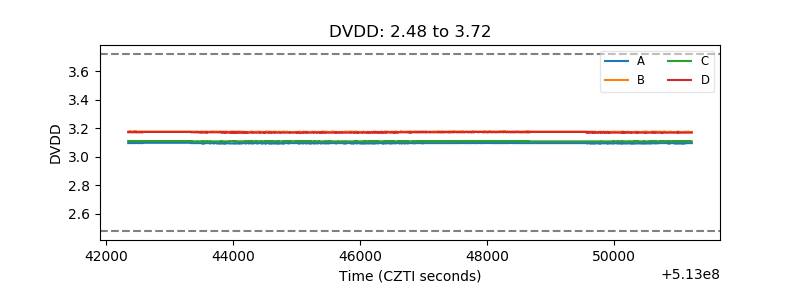 |
| Temperature 1 | 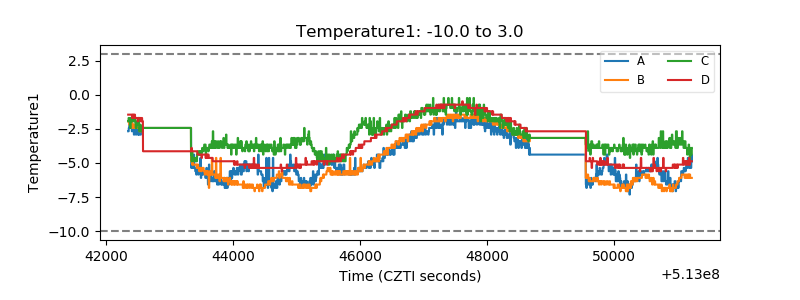 |
| Veto HV Monitor | 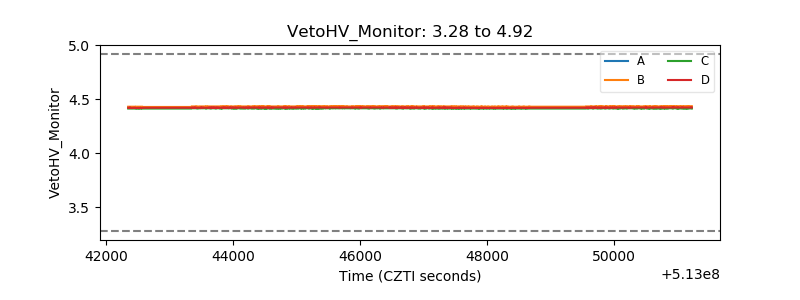 |
| Veto LLD | 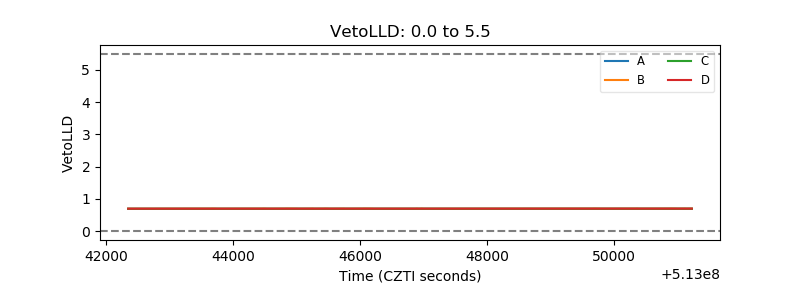 |
| Alpha Counter | 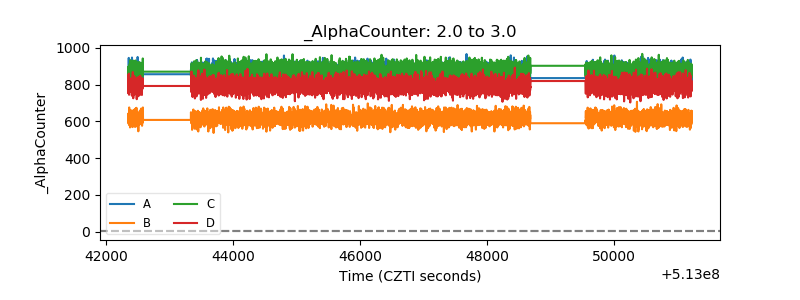 |
| _CPM_Rate | 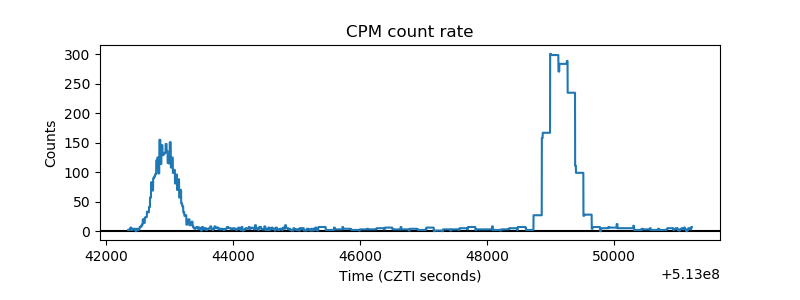 |
| CZT Counter | 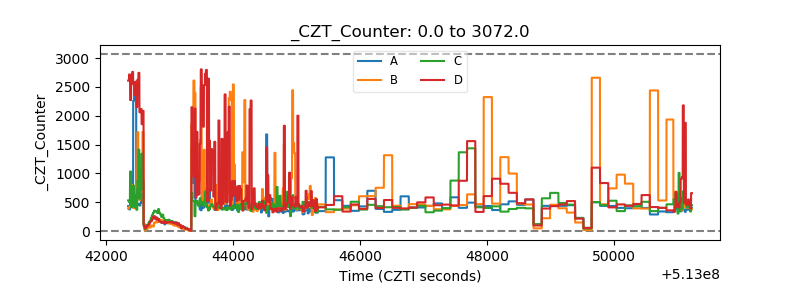 |
| +2.5 Volts monitor | 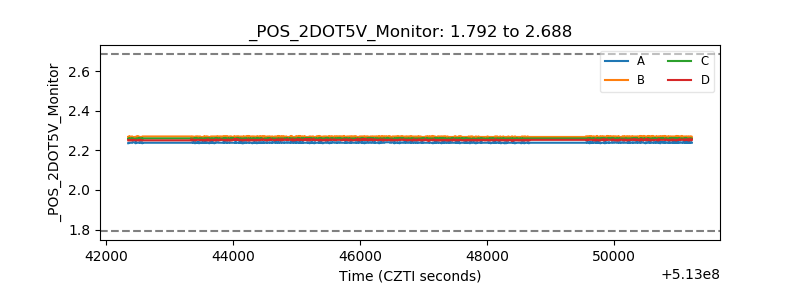 |
| +5 Volts monitor |  |
| _ROLL_ROT | 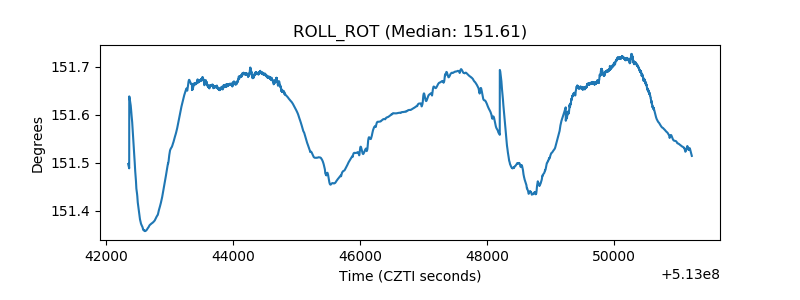 |
| _Roll_DEC | 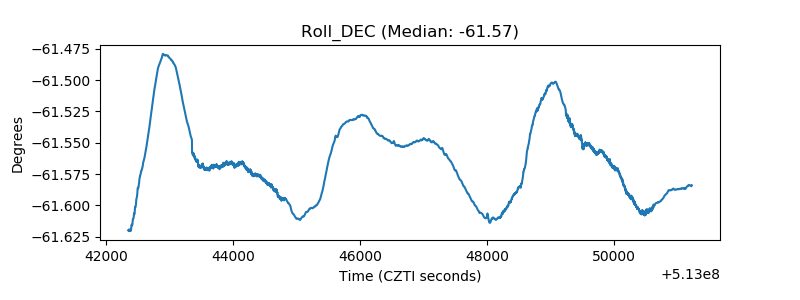 |
| _Roll_RA | 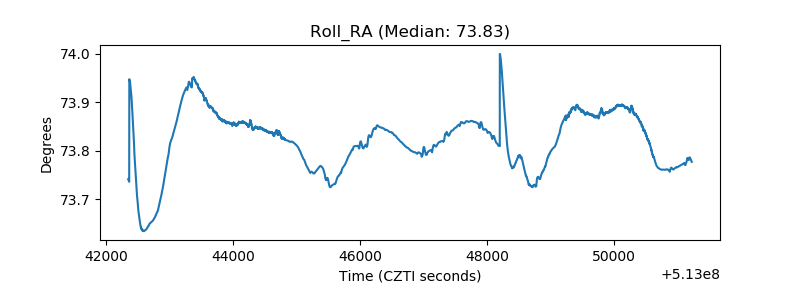 |
| Veto Counter | 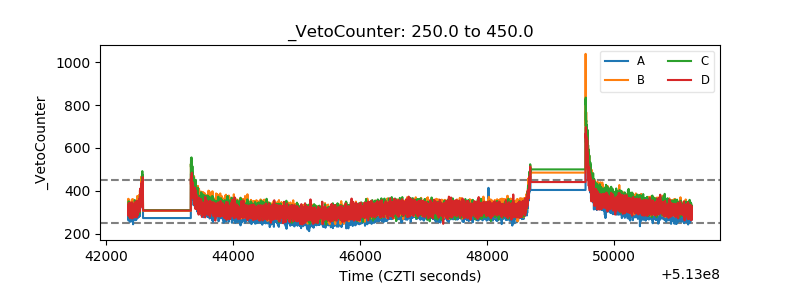 |