| Param | Original file | Final file |
|---|---|---|
| Filename | modeM0/AS1A14_083T14_9000006564_56912cztM0_level2.fits | modeM0/AS1A14_083T14_9000006564_56912cztM0_level2_quad_clean.evt |
| Size (bytes) | 610,804,800 | 84,231,360 |
| Size | 582.5 MB | 80.3 MB |
| Events in quadrant A | 10,187,200 | 382,246 |
| Events in quadrant B | 3,520,429 | 642,371 |
| Events in quadrant C | 3,947,371 | 568,388 |
| Events in quadrant D | 4,473,278 | 524,107 |
| Mode SS | |||
|---|---|---|---|
| Quadrant | BADHDUFLAG | Total packets | Discarded packets |
| A | 0 | 126 | 0 |
| B | 0 | 126 | 0 |
| C | 0 | 126 | 0 |
| D | 0 | 126 | 0 |
| Mode M9 | |||
|---|---|---|---|
| Quadrant | BADHDUFLAG | Total packets | Discarded packets |
| A | 0 | 11 | 0 |
| B | 0 | 11 | 0 |
| C | 0 | 11 | 0 |
| D | 0 | 11 | 0 |
| Mode M0 | |||
|---|---|---|---|
| Quadrant | BADHDUFLAG | Total packets | Discarded packets |
| A | 0 | 34529 | 3 |
| B | 0 | 14854 | 1 |
| C | 0 | 16006 | 1 |
| D | 0 | 17531 | 1 |
| Quadrant | Total seconds | Saturated seconds | Saturation percentage |
|---|---|---|---|
| A | 6208 | 2641 | 42.541881% |
| B | 6208 | 209 | 3.366624% |
| C | 6209 | 263 | 4.235787% |
| D | 6209 | 401 | 6.458367% |
Noise dominated data is calculated using 1-second bins in cleaned event files. If a bin has >2000 counts, and if more than 50% of those come from <1% of pixels, then it is considered to be noise-dominated and hence unusable.
| Quadrant | # 1 sec bins | Bins with >0 counts | Bins with >2000 counts | High rate bins dominated by noise | Noise dominated (total time) | Noise dominated (detector-on time) | Marked lightcurve |
|---|---|---|---|---|---|---|---|
| A | 7317 | 6208 | 2326 | 2326 | 31.79% | 37.47% | 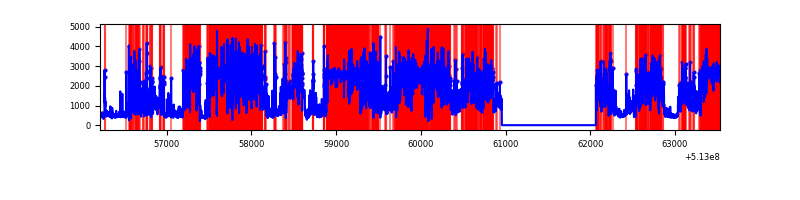 |
| B | 7318 | 6209 | 89 | 89 | 1.22% | 1.43% | 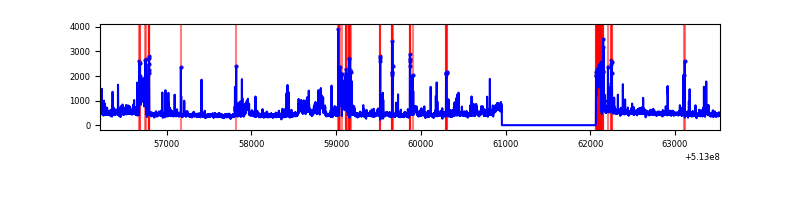 |
| C | 7319 | 6210 | 177 | 177 | 2.42% | 2.85% | 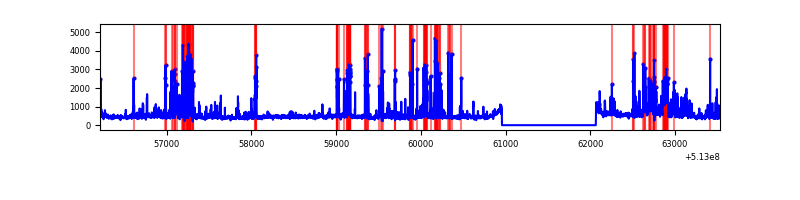 |
| D | 7319 | 6210 | 298 | 298 | 4.07% | 4.80% | 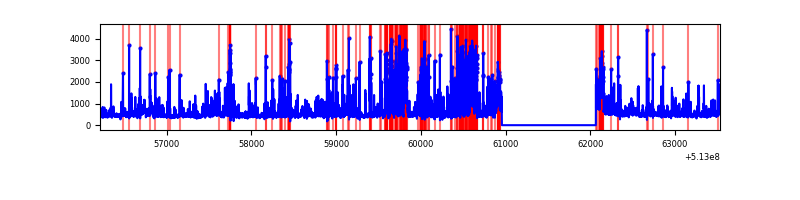 |
Top three noisy pixels from each quadrant. If the there are fewer than three noisy pixels in the level2.evt file, extra rows are filled as -1
| Pixel properties | Quadrant properties | ||||||
|---|---|---|---|---|---|---|---|
| Quadrant | DetID | PixID | Counts | Sigma | Mean | Median | Sigma |
| A | 7 | 64 | 7556288 | 57467.58 | 529 | 515 | 131.5 |
| A | 4 | 95 | 174843 | 1325.9 | 529 | 515 | 131.5 |
| A | 4 | 249 | 148194 | 1123.21 | 529 | 515 | 131.5 |
| B | 5 | 172 | 489560 | 3578.67 | 648 | 626 | 136.6 |
| B | 10 | 16 | 174988 | 1276.21 | 648 | 626 | 136.6 |
| B | 5 | 185 | 110169 | 801.78 | 648 | 626 | 136.6 |
| C | 13 | 3 | 1083996 | 6212.47 | 641 | 633 | 174.4 |
| C | 1 | 16 | 172405 | 985.01 | 641 | 633 | 174.4 |
| C | 7 | 87 | 58612 | 332.48 | 641 | 633 | 174.4 |
| D | 8 | 240 | 520599 | 2933.62 | 628 | 600 | 177.3 |
| D | 2 | 31 | 439813 | 2477.86 | 628 | 600 | 177.3 |
| D | 3 | 12 | 209894 | 1180.75 | 628 | 600 | 177.3 |
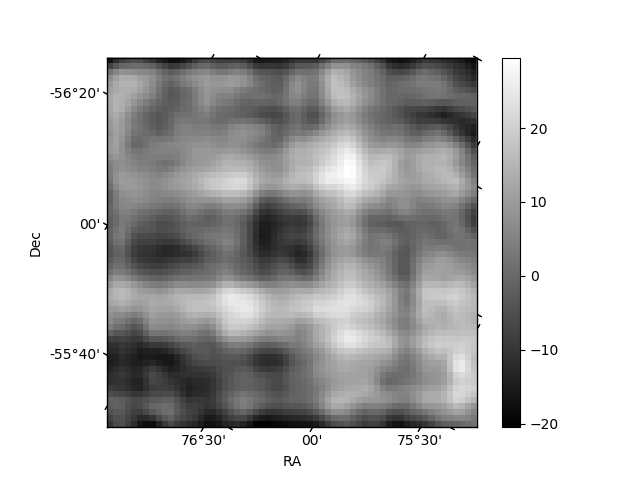
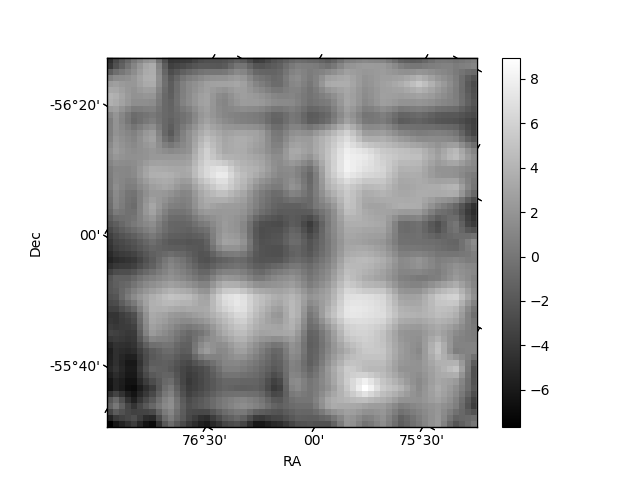
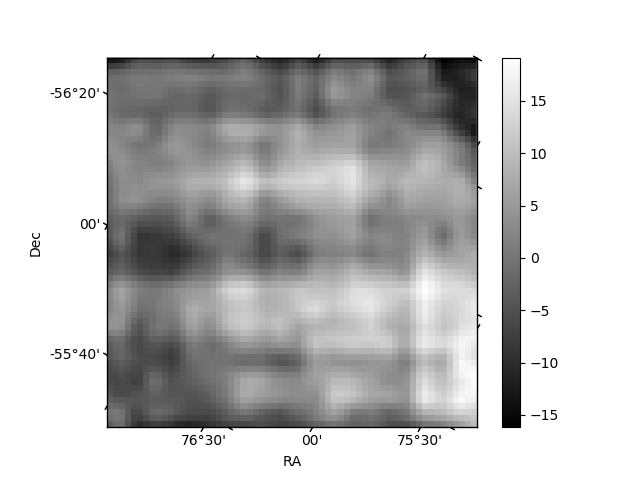
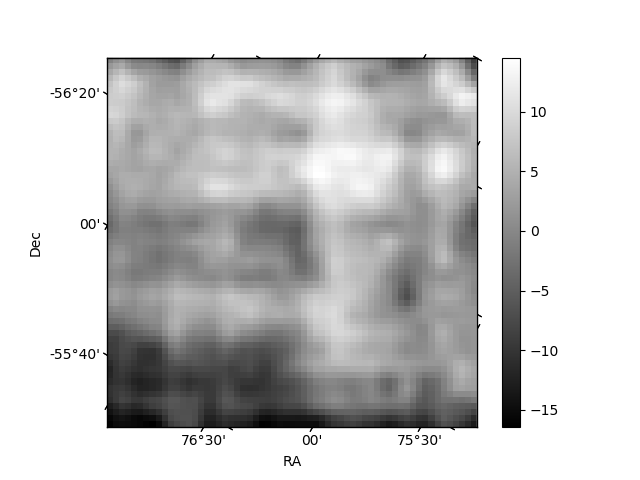
Histogram calculated using DETX and DETY for each event in the final _common_clean file
| Quadrant A | 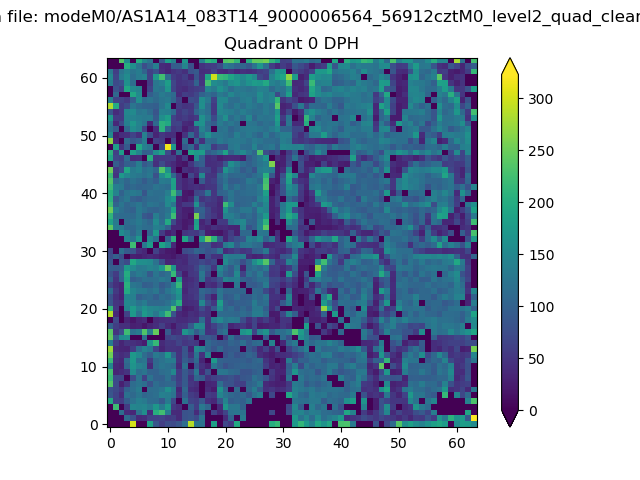 |
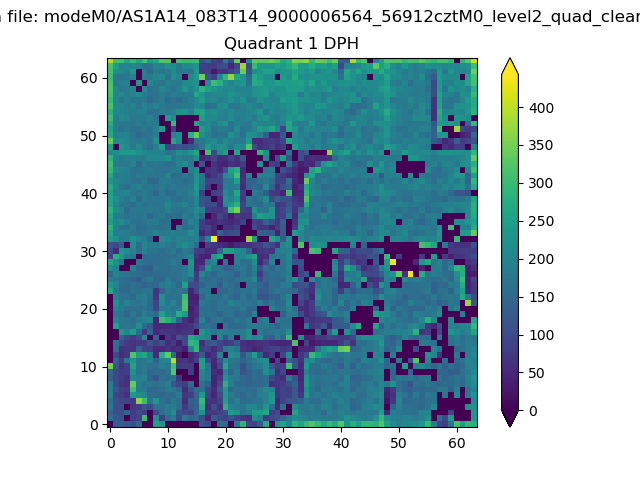 |
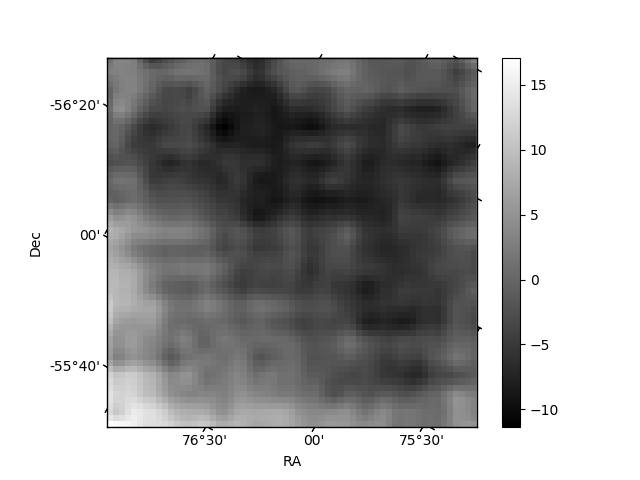
Quadrant B |
|---|---|---|---|
| Quadrant D | 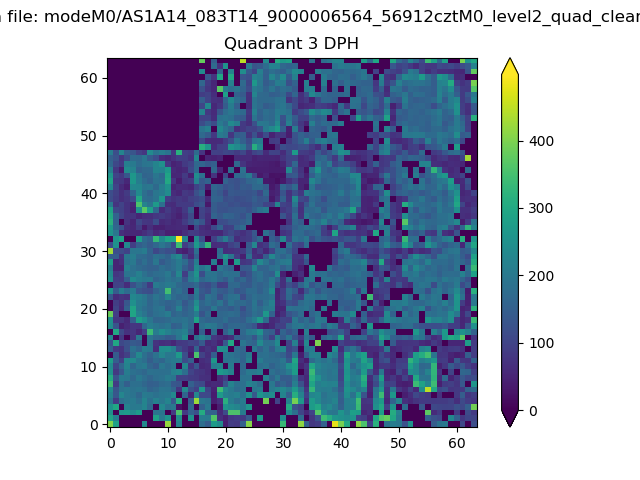 |
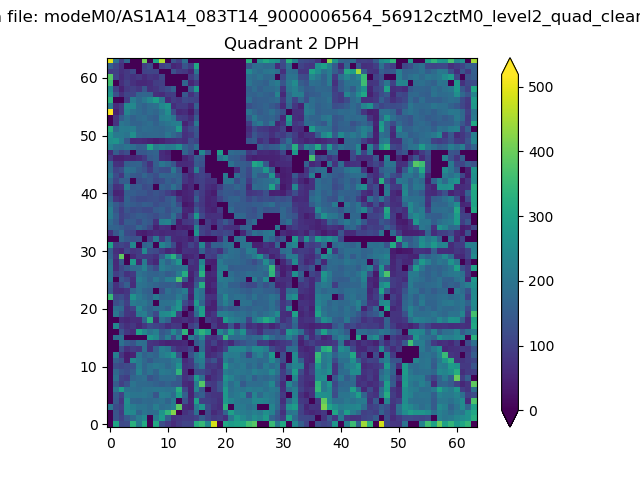 |
Quadrant C |
| Plot type | Count rate plots | Images |
|---|---|---|
| Comparison with Poisson distribution Blue bars denote a histogram of data divided into 1 sec bins. Red curve is a Poisson curve with rate = median count rate of data. |
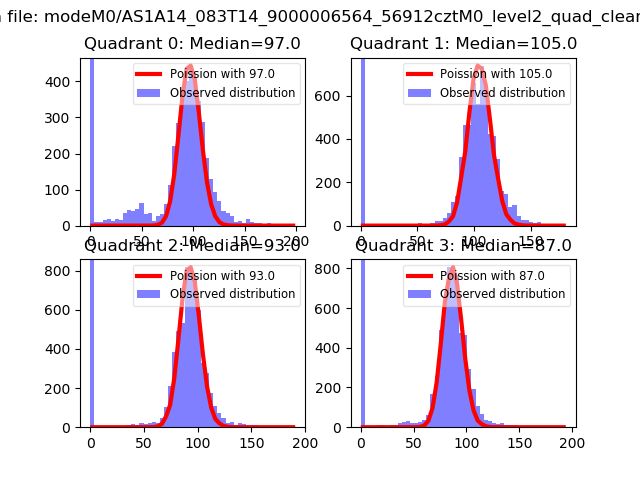 |
 |
| Quadrant-wise count rates Data is divided into 100 sec bins |
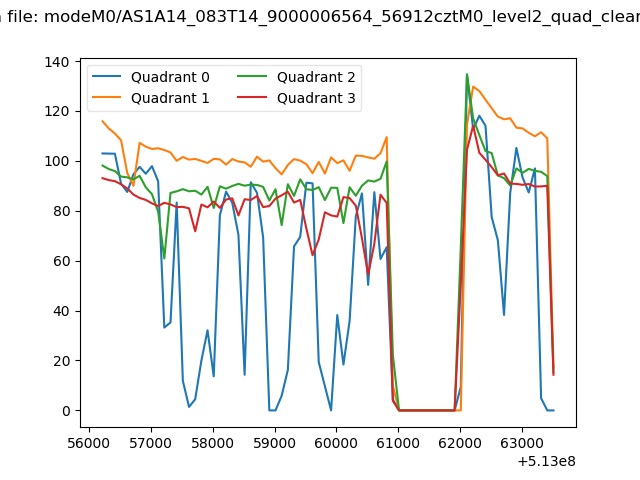 |
|
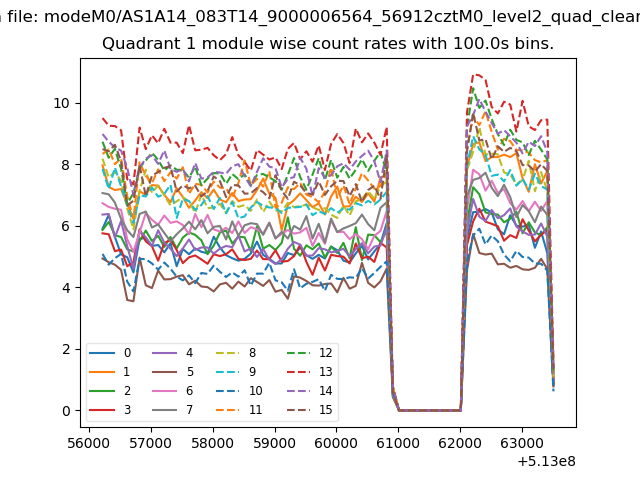
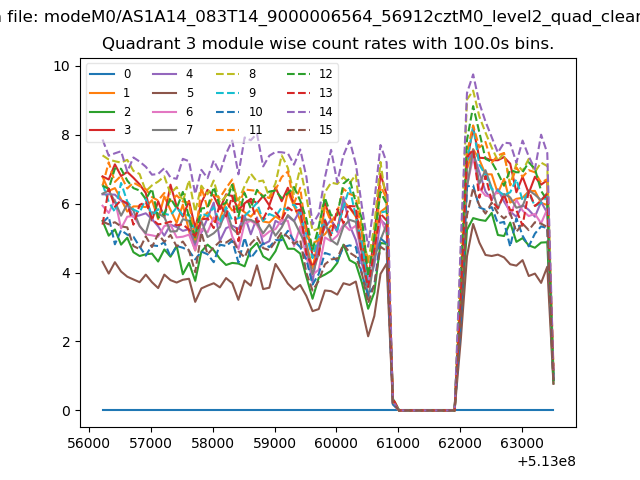
| Module-wise count rates for Quadrant A Data is divided into 100 sec bins |
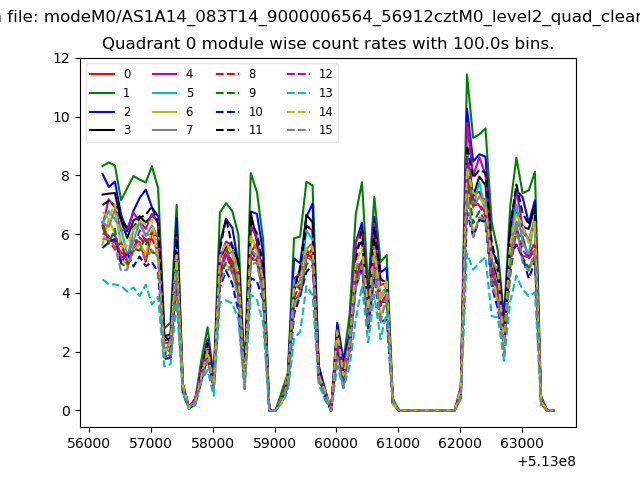 |
 |
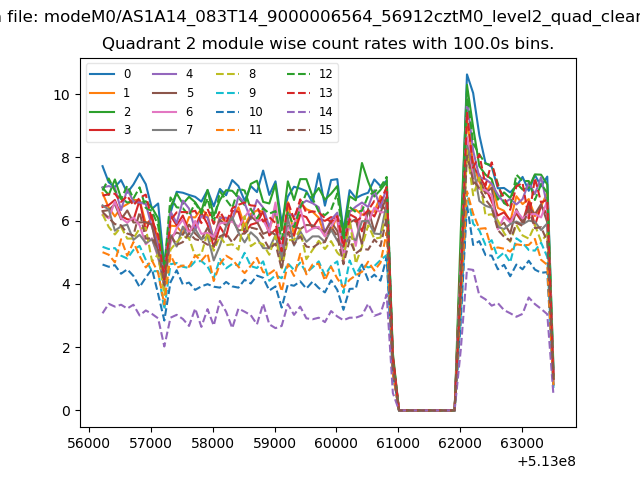
| Module-wise count rates for Quadrant B Data is divided into 100 sec bins |
 |
 |
| Module-wise count rates for Quadrant C Data is divided into 100 sec bins |
 |
 |
| Module-wise count rates for Quadrant D Data is divided into 100 sec bins |
 |
 |
| Parameter | Plot |
|---|---|
| CZT HV Monitor | 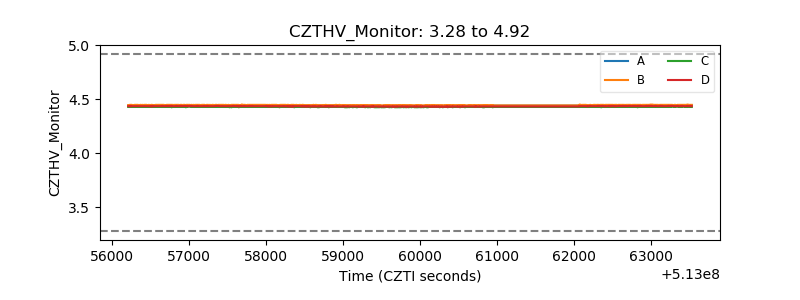 |
| D_VDD | 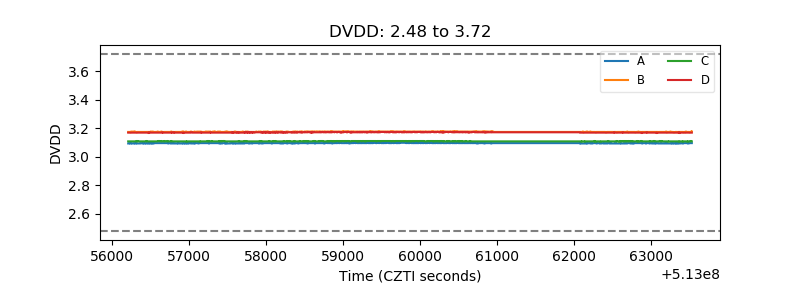 |
| Temperature 1 | 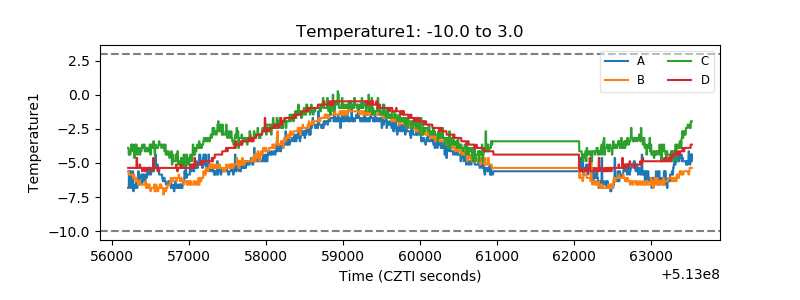 |
| Veto HV Monitor | 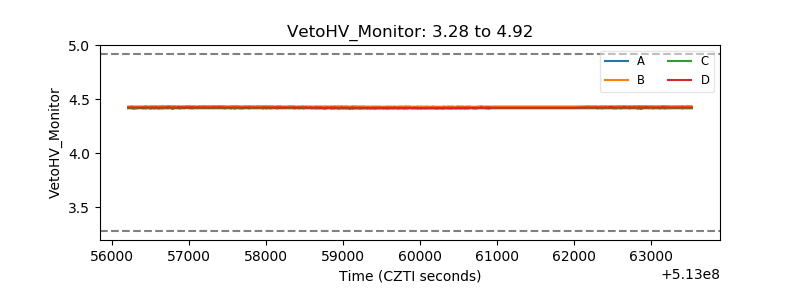 |
| Veto LLD | 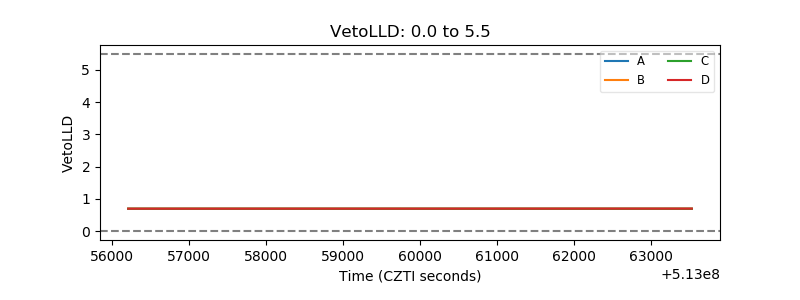 |
| Alpha Counter | 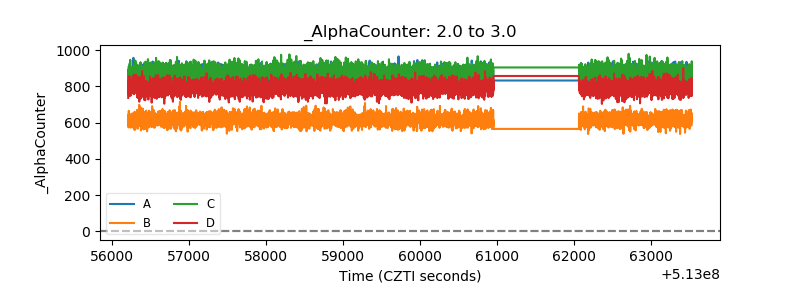 |
| _CPM_Rate | 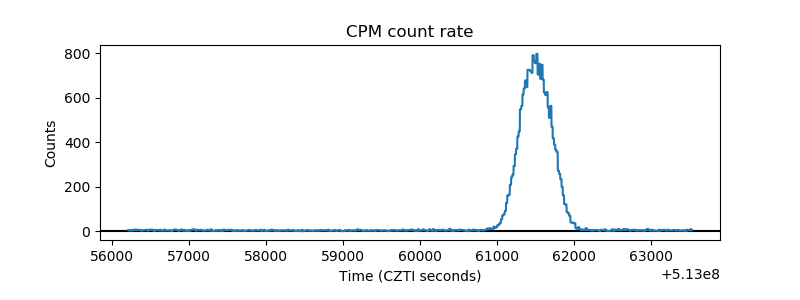 |
| CZT Counter | 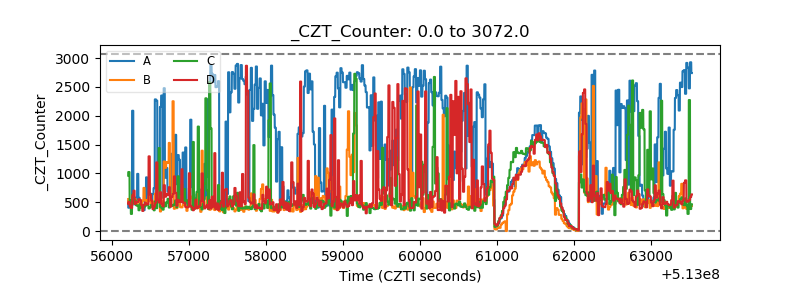 |
| +2.5 Volts monitor |  |
| +5 Volts monitor |  |
| _ROLL_ROT | 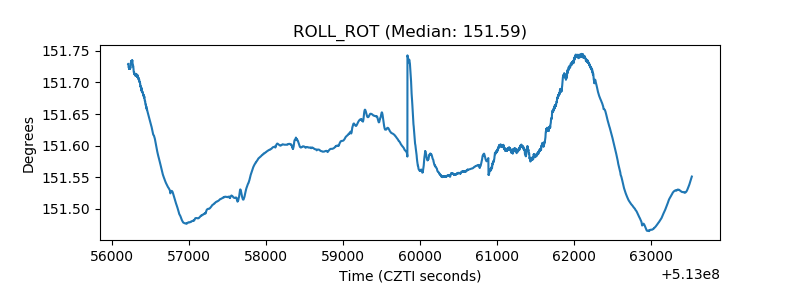 |
| _Roll_DEC | 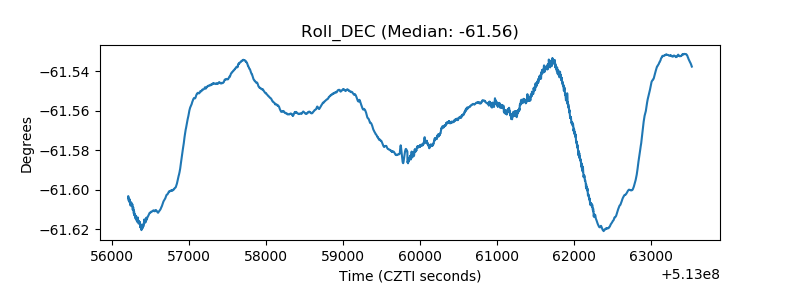 |
| _Roll_RA | 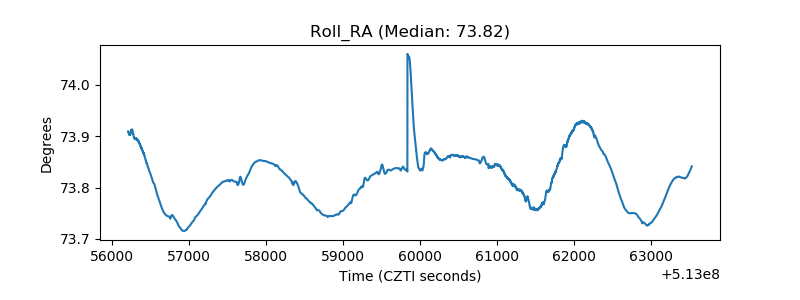 |
| Veto Counter | 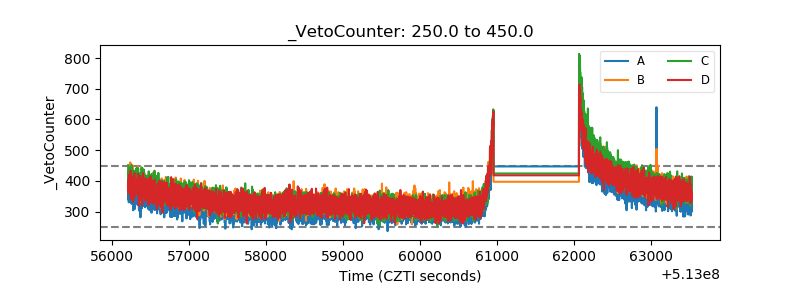 |