| Param | Original file | Final file |
|---|---|---|
| Filename | modeM0/AS1A14_083T14_9000006564_56913cztM0_level2.fits | modeM0/AS1A14_083T14_9000006564_56913cztM0_level2_quad_clean.evt |
| Size (bytes) | 598,633,920 | 82,304,640 |
| Size | 570.9 MB | 78.5 MB |
| Events in quadrant A | 5,900,698 | 495,845 |
| Events in quadrant B | 4,426,596 | 611,622 |
| Events in quadrant C | 7,493,358 | 430,046 |
| Events in quadrant D | 3,870,166 | 532,800 |
| Mode SS | |||
|---|---|---|---|
| Quadrant | BADHDUFLAG | Total packets | Discarded packets |
| A | 0 | 124 | 0 |
| B | 0 | 124 | 0 |
| C | 0 | 124 | 0 |
| D | 0 | 124 | 0 |
| Mode M9 | |||
|---|---|---|---|
| Quadrant | BADHDUFLAG | Total packets | Discarded packets |
| A | 0 | 11 | 0 |
| B | 0 | 11 | 0 |
| C | 0 | 11 | 0 |
| D | 0 | 11 | 0 |
| Mode M0 | |||
|---|---|---|---|
| Quadrant | BADHDUFLAG | Total packets | Discarded packets |
| A | 0 | 21711 | 2 |
| B | 0 | 17247 | 2 |
| C | 0 | 26546 | 2 |
| D | 0 | 15688 | 2 |
| Quadrant | Total seconds | Saturated seconds | Saturation percentage |
|---|---|---|---|
| A | 6035 | 1214 | 20.115990% |
| B | 6035 | 497 | 8.235294% |
| C | 6036 | 1657 | 27.451955% |
| D | 6035 | 213 | 3.529412% |
Noise dominated data is calculated using 1-second bins in cleaned event files. If a bin has >2000 counts, and if more than 50% of those come from <1% of pixels, then it is considered to be noise-dominated and hence unusable.
| Quadrant | # 1 sec bins | Bins with >0 counts | Bins with >2000 counts | High rate bins dominated by noise | Noise dominated (total time) | Noise dominated (detector-on time) | Marked lightcurve |
|---|---|---|---|---|---|---|---|
| A | 7165 | 6036 | 1016 | 1016 | 14.18% | 16.83% | 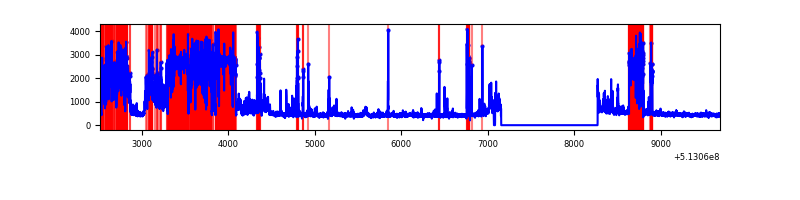 |
| B | 7165 | 6037 | 283 | 283 | 3.95% | 4.69% | 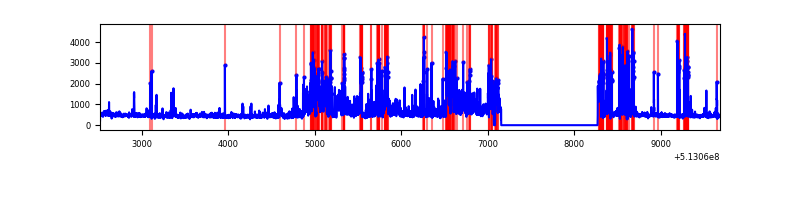 |
| C | 7166 | 6037 | 1565 | 1565 | 21.84% | 25.92% | 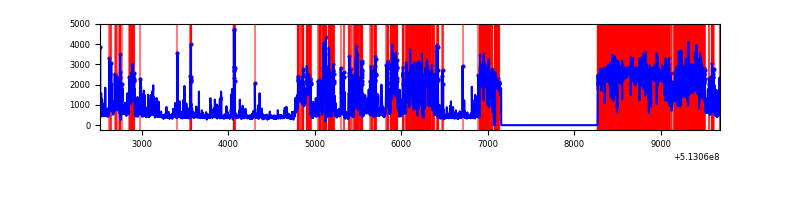 |
| D | 7165 | 6037 | 125 | 125 | 1.74% | 2.07% | 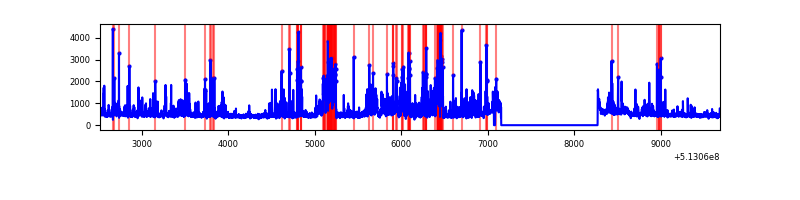 |
Top three noisy pixels from each quadrant. If the there are fewer than three noisy pixels in the level2.evt file, extra rows are filled as -1
| Pixel properties | Quadrant properties | ||||||
|---|---|---|---|---|---|---|---|
| Quadrant | DetID | PixID | Counts | Sigma | Mean | Median | Sigma |
| A | 7 | 64 | 3167967 | 21433.81 | 596 | 579 | 147.8 |
| A | 4 | 95 | 137581 | 927.1 | 596 | 579 | 147.8 |
| A | 3 | 14 | 108888 | 732.93 | 596 | 579 | 147.8 |
| B | 5 | 172 | 789277 | 6012.42 | 621 | 598 | 131.2 |
| B | 5 | 185 | 553085 | 4211.83 | 621 | 598 | 131.2 |
| B | 10 | 16 | 429103 | 3266.67 | 621 | 598 | 131.2 |
| C | 9 | 38 | 4535176 | 29578.47 | 560 | 554 | 153.3 |
| C | 13 | 3 | 423510 | 2758.86 | 560 | 554 | 153.3 |
| C | 6 | 223 | 130031 | 844.55 | 560 | 554 | 153.3 |
| D | 8 | 240 | 241437 | 1352.22 | 635 | 607 | 178.1 |
| D | 2 | 31 | 231200 | 1294.74 | 635 | 607 | 178.1 |
| D | 2 | 249 | 209234 | 1171.41 | 635 | 607 | 178.1 |
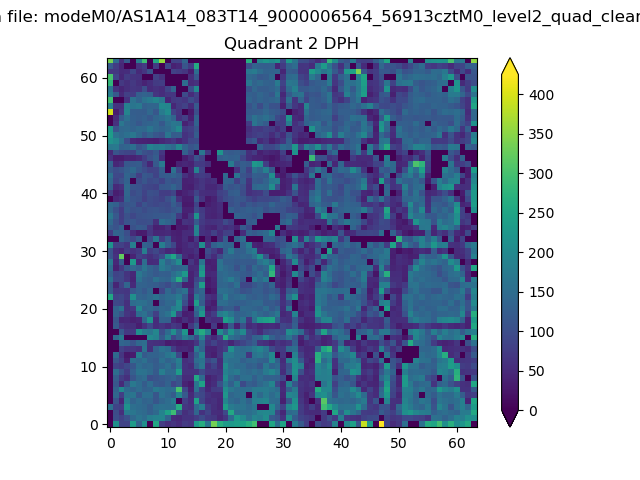
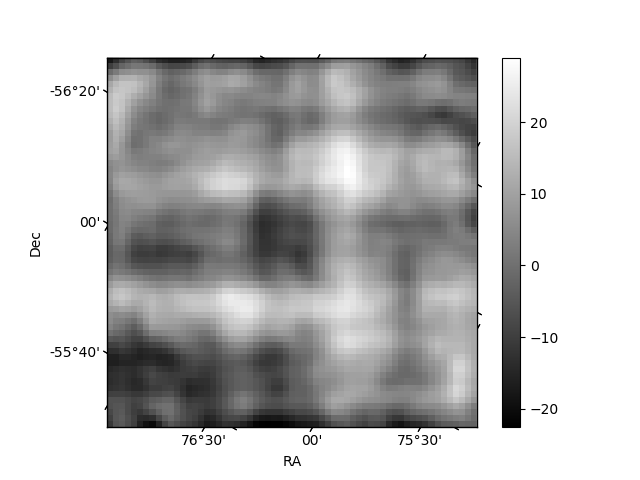
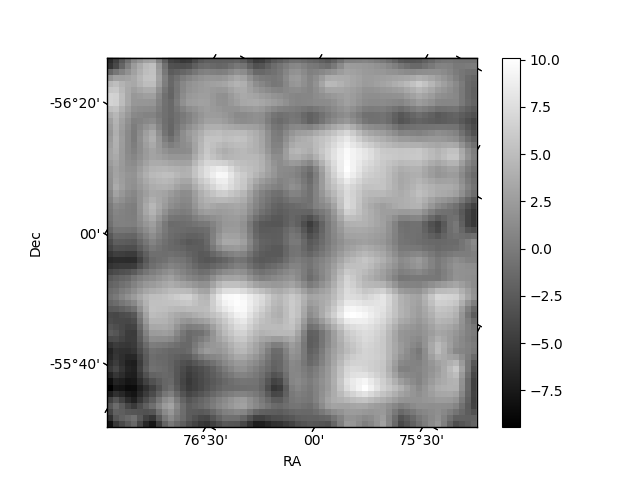
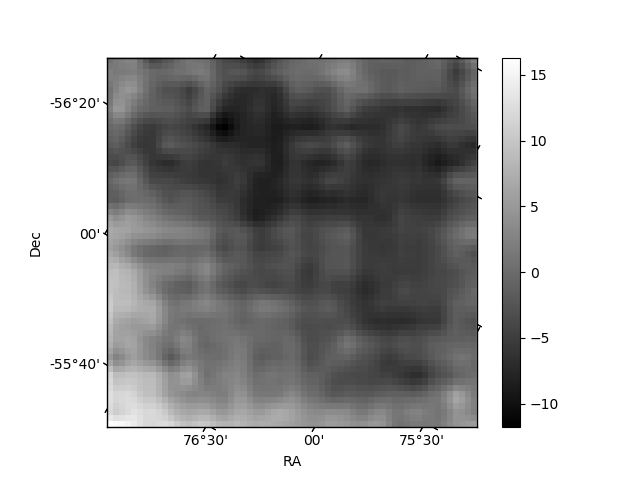
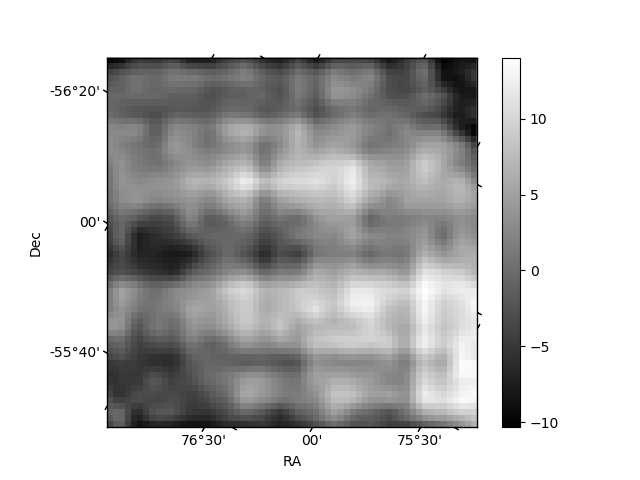
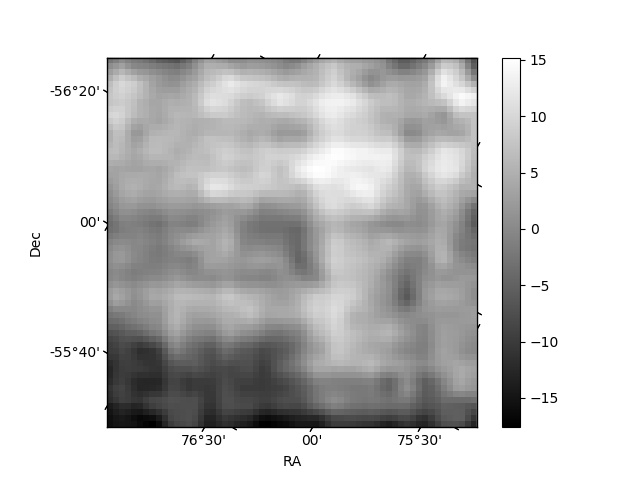
Histogram calculated using DETX and DETY for each event in the final _common_clean file
| Quadrant A | 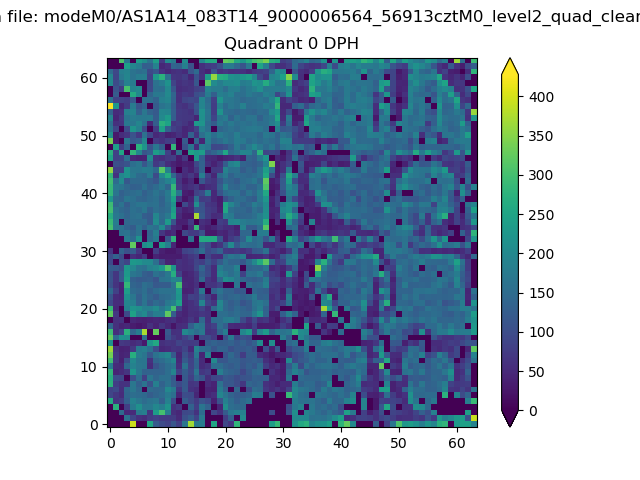 |
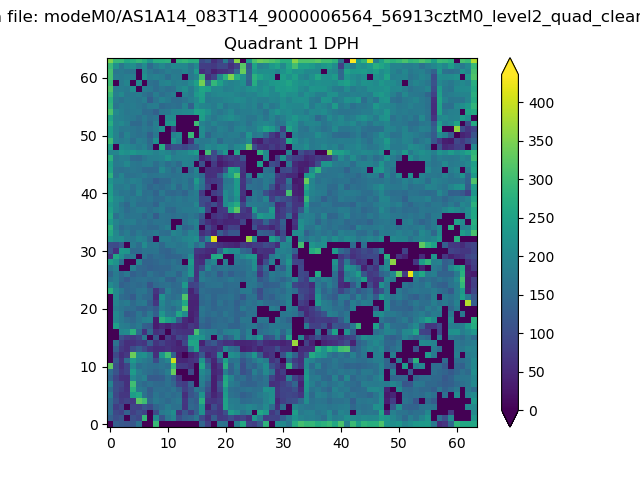 |
Quadrant B |
|---|---|---|---|
| Quadrant D | 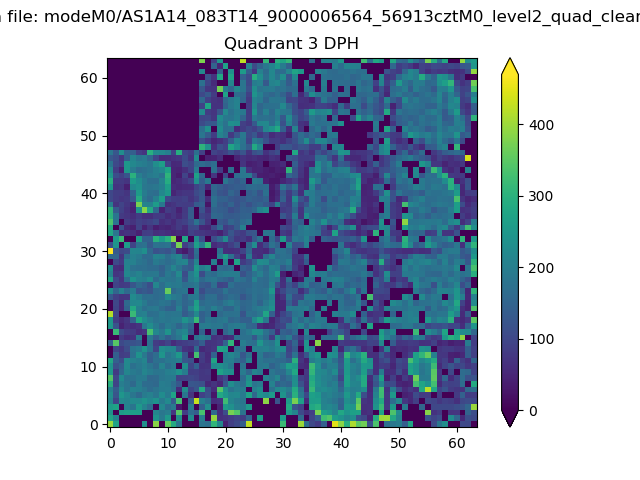 |
 |
Quadrant C |
| Plot type | Count rate plots | Images |
|---|---|---|
| Comparison with Poisson distribution Blue bars denote a histogram of data divided into 1 sec bins. Red curve is a Poisson curve with rate = median count rate of data. |
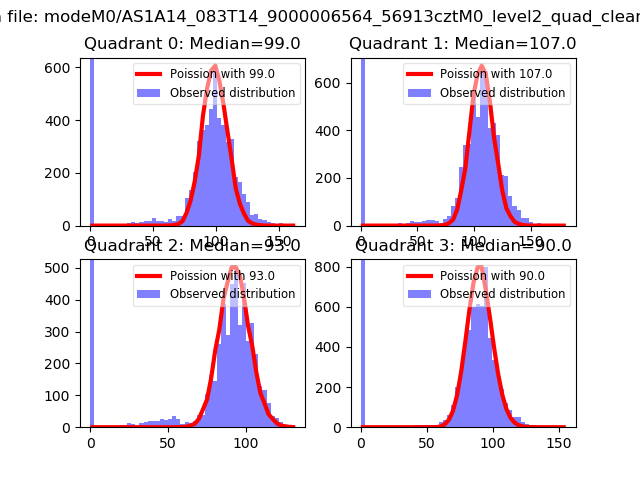 |
 |
| Quadrant-wise count rates Data is divided into 100 sec bins |
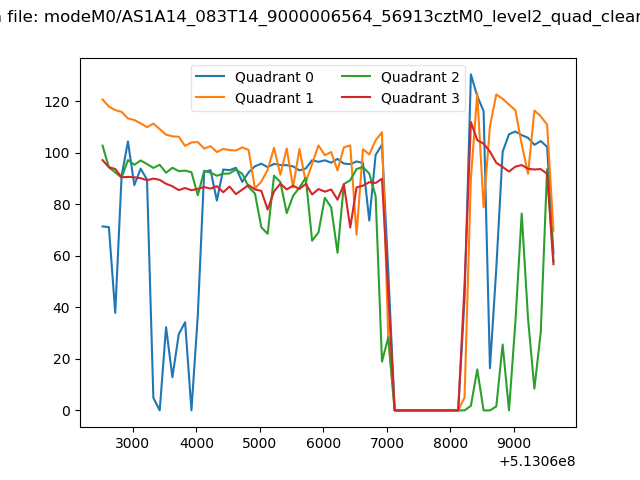 |
|
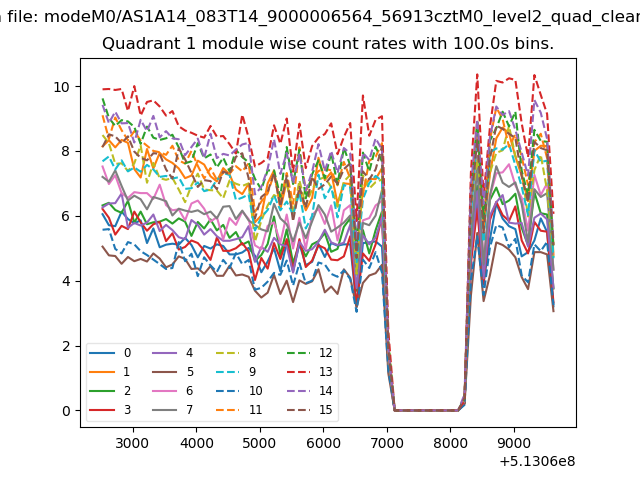
| Module-wise count rates for Quadrant A Data is divided into 100 sec bins |
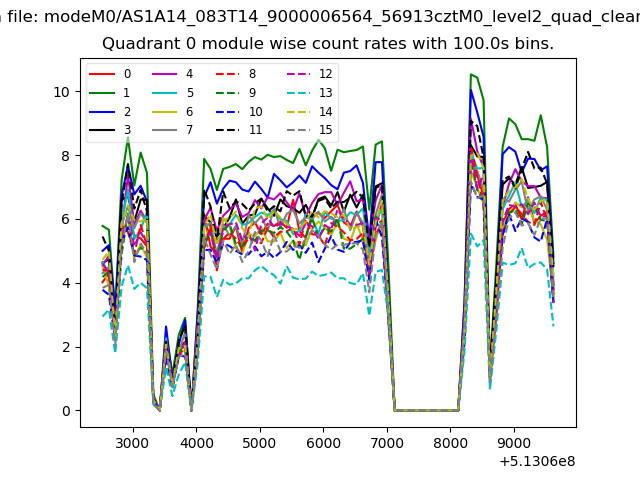 |
 |
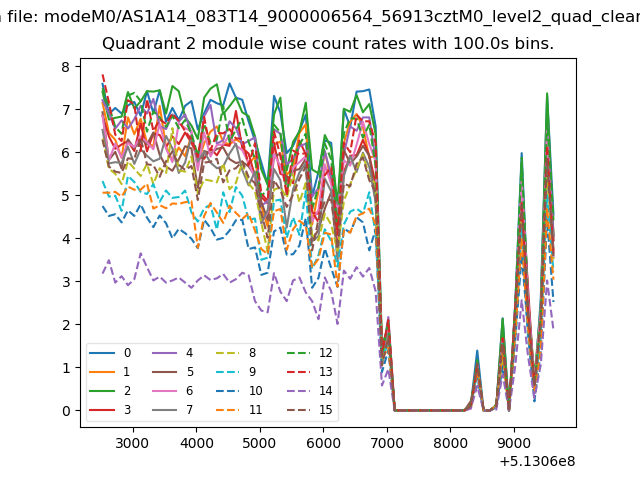
| Module-wise count rates for Quadrant B Data is divided into 100 sec bins |
 |
 |
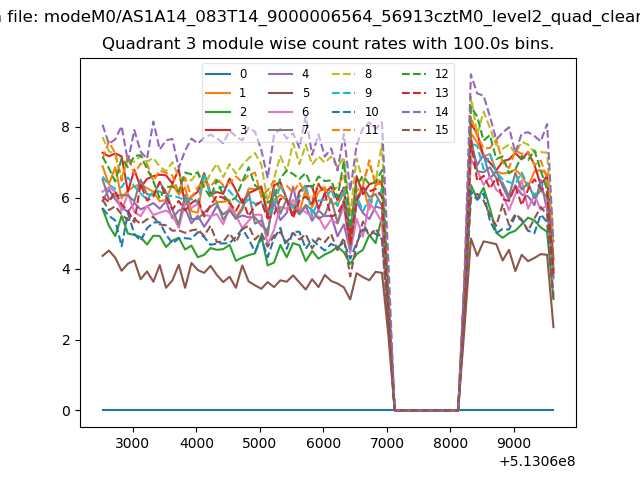
| Module-wise count rates for Quadrant C Data is divided into 100 sec bins |
 |
 |
| Module-wise count rates for Quadrant D Data is divided into 100 sec bins |
 |
 |
| Parameter | Plot |
|---|---|
| CZT HV Monitor | 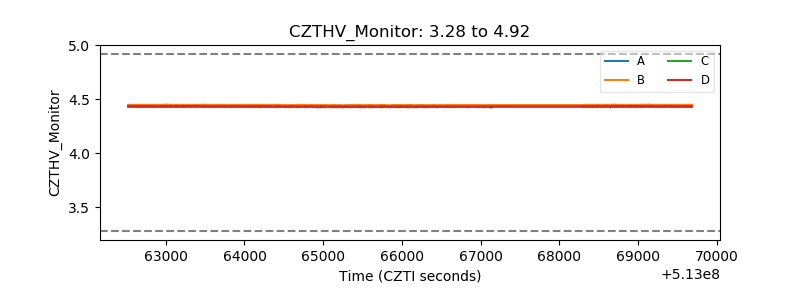 |
| D_VDD | 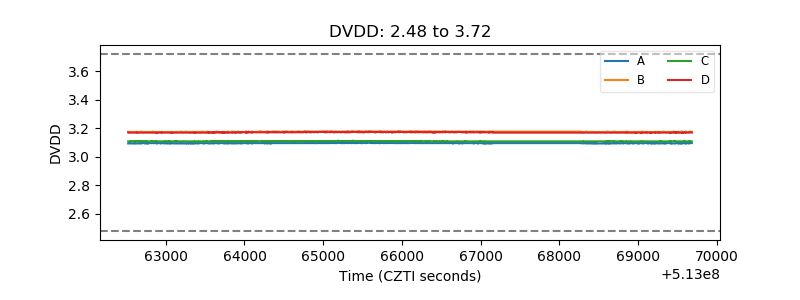 |
| Temperature 1 | 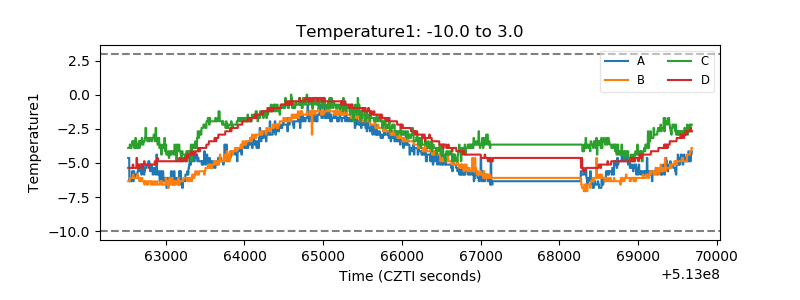 |
| Veto HV Monitor | 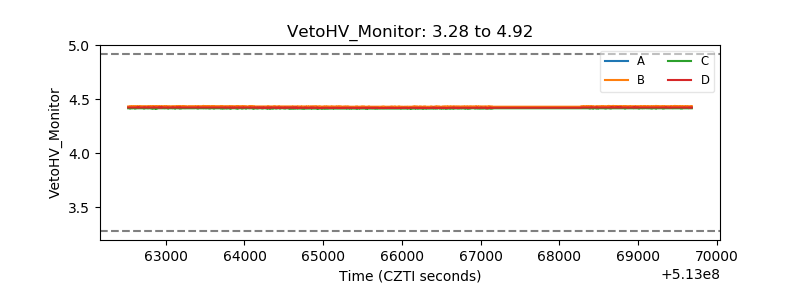 |
| Veto LLD | 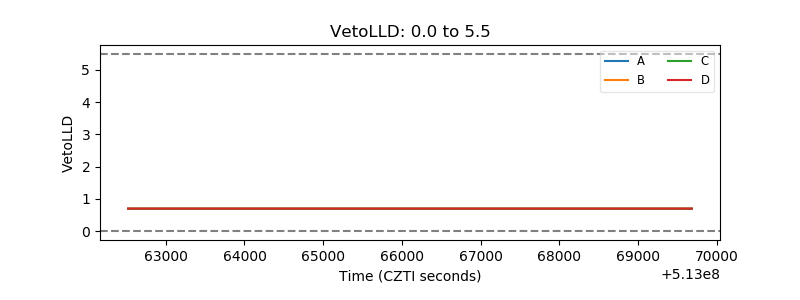 |
| Alpha Counter | 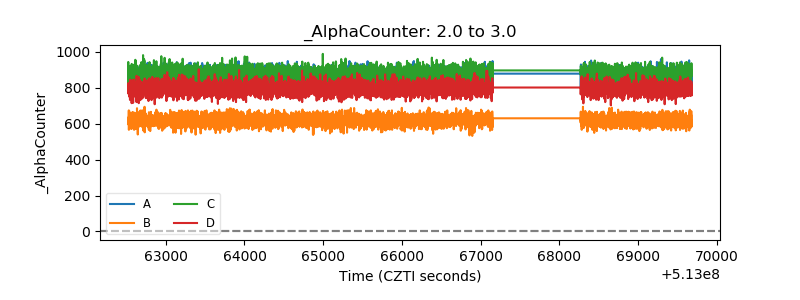 |
| _CPM_Rate | 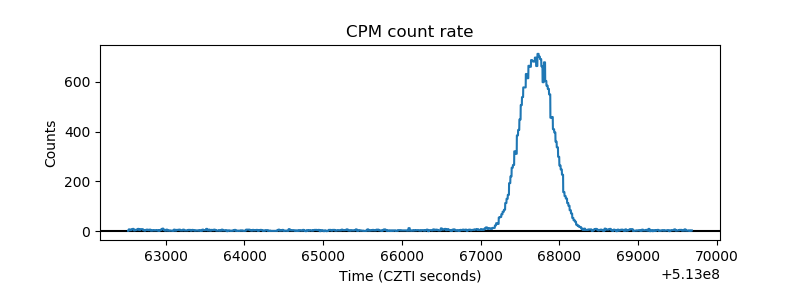 |
| CZT Counter | 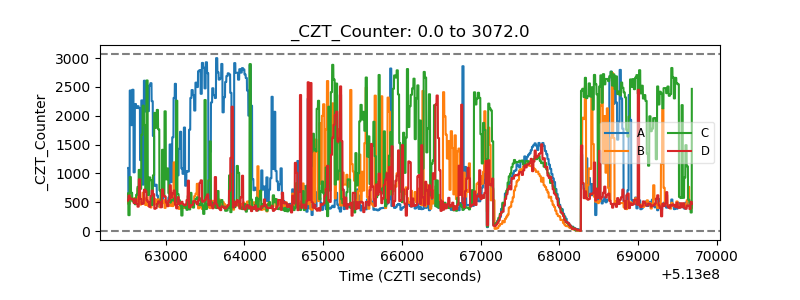 |
| +2.5 Volts monitor |  |
| +5 Volts monitor | 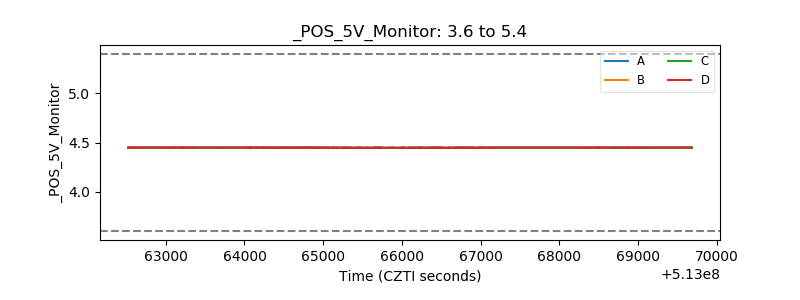 |
| _ROLL_ROT | 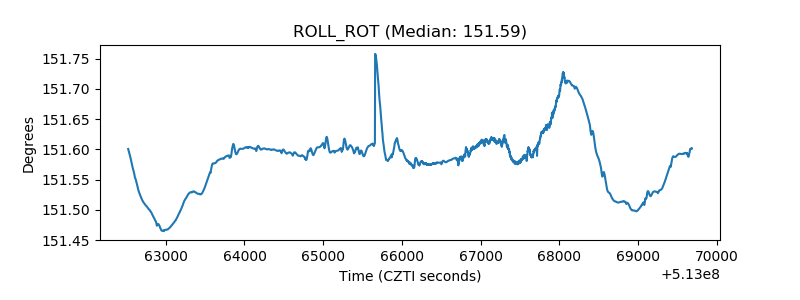 |
| _Roll_DEC | 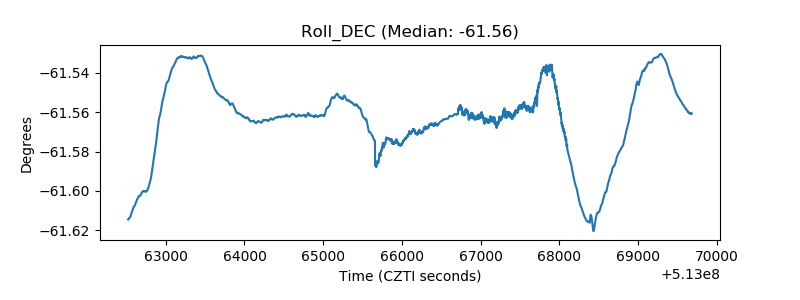 |
| _Roll_RA | 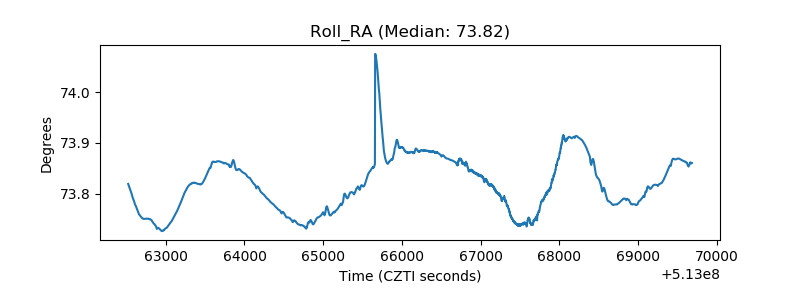 |
| Veto Counter | 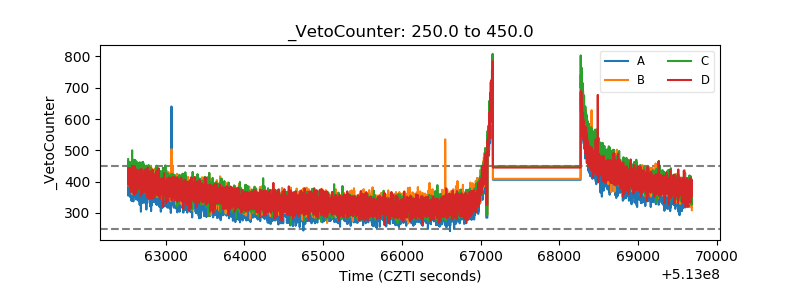 |