| Param | Original file | Final file |
|---|---|---|
| Filename | modeM0/AS1A14_083T14_9000006564_56914cztM0_level2.fits | modeM0/AS1A14_083T14_9000006564_56914cztM0_level2_quad_clean.evt |
| Size (bytes) | 586,373,760 | 83,093,760 |
| Size | 559.2 MB | 79.2 MB |
| Events in quadrant A | 3,021,983 | 583,425 |
| Events in quadrant B | 4,474,506 | 604,014 |
| Events in quadrant C | 9,518,347 | 399,053 |
| Events in quadrant D | 4,232,683 | 516,664 |
| Mode SS | |||
|---|---|---|---|
| Quadrant | BADHDUFLAG | Total packets | Discarded packets |
| A | 0 | 120 | 0 |
| B | 0 | 120 | 0 |
| C | 0 | 120 | 0 |
| D | 0 | 120 | 0 |
| Mode M9 | |||
|---|---|---|---|
| Quadrant | BADHDUFLAG | Total packets | Discarded packets |
| A | 0 | 11 | 0 |
| B | 0 | 11 | 0 |
| C | 0 | 11 | 0 |
| D | 0 | 11 | 0 |
| Mode M0 | |||
|---|---|---|---|
| Quadrant | BADHDUFLAG | Total packets | Discarded packets |
| A | 0 | 13229 | 1 |
| B | 0 | 17410 | 1 |
| C | 0 | 32397 | 1 |
| D | 0 | 16697 | 1 |
| Quadrant | Total seconds | Saturated seconds | Saturation percentage |
|---|---|---|---|
| A | 5909 | 156 | 2.640041% |
| B | 5909 | 421 | 7.124725% |
| C | 5910 | 1982 | 33.536379% |
| D | 5910 | 288 | 4.873096% |
Noise dominated data is calculated using 1-second bins in cleaned event files. If a bin has >2000 counts, and if more than 50% of those come from <1% of pixels, then it is considered to be noise-dominated and hence unusable.
| Quadrant | # 1 sec bins | Bins with >0 counts | Bins with >2000 counts | High rate bins dominated by noise | Noise dominated (total time) | Noise dominated (detector-on time) | Marked lightcurve |
|---|---|---|---|---|---|---|---|
| A | 7019 | 5910 | 71 | 71 | 1.01% | 1.20% | 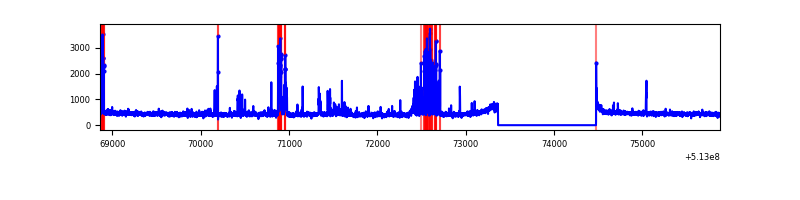 |
| B | 7019 | 5910 | 228 | 228 | 3.25% | 3.86% | 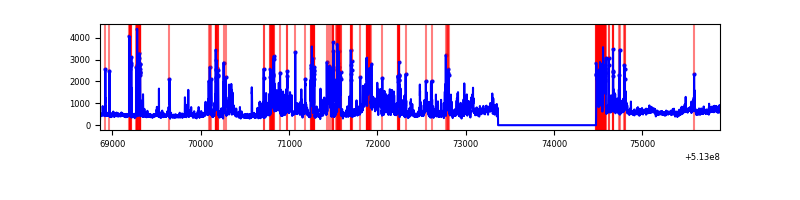 |
| C | 7020 | 5910 | 1838 | 1838 | 26.18% | 31.10% | 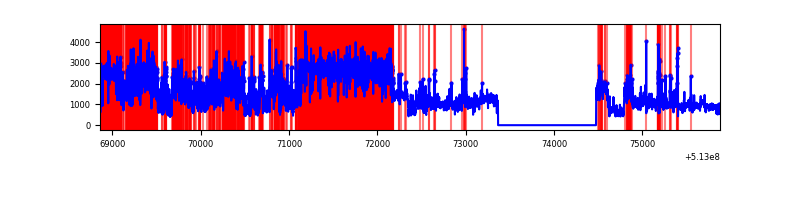 |
| D | 7020 | 5911 | 239 | 239 | 3.40% | 4.04% | 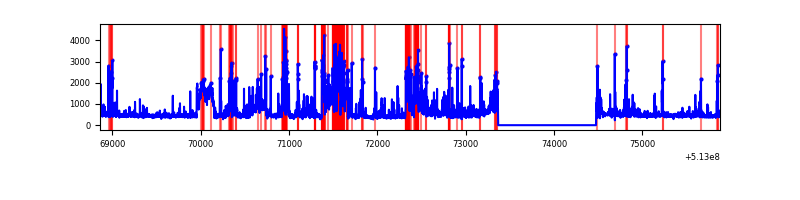 |
Top three noisy pixels from each quadrant. If the there are fewer than three noisy pixels in the level2.evt file, extra rows are filled as -1
| Pixel properties | Quadrant properties | ||||||
|---|---|---|---|---|---|---|---|
| Quadrant | DetID | PixID | Counts | Sigma | Mean | Median | Sigma |
| A | 4 | 249 | 236974 | 1508.72 | 640 | 626 | 156.7 |
| A | 7 | 64 | 192131 | 1222.47 | 640 | 626 | 156.7 |
| A | 3 | 14 | 30438 | 190.3 | 640 | 626 | 156.7 |
| B | 5 | 172 | 1223744 | 9506.86 | 616 | 595 | 128.7 |
| B | 10 | 16 | 249245 | 1932.62 | 616 | 595 | 128.7 |
| B | 0 | 197 | 147559 | 1142.27 | 616 | 595 | 128.7 |
| C | 9 | 38 | 6798431 | 44833.56 | 554 | 547 | 151.6 |
| C | 13 | 3 | 408996 | 2693.81 | 554 | 547 | 151.6 |
| C | 6 | 223 | 26136 | 168.77 | 554 | 547 | 151.6 |
| D | 11 | 129 | 696794 | 4002.0 | 616 | 587 | 174.0 |
| D | 2 | 249 | 397779 | 2283.17 | 616 | 587 | 174.0 |
| D | 8 | 240 | 390230 | 2239.78 | 616 | 587 | 174.0 |
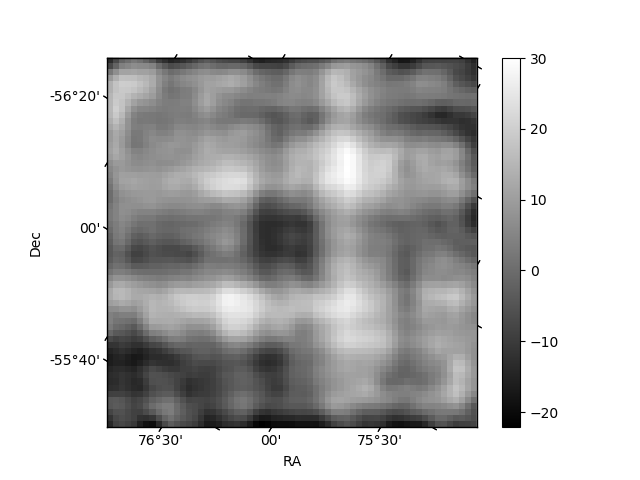
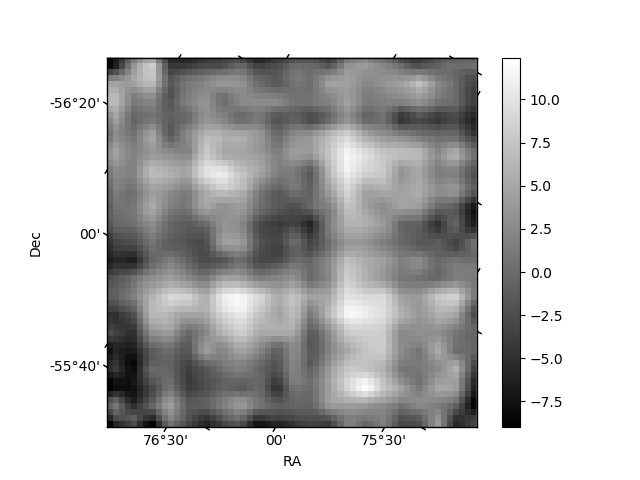
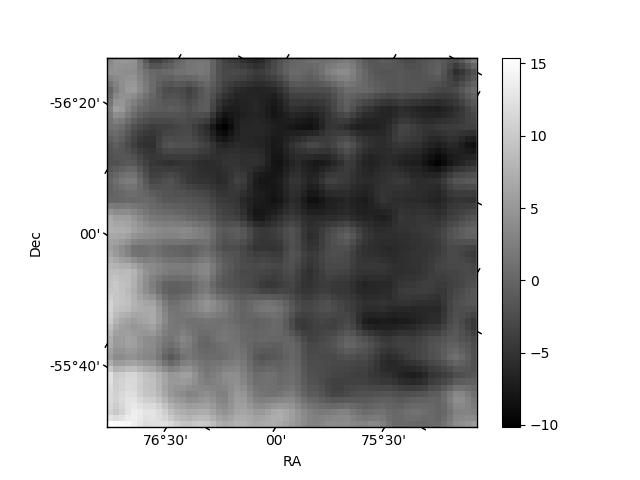
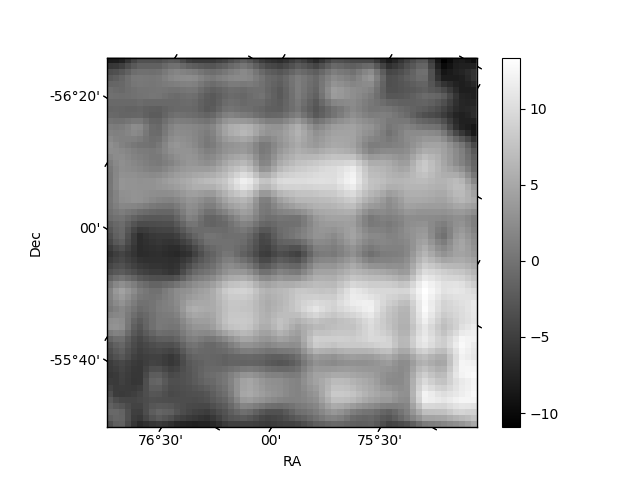
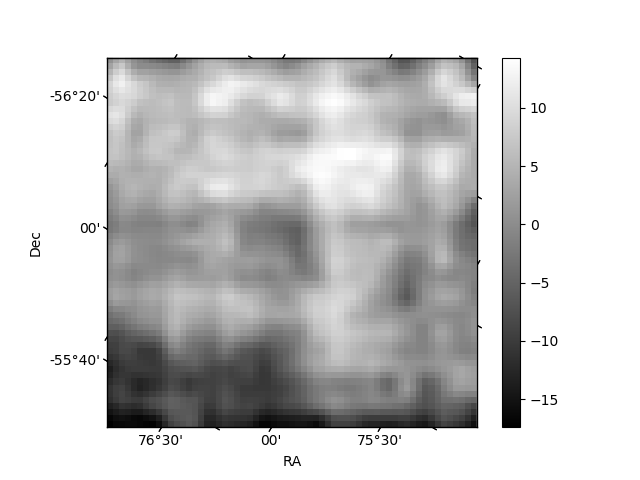
Histogram calculated using DETX and DETY for each event in the final _common_clean file
| Quadrant A | 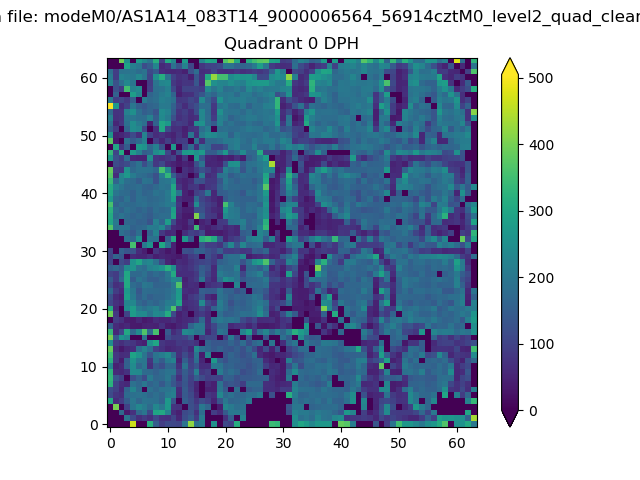 |
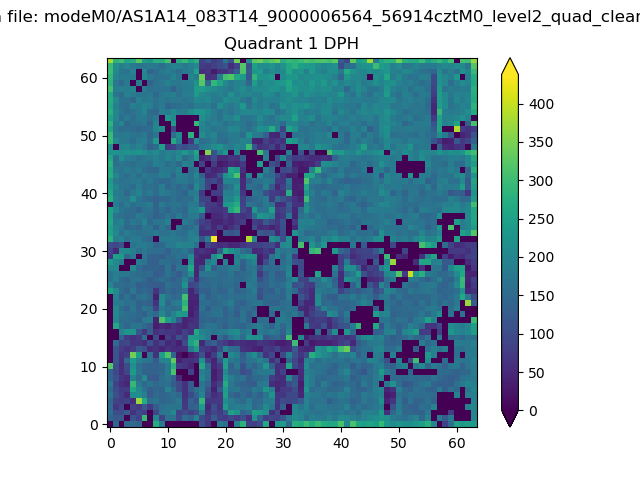 |
Quadrant B |
|---|---|---|---|
| Quadrant D | 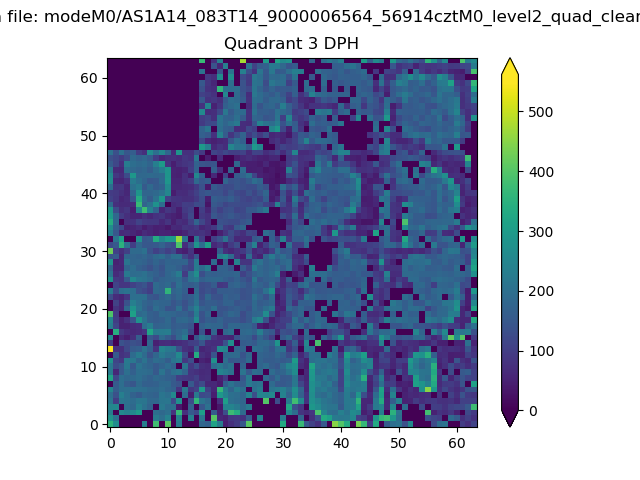 |
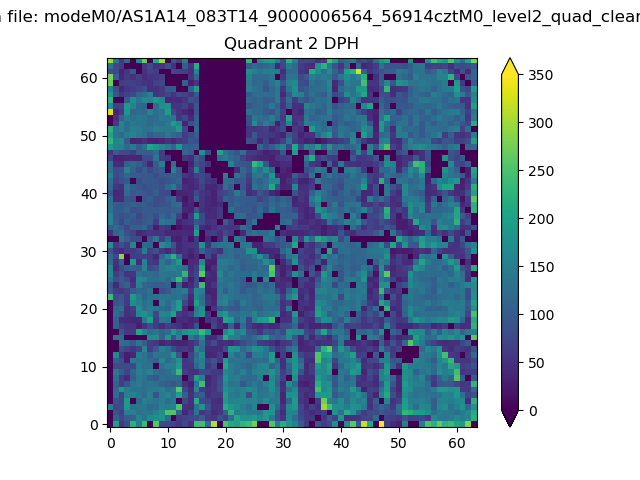 |
Quadrant C |
| Plot type | Count rate plots | Images |
|---|---|---|
| Comparison with Poisson distribution Blue bars denote a histogram of data divided into 1 sec bins. Red curve is a Poisson curve with rate = median count rate of data. |
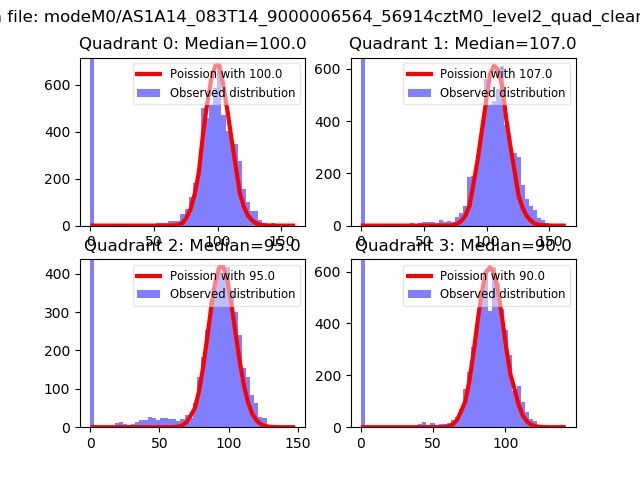 |
 |
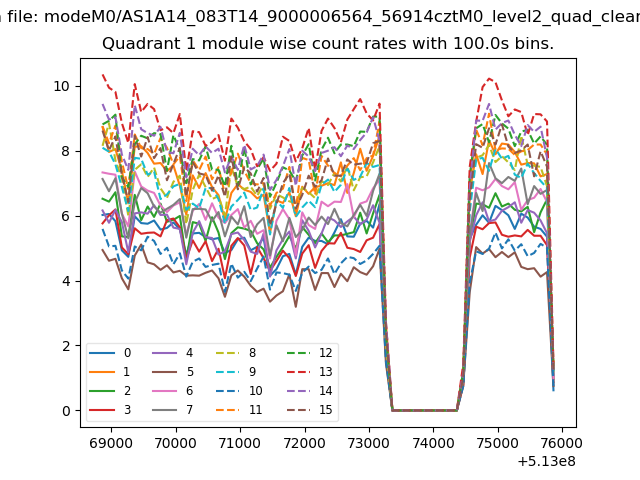
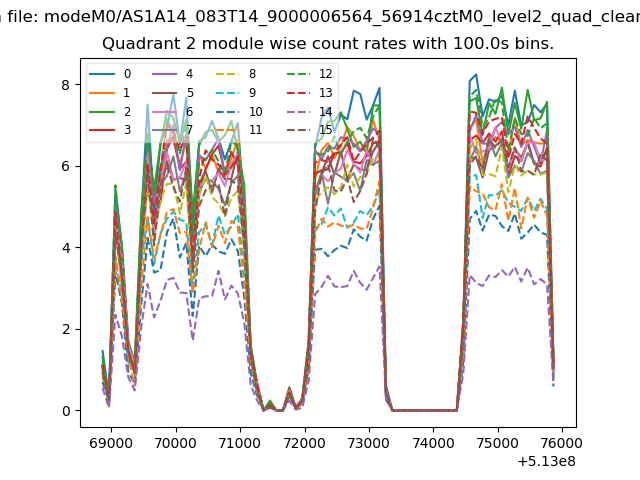
| Quadrant-wise count rates Data is divided into 100 sec bins |
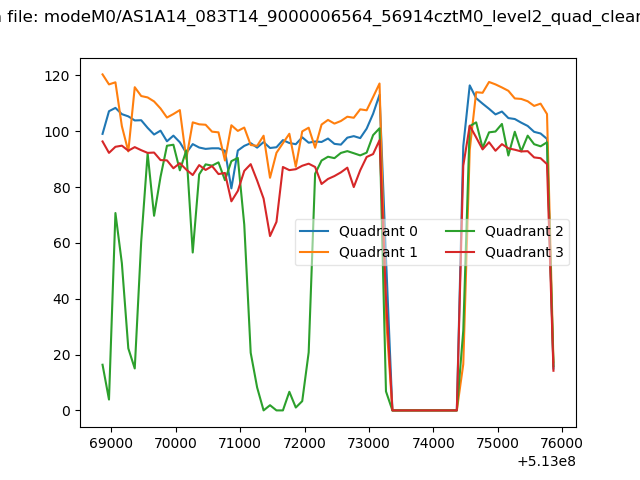 |
|
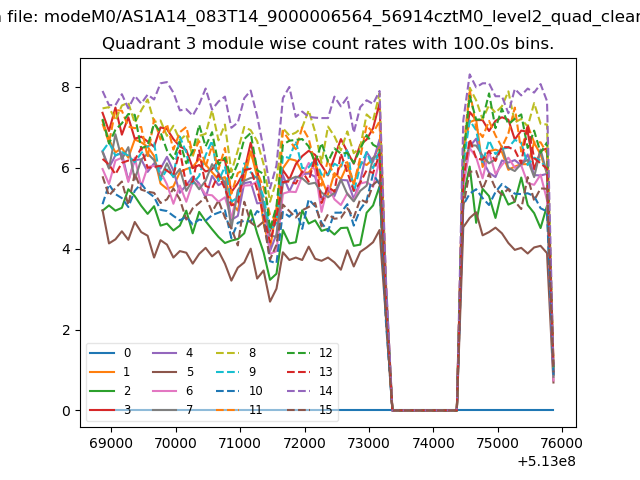
| Module-wise count rates for Quadrant A Data is divided into 100 sec bins |
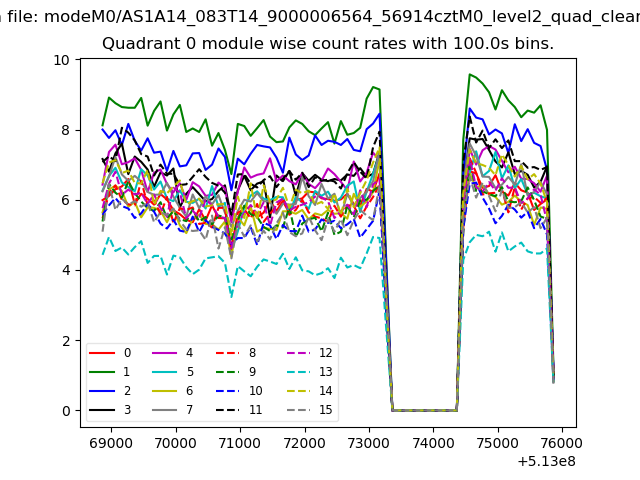 |
 |
| Module-wise count rates for Quadrant B Data is divided into 100 sec bins |
 |
 |
| Module-wise count rates for Quadrant C Data is divided into 100 sec bins |
 |
 |
| Module-wise count rates for Quadrant D Data is divided into 100 sec bins |
 |
 |
| Parameter | Plot |
|---|---|
| CZT HV Monitor | 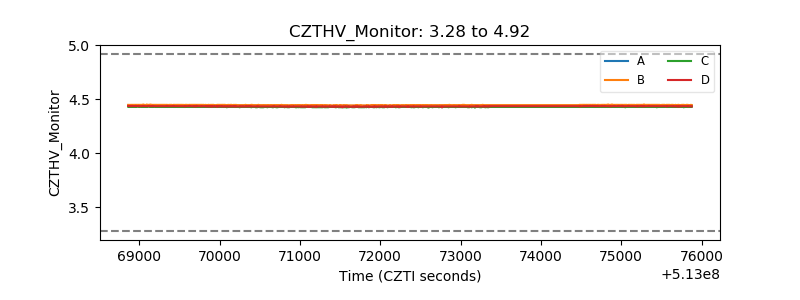 |
| D_VDD | 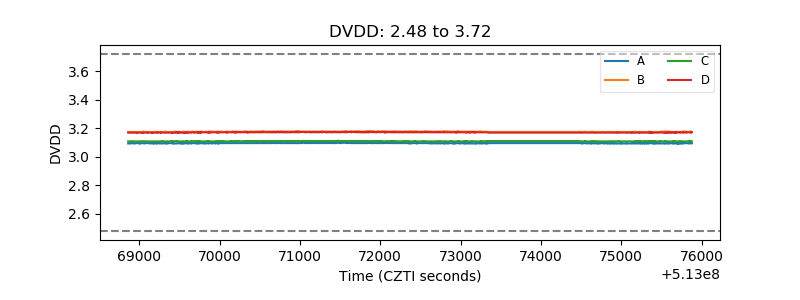 |
| Temperature 1 | 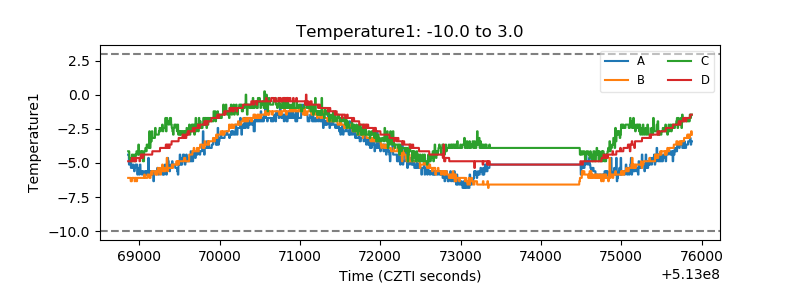 |
| Veto HV Monitor | 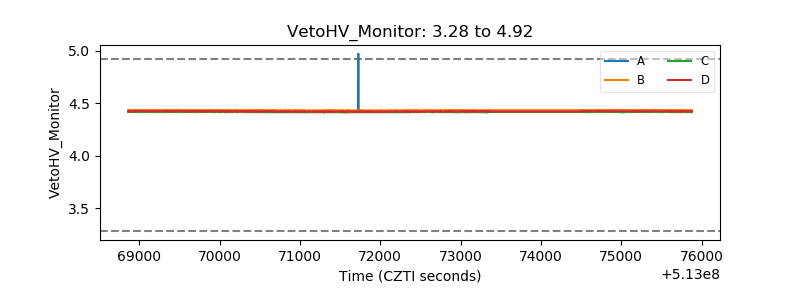 |
| Veto LLD | 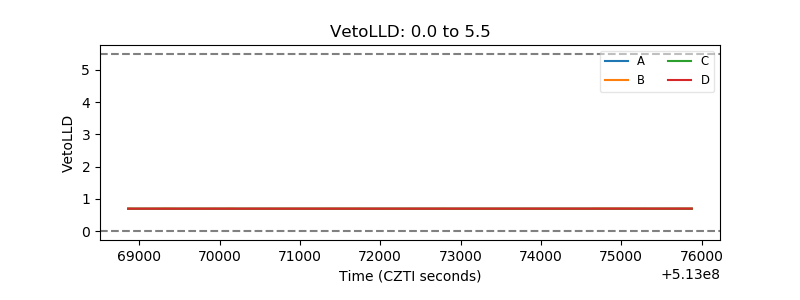 |
| Alpha Counter | 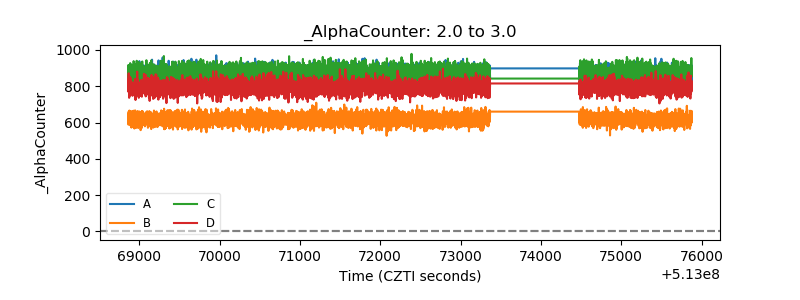 |
| _CPM_Rate | 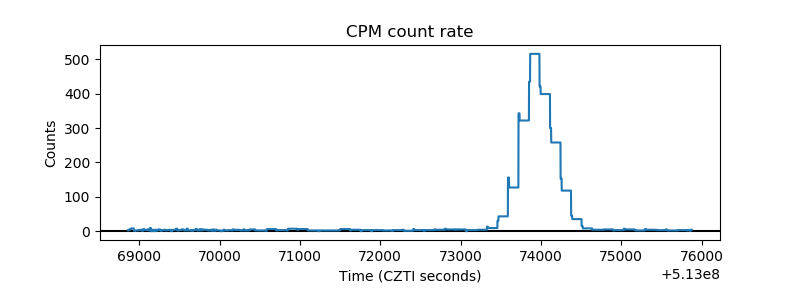 |
| CZT Counter | 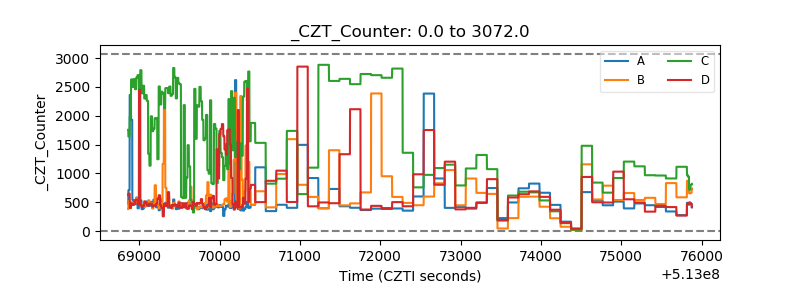 |
| +2.5 Volts monitor |  |
| +5 Volts monitor | 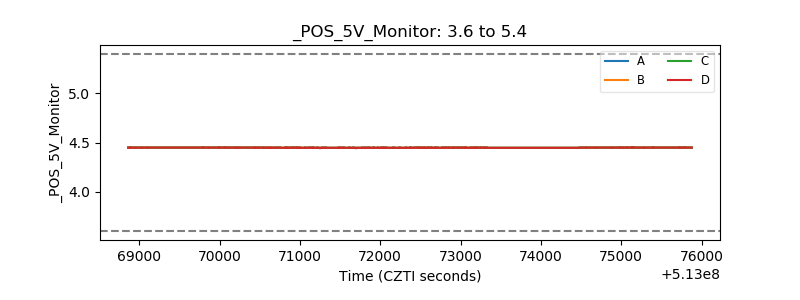 |
| _ROLL_ROT | 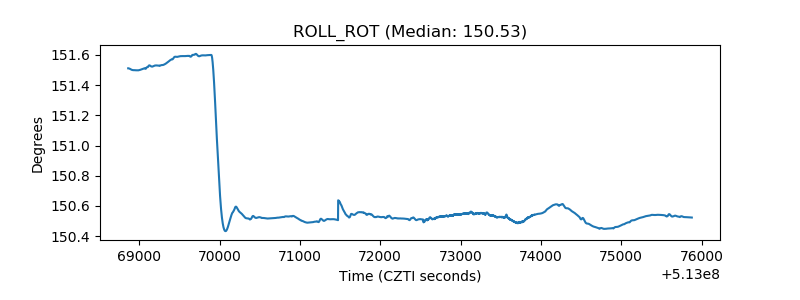 |
| _Roll_DEC | 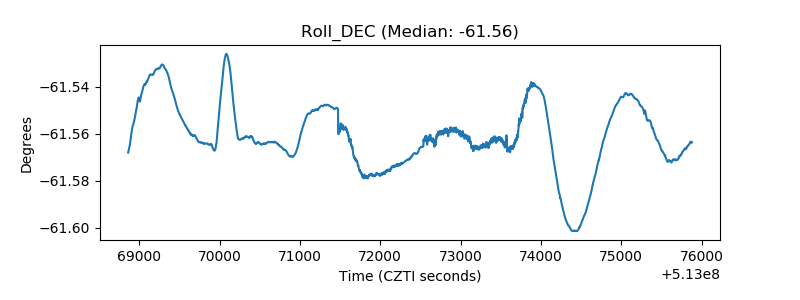 |
| _Roll_RA | 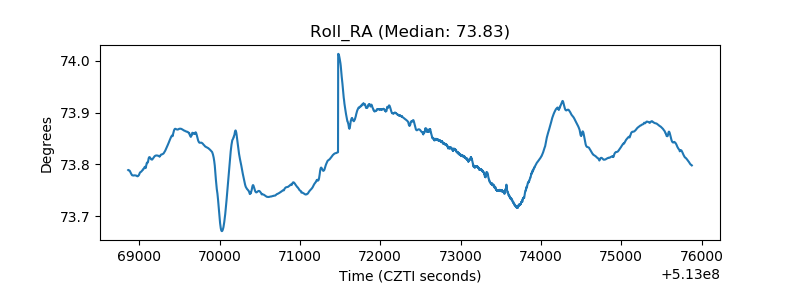 |
| Veto Counter | 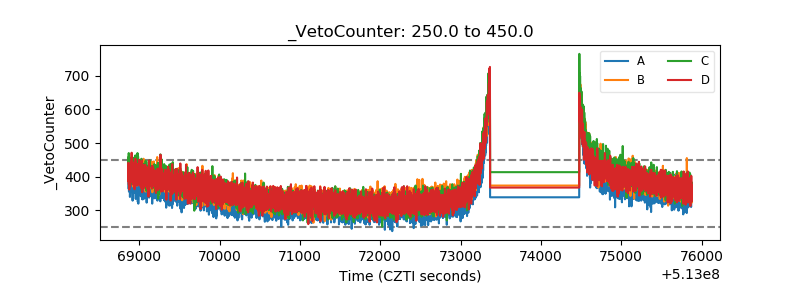 |