| Param | Original file | Final file |
|---|---|---|
| Filename | modeM0/AS1A14_083T14_9000006564_56915cztM0_level2.fits | modeM0/AS1A14_083T14_9000006564_56915cztM0_level2_quad_clean.evt |
| Size (bytes) | 781,784,640 | 93,582,720 |
| Size | 745.6 MB | 89.2 MB |
| Events in quadrant A | 8,476,812 | 505,594 |
| Events in quadrant B | 5,147,930 | 686,056 |
| Events in quadrant C | 8,803,911 | 608,539 |
| Events in quadrant D | 5,977,769 | 552,511 |
| Mode SS | |||
|---|---|---|---|
| Quadrant | BADHDUFLAG | Total packets | Discarded packets |
| A | 0 | 140 | 0 |
| B | 0 | 140 | 0 |
| C | 0 | 140 | 0 |
| D | 0 | 140 | 0 |
| Mode M9 | |||
|---|---|---|---|
| Quadrant | BADHDUFLAG | Total packets | Discarded packets |
| A | 0 | 11 | 0 |
| B | 0 | 11 | 0 |
| C | 0 | 11 | 0 |
| D | 0 | 11 | 0 |
| Mode M0 | |||
|---|---|---|---|
| Quadrant | BADHDUFLAG | Total packets | Discarded packets |
| A | 0 | 29959 | 7 |
| B | 0 | 20013 | 2 |
| C | 0 | 30978 | 2 |
| D | 0 | 22617 | 2 |
| Quadrant | Total seconds | Saturated seconds | Saturation percentage |
|---|---|---|---|
| A | 6898 | 1987 | 28.805451% |
| B | 6898 | 545 | 7.900841% |
| C | 6899 | 655 | 9.494130% |
| D | 6899 | 800 | 11.595883% |
Noise dominated data is calculated using 1-second bins in cleaned event files. If a bin has >2000 counts, and if more than 50% of those come from <1% of pixels, then it is considered to be noise-dominated and hence unusable.
| Quadrant | # 1 sec bins | Bins with >0 counts | Bins with >2000 counts | High rate bins dominated by noise | Noise dominated (total time) | Noise dominated (detector-on time) | Marked lightcurve |
|---|---|---|---|---|---|---|---|
| A | 7967 | 6898 | 1728 | 1728 | 21.69% | 25.05% | 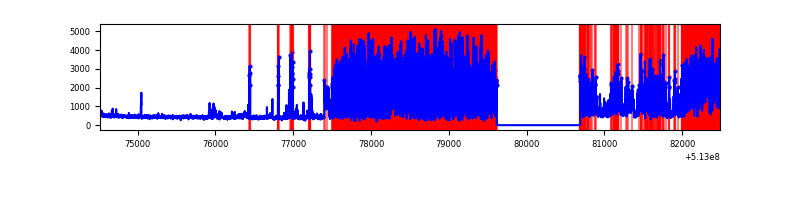 |
| B | 7968 | 6899 | 349 | 349 | 4.38% | 5.06% | 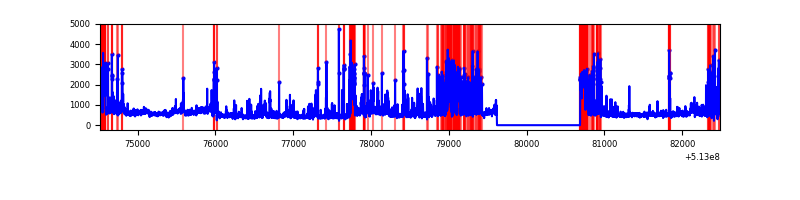 |
| C | 7969 | 6900 | 469 | 469 | 5.89% | 6.80% | 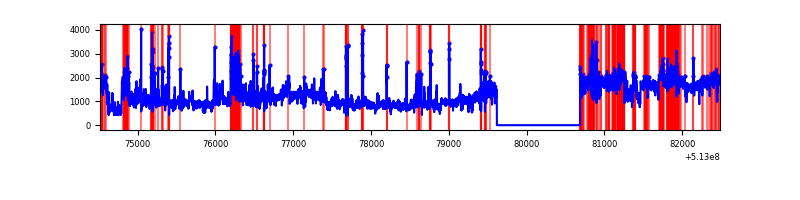 |
| D | 7968 | 6899 | 661 | 661 | 8.30% | 9.58% | 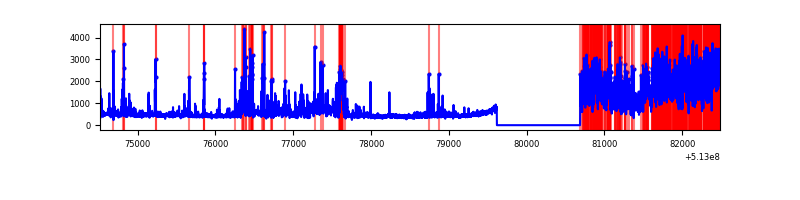 |
Top three noisy pixels from each quadrant. If the there are fewer than three noisy pixels in the level2.evt file, extra rows are filled as -1
| Pixel properties | Quadrant properties | ||||||
|---|---|---|---|---|---|---|---|
| Quadrant | DetID | PixID | Counts | Sigma | Mean | Median | Sigma |
| A | 7 | 64 | 5754282 | 36230.76 | 633 | 616 | 158.8 |
| A | 12 | 15 | 96578 | 604.27 | 633 | 616 | 158.8 |
| A | 3 | 62 | 75548 | 471.84 | 633 | 616 | 158.8 |
| B | 5 | 185 | 1101119 | 7456.06 | 703 | 678 | 147.6 |
| B | 10 | 16 | 474244 | 3208.66 | 703 | 678 | 147.6 |
| B | 5 | 172 | 459669 | 3109.9 | 703 | 678 | 147.6 |
| C | 9 | 38 | 5303284 | 27570.43 | 698 | 690 | 192.3 |
| C | 13 | 3 | 438139 | 2274.48 | 698 | 690 | 192.3 |
| C | 14 | 254 | 75582 | 389.4 | 698 | 690 | 192.3 |
| D | 12 | 33 | 2209364 | 11174.18 | 695 | 660 | 197.7 |
| D | 2 | 249 | 256023 | 1291.92 | 695 | 660 | 197.7 |
| D | 0 | 160 | 217924 | 1099.17 | 695 | 660 | 197.7 |
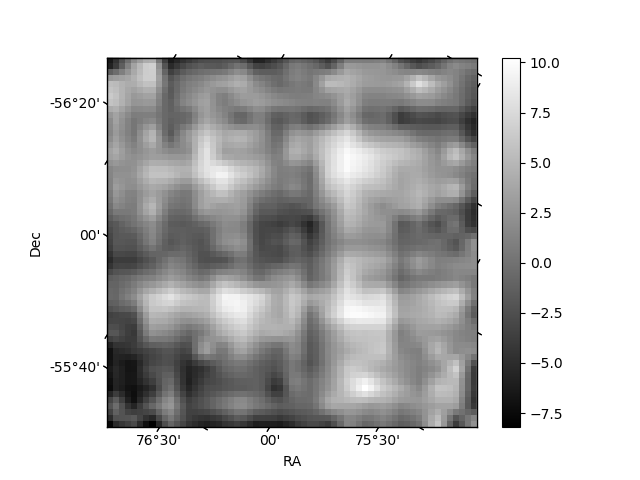
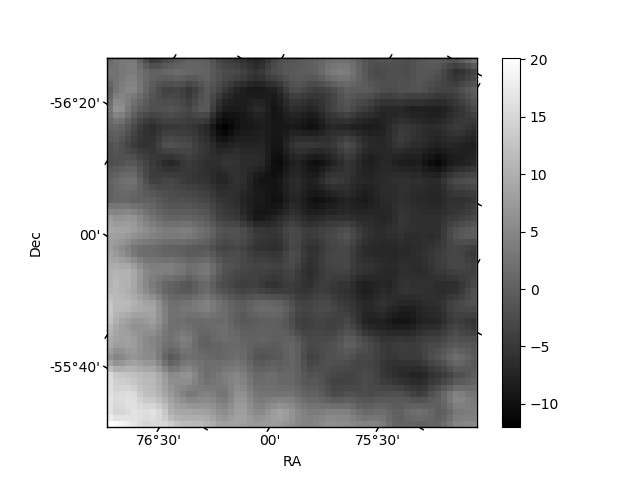
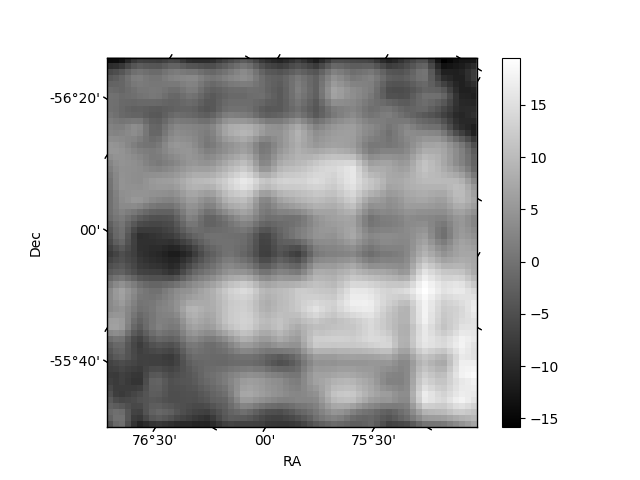
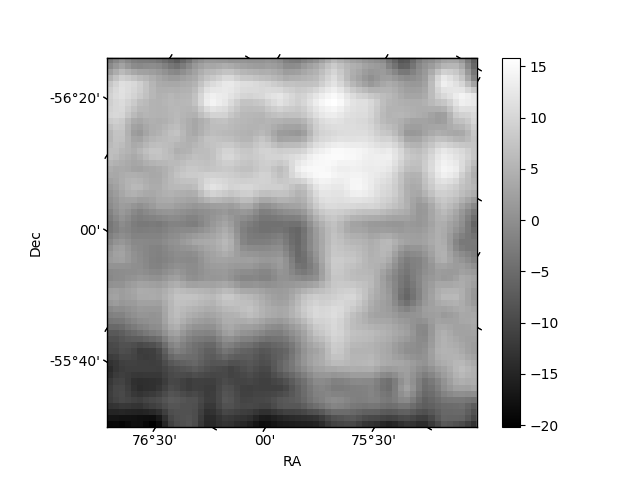
Histogram calculated using DETX and DETY for each event in the final _common_clean file
| Quadrant A | 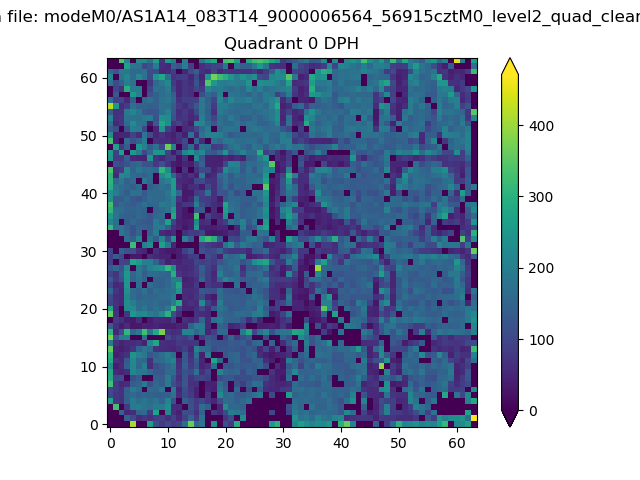 |
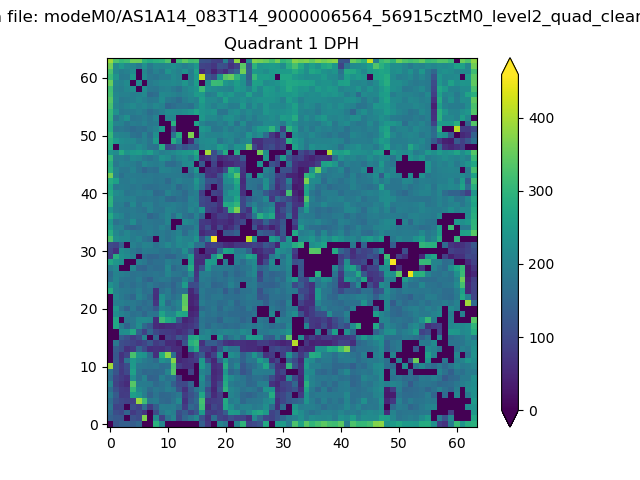 |
Quadrant B |
|---|---|---|---|
| Quadrant D | 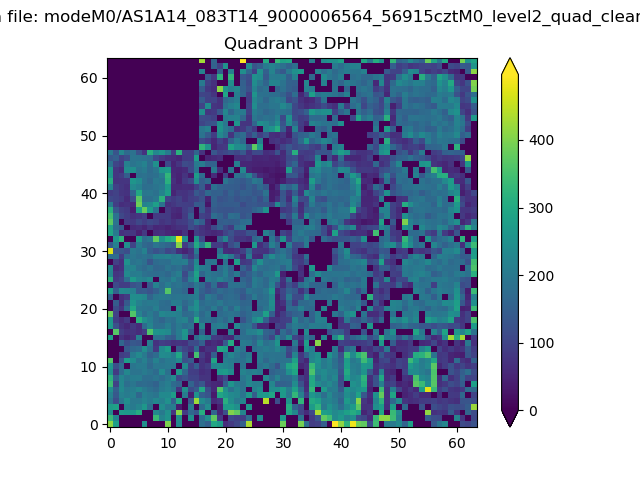 |
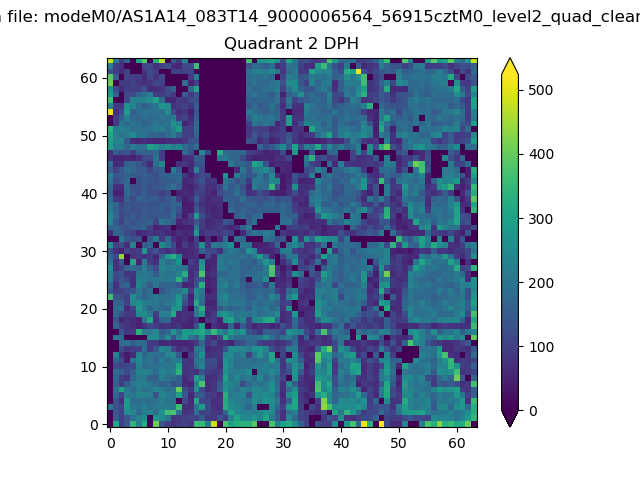 |
Quadrant C |
| Plot type | Count rate plots | Images |
|---|---|---|
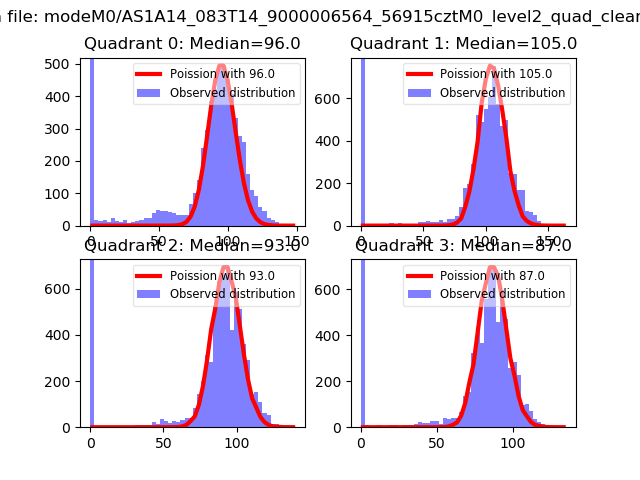
| Comparison with Poisson distribution Blue bars denote a histogram of data divided into 1 sec bins. Red curve is a Poisson curve with rate = median count rate of data. |
 |
 |
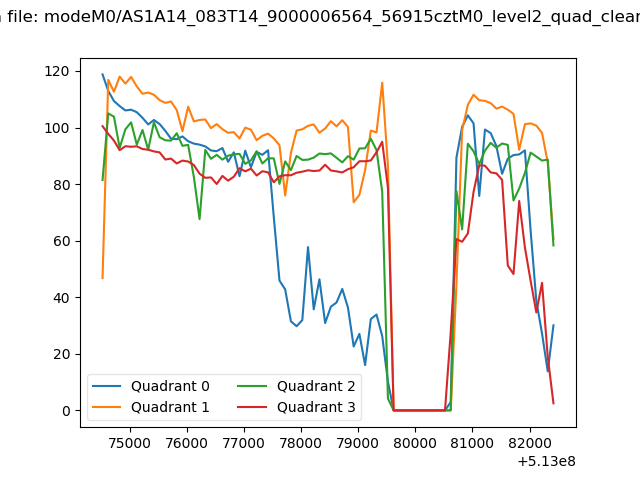
| Quadrant-wise count rates Data is divided into 100 sec bins |
 |
|
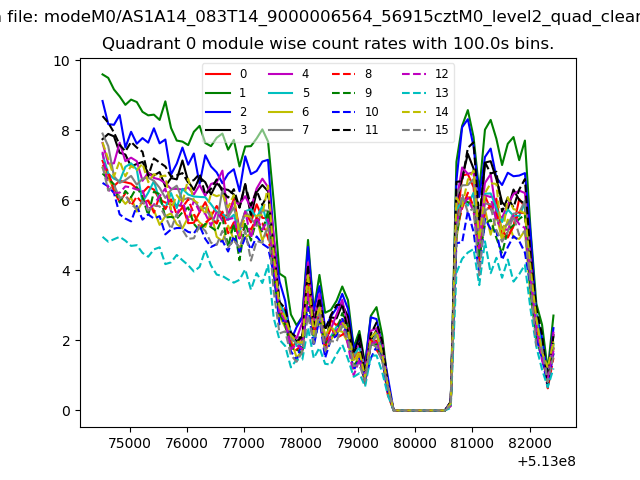
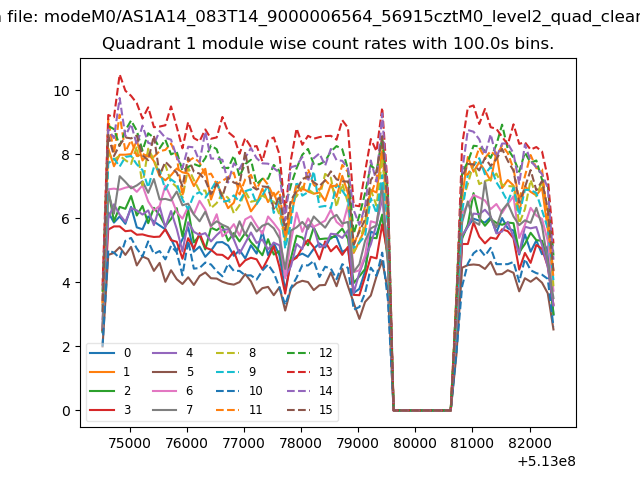
| Module-wise count rates for Quadrant A Data is divided into 100 sec bins |
 |
 |
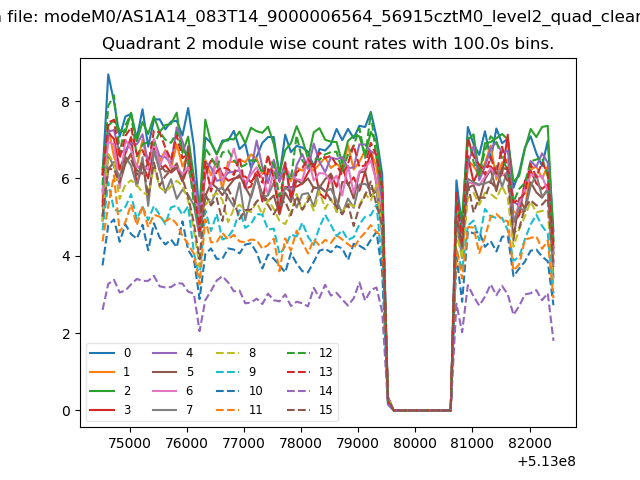
| Module-wise count rates for Quadrant B Data is divided into 100 sec bins |
 |
 |
| Module-wise count rates for Quadrant C Data is divided into 100 sec bins |
 |
 |
| Module-wise count rates for Quadrant D Data is divided into 100 sec bins |
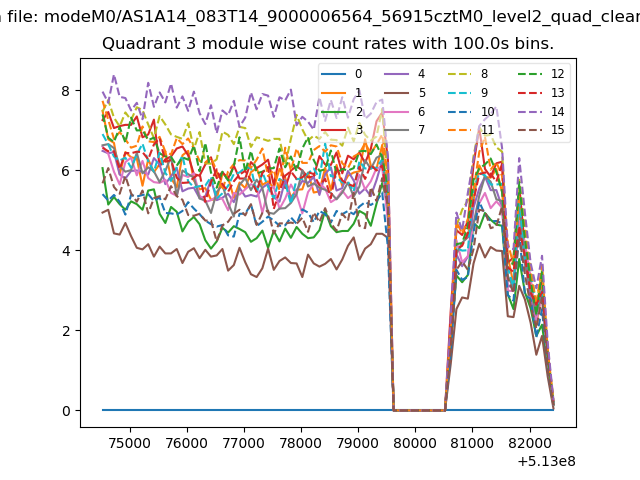 |
 |
| Parameter | Plot |
|---|---|
| CZT HV Monitor | 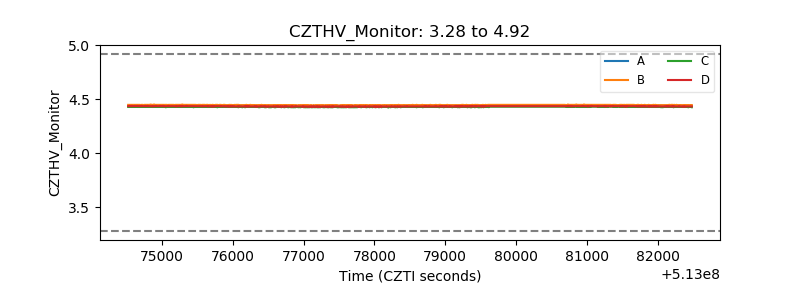 |
| D_VDD | 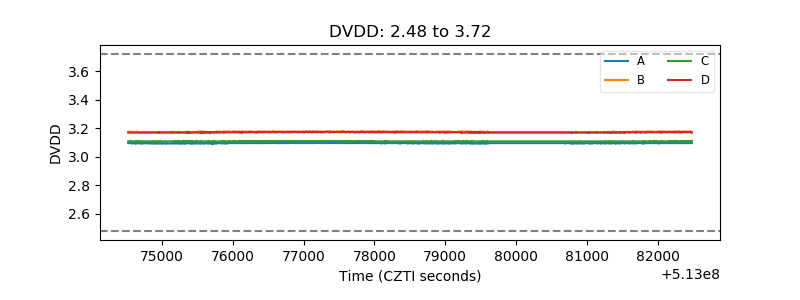 |
| Temperature 1 | 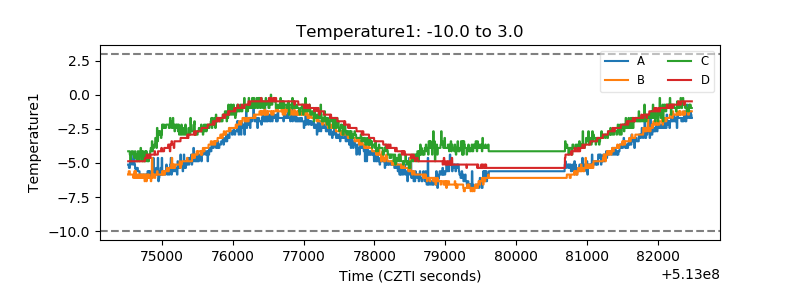 |
| Veto HV Monitor | 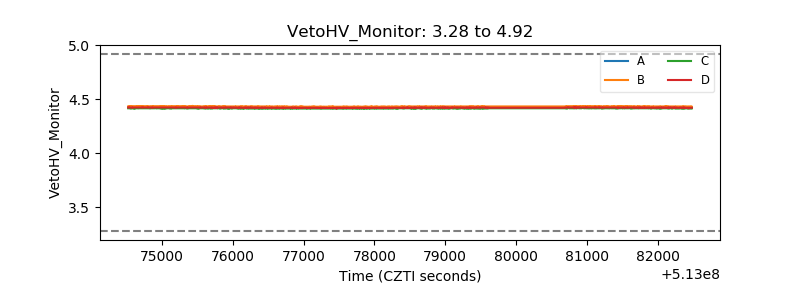 |
| Veto LLD | 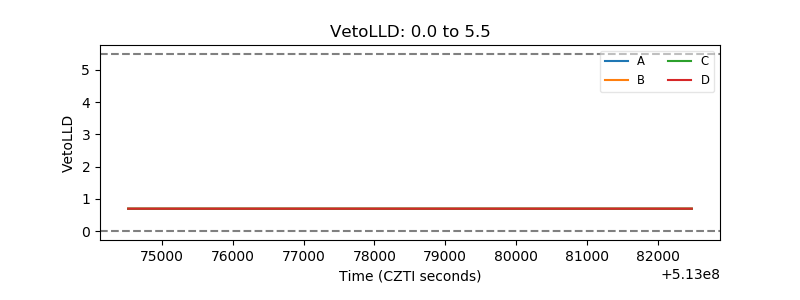 |
| Alpha Counter | 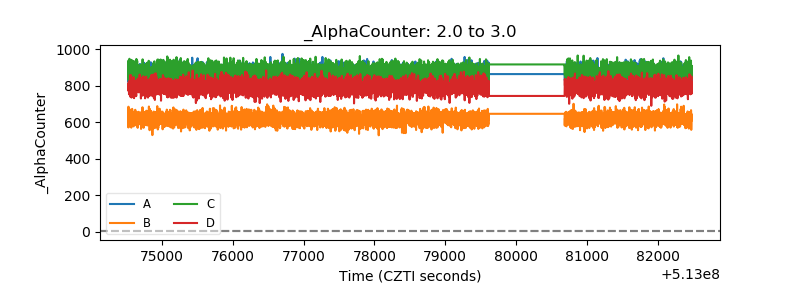 |
| _CPM_Rate | 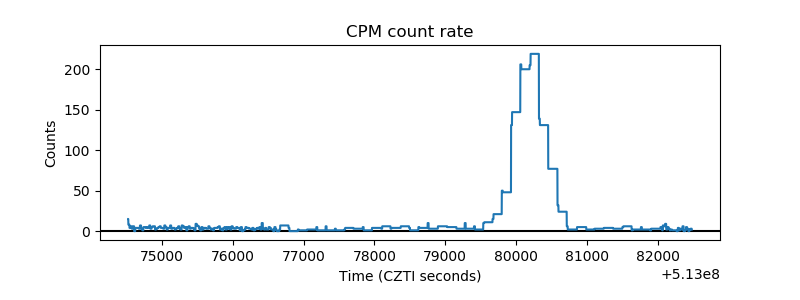 |
| CZT Counter | 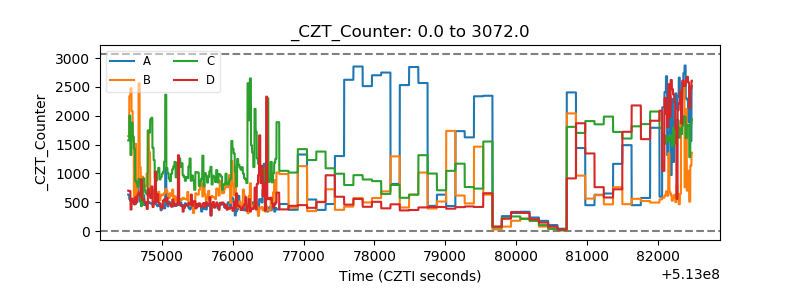 |
| +2.5 Volts monitor |  |
| +5 Volts monitor |  |
| _ROLL_ROT | 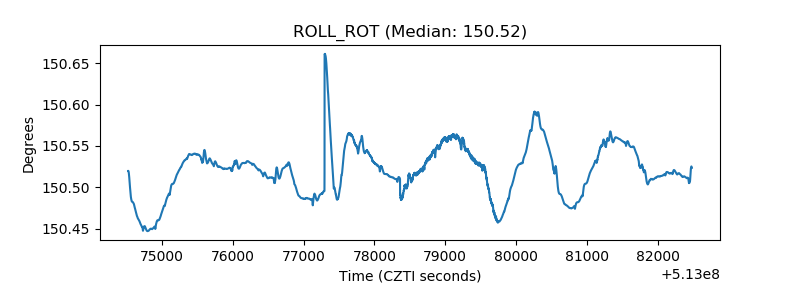 |
| _Roll_DEC | 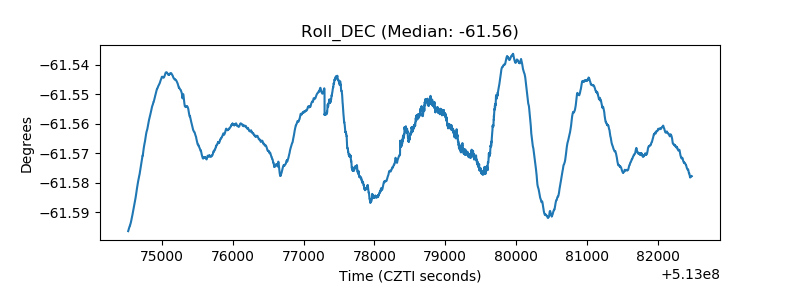 |
| _Roll_RA | 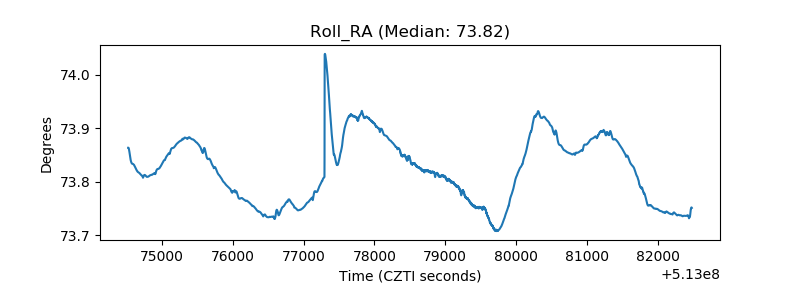 |
| Veto Counter | 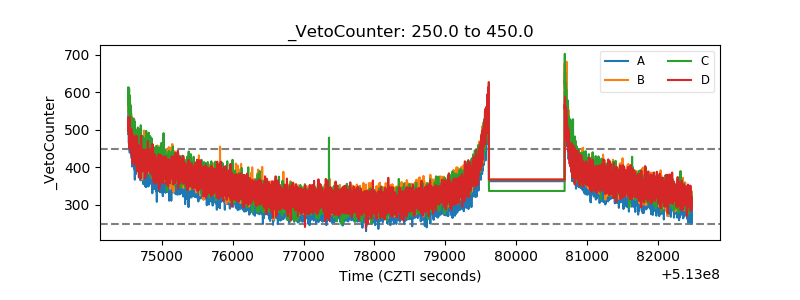 |