| Param | Original file | Final file |
|---|---|---|
| Filename | modeM0/AS1A14_083T14_9000006564_56916cztM0_level2.fits | modeM0/AS1A14_083T14_9000006564_56916cztM0_level2_quad_clean.evt |
| Size (bytes) | 1,024,562,880 | 68,146,560 |
| Size | 977.1 MB | 65.0 MB |
| Events in quadrant A | 9,214,457 | 389,102 |
| Events in quadrant B | 5,654,187 | 570,805 |
| Events in quadrant C | 11,032,167 | 425,858 |
| Events in quadrant D | 11,550,568 | 246,628 |
| Mode SS | |||
|---|---|---|---|
| Quadrant | BADHDUFLAG | Total packets | Discarded packets |
| A | 0 | 124 | 0 |
| B | 0 | 124 | 0 |
| C | 0 | 124 | 0 |
| D | 0 | 124 | 0 |
| Mode M9 | |||
|---|---|---|---|
| Quadrant | BADHDUFLAG | Total packets | Discarded packets |
| A | 0 | 9 | 0 |
| B | 0 | 9 | 0 |
| C | 0 | 9 | 0 |
| D | 0 | 9 | 0 |
| Mode M0 | |||
|---|---|---|---|
| Quadrant | BADHDUFLAG | Total packets | Discarded packets |
| A | 0 | 31548 | 1 |
| B | 0 | 21104 | 1 |
| C | 0 | 37021 | 1 |
| D | 0 | 38594 | 1 |
| Quadrant | Total seconds | Saturated seconds | Saturation percentage |
|---|---|---|---|
| A | 6171 | 2385 | 38.648517% |
| B | 6171 | 711 | 11.521633% |
| C | 6172 | 1823 | 29.536617% |
| D | 6172 | 3648 | 59.105638% |
Noise dominated data is calculated using 1-second bins in cleaned event files. If a bin has >2000 counts, and if more than 50% of those come from <1% of pixels, then it is considered to be noise-dominated and hence unusable.
| Quadrant | # 1 sec bins | Bins with >0 counts | Bins with >2000 counts | High rate bins dominated by noise | Noise dominated (total time) | Noise dominated (detector-on time) | Marked lightcurve |
|---|---|---|---|---|---|---|---|
| A | 7001 | 6172 | 2101 | 2101 | 30.01% | 34.04% | 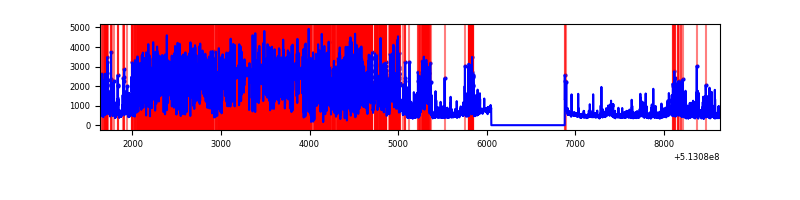 |
| B | 7001 | 6172 | 488 | 488 | 6.97% | 7.91% | 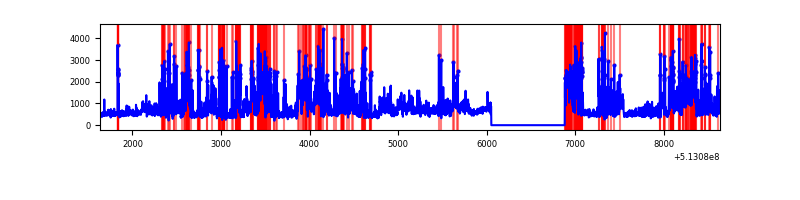 |
| C | 7002 | 6173 | 2159 | 2159 | 30.83% | 34.97% | 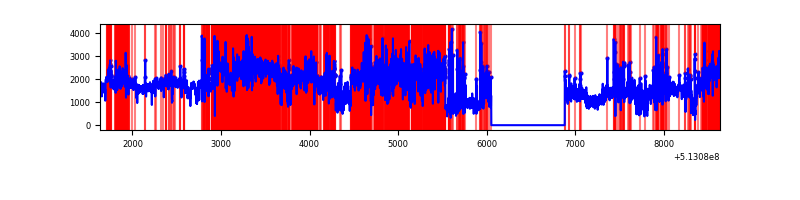 |
| D | 7002 | 6173 | 2791 | 2791 | 39.86% | 45.21% | 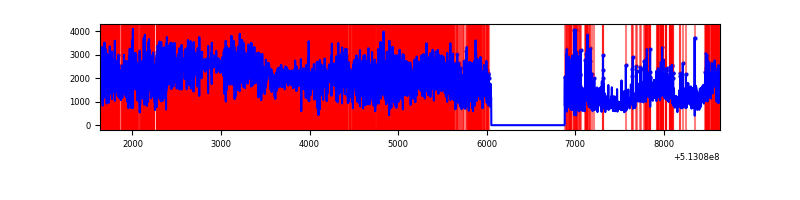 |
Top three noisy pixels from each quadrant. If the there are fewer than three noisy pixels in the level2.evt file, extra rows are filled as -1
| Pixel properties | Quadrant properties | ||||||
|---|---|---|---|---|---|---|---|
| Quadrant | DetID | PixID | Counts | Sigma | Mean | Median | Sigma |
| A | 7 | 64 | 6785621 | 51041.17 | 535 | 521 | 132.9 |
| A | 12 | 15 | 283530 | 2128.95 | 535 | 521 | 132.9 |
| A | 10 | 251 | 39394 | 292.42 | 535 | 521 | 132.9 |
| B | 5 | 185 | 1387672 | 10807.67 | 600 | 577 | 128.3 |
| B | 5 | 172 | 1326810 | 10333.46 | 600 | 577 | 128.3 |
| B | 10 | 16 | 290210 | 2256.7 | 600 | 577 | 128.3 |
| C | 9 | 38 | 7512893 | 47597.3 | 571 | 564 | 157.8 |
| C | 13 | 3 | 1030450 | 6525.25 | 571 | 564 | 157.8 |
| C | 14 | 254 | 103689 | 653.39 | 571 | 564 | 157.8 |
| D | 12 | 33 | 8289877 | 63053.88 | 462 | 440 | 131.5 |
| D | 2 | 249 | 920387 | 6997.61 | 462 | 440 | 131.5 |
| D | 8 | 240 | 127492 | 966.43 | 462 | 440 | 131.5 |
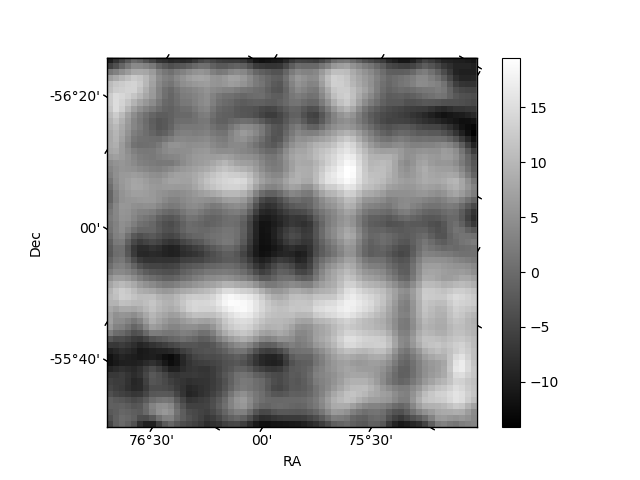
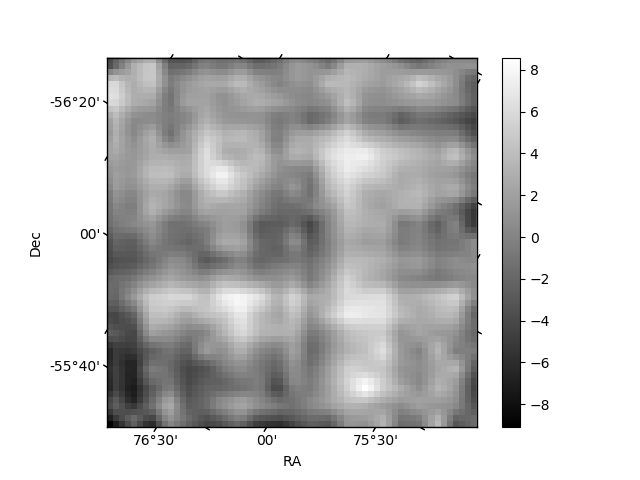
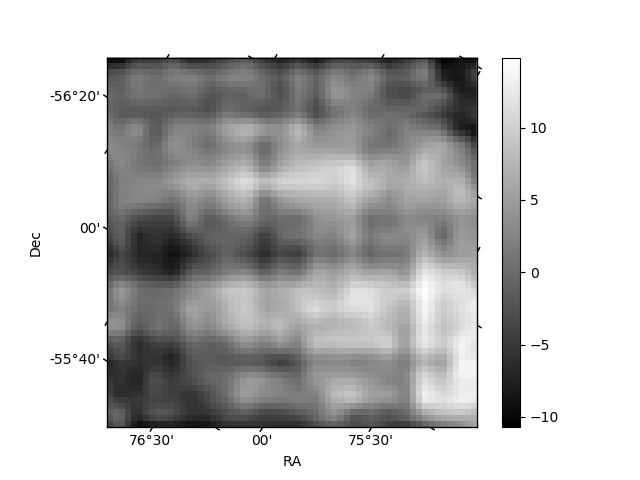
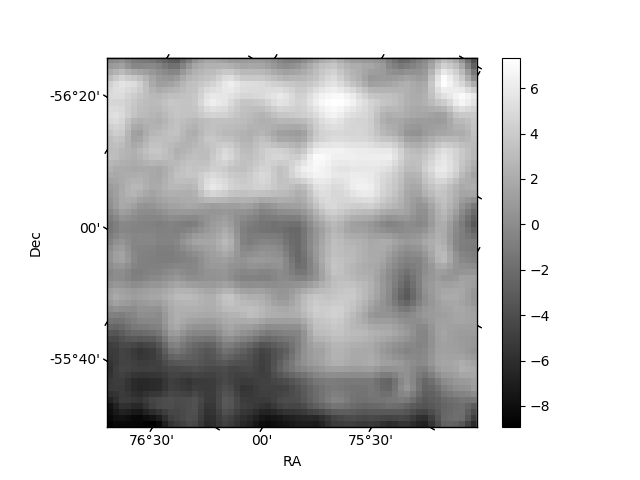
Histogram calculated using DETX and DETY for each event in the final _common_clean file
| Quadrant A | 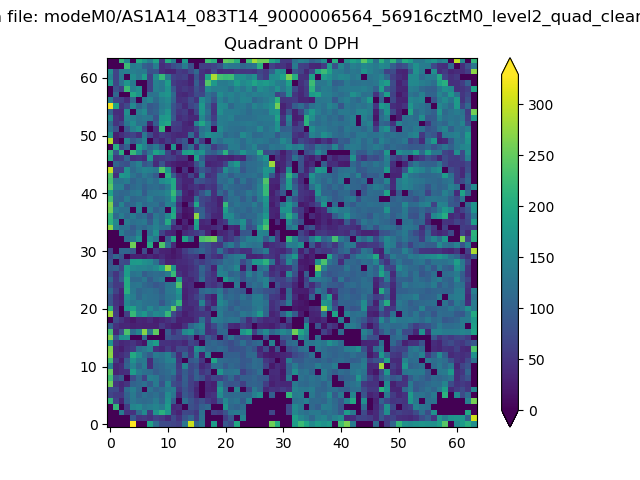 |
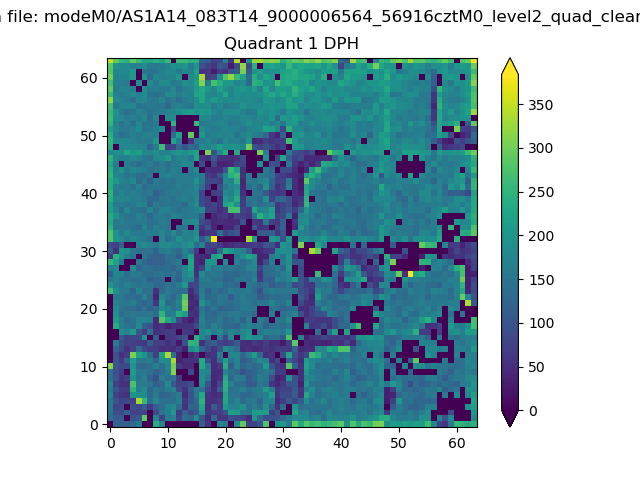 |
Quadrant B |
|---|---|---|---|
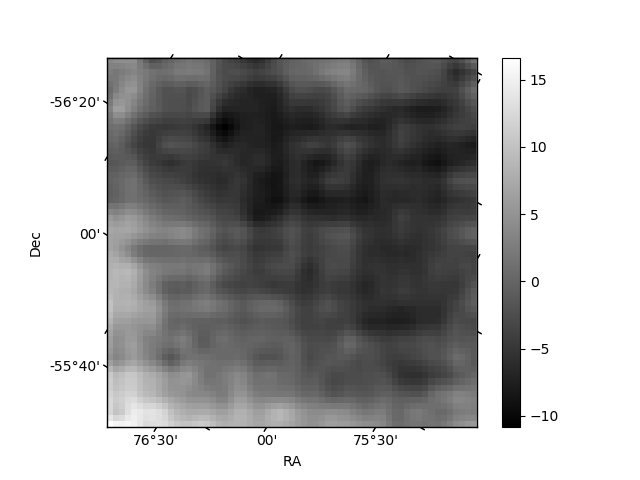
| Quadrant D | 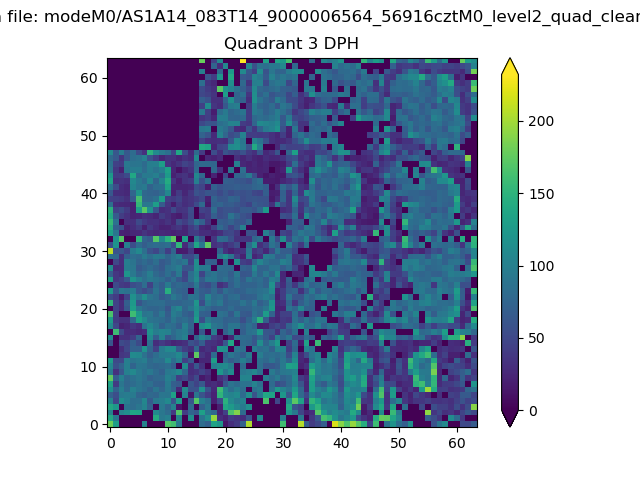 |
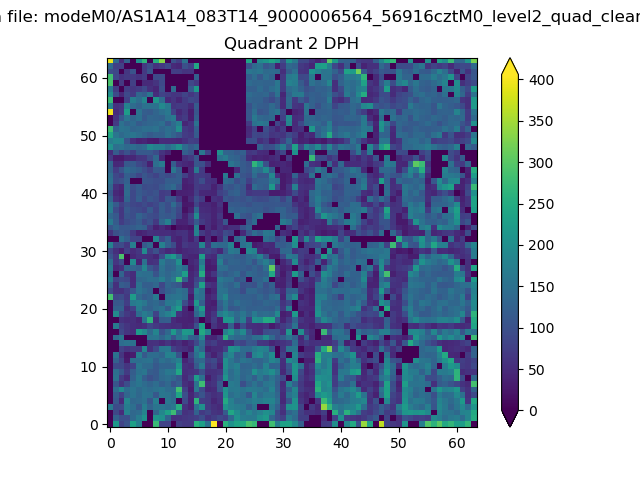 |
Quadrant C |
| Plot type | Count rate plots | Images |
|---|---|---|
| Comparison with Poisson distribution Blue bars denote a histogram of data divided into 1 sec bins. Red curve is a Poisson curve with rate = median count rate of data. |
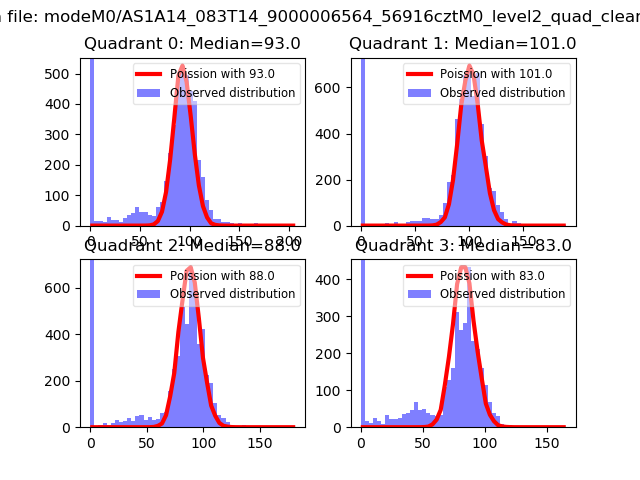 |
 |
| Quadrant-wise count rates Data is divided into 100 sec bins |
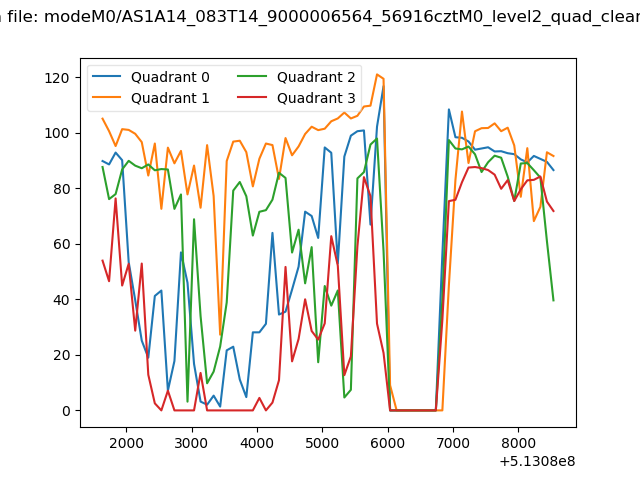 |
|
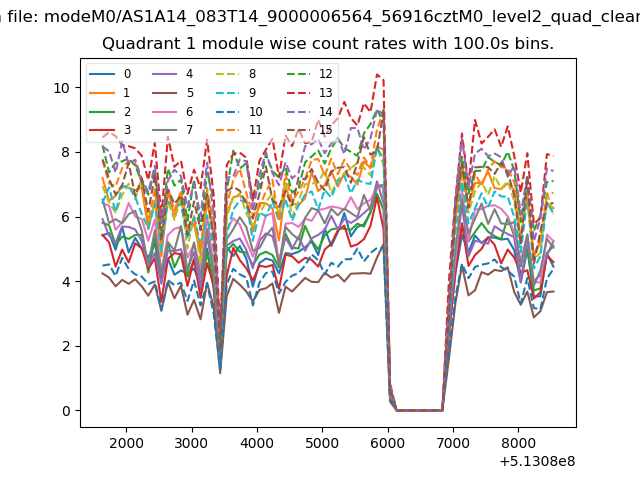
| Module-wise count rates for Quadrant A Data is divided into 100 sec bins |
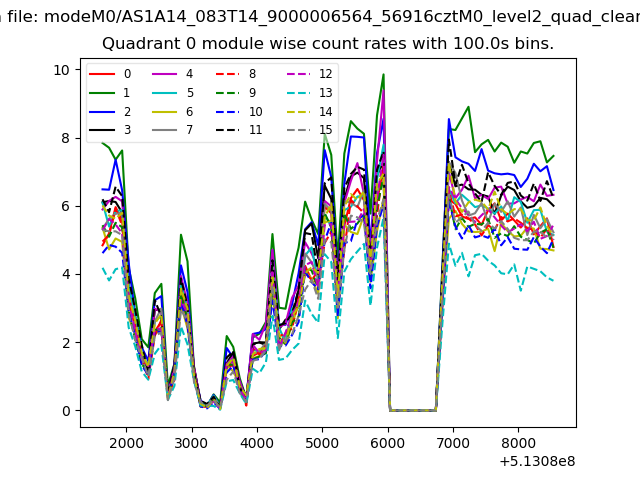 |
 |
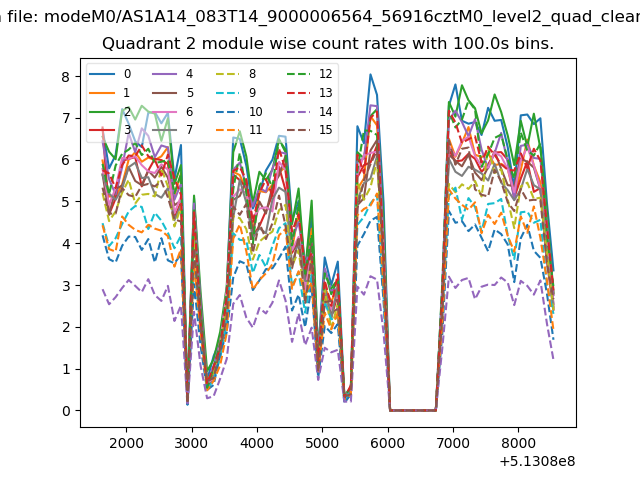
| Module-wise count rates for Quadrant B Data is divided into 100 sec bins |
 |
 |
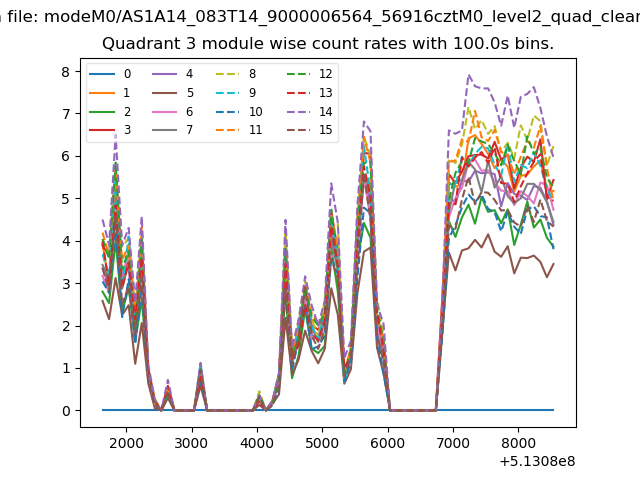
| Module-wise count rates for Quadrant C Data is divided into 100 sec bins |
 |
 |
| Module-wise count rates for Quadrant D Data is divided into 100 sec bins |
 |
 |
| Parameter | Plot |
|---|---|
| CZT HV Monitor | 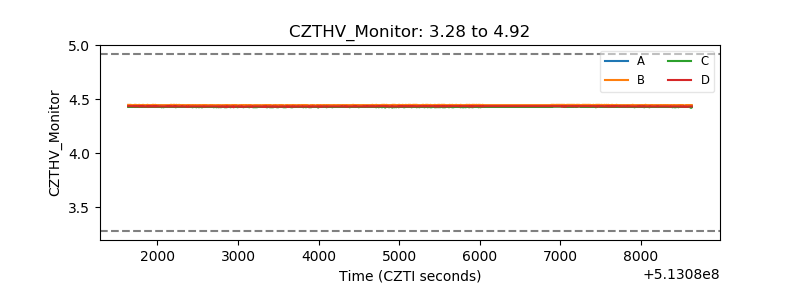 |
| D_VDD | 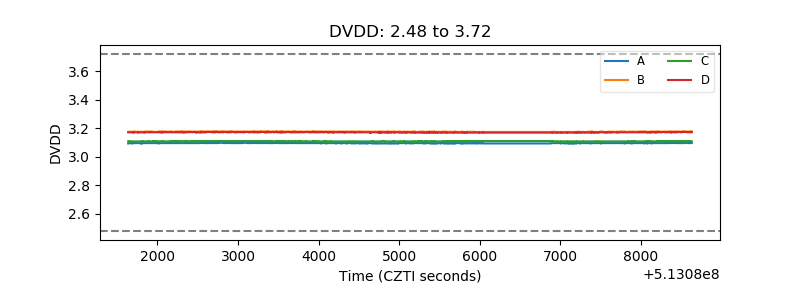 |
| Temperature 1 | 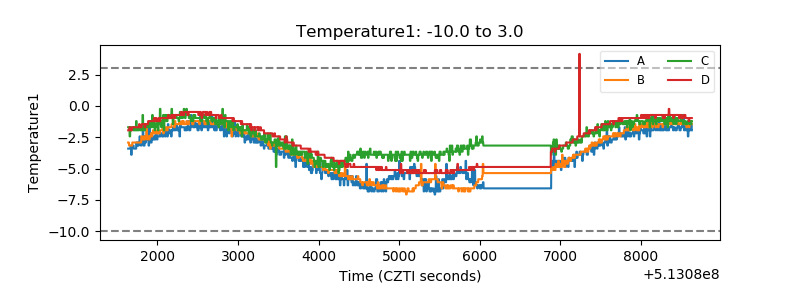 |
| Veto HV Monitor | 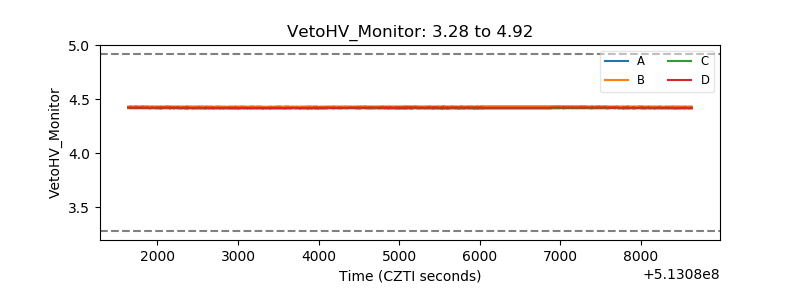 |
| Veto LLD | 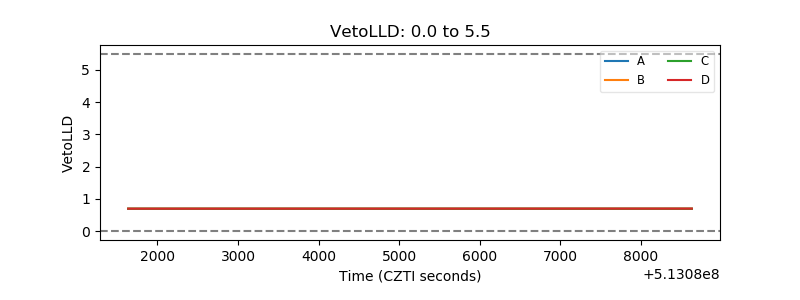 |
| Alpha Counter | 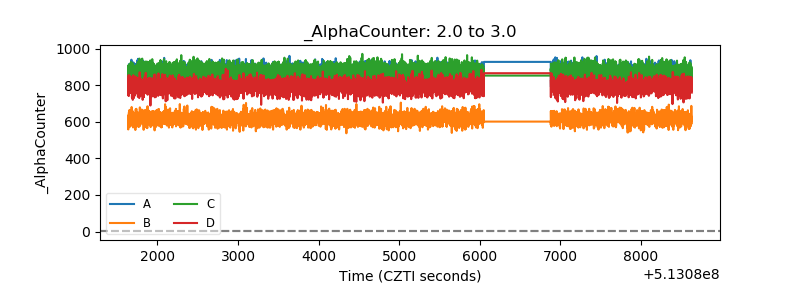 |
| _CPM_Rate | 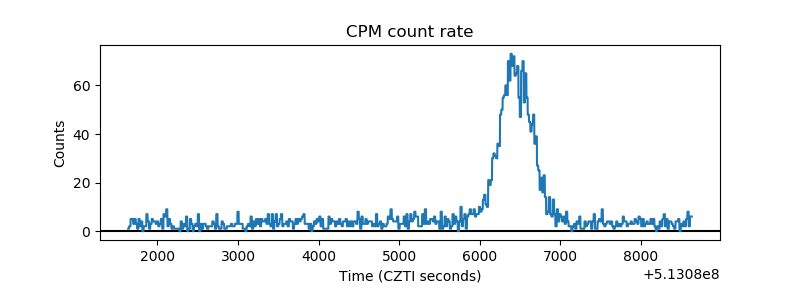 |
| CZT Counter | 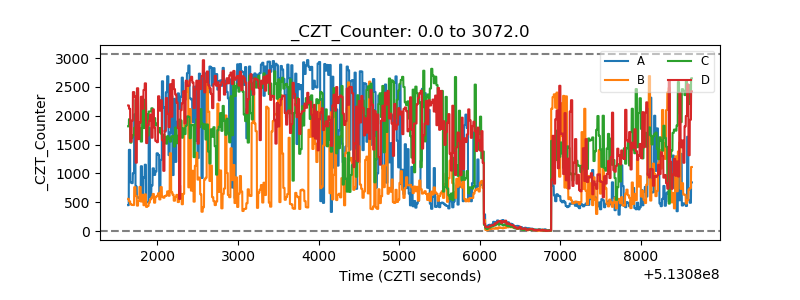 |
| +2.5 Volts monitor |  |
| +5 Volts monitor |  |
| _ROLL_ROT | 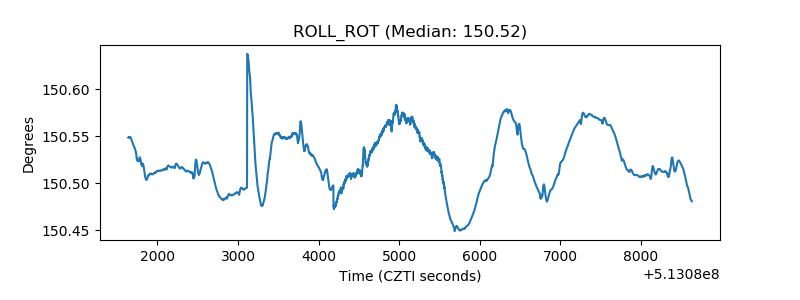 |
| _Roll_DEC | 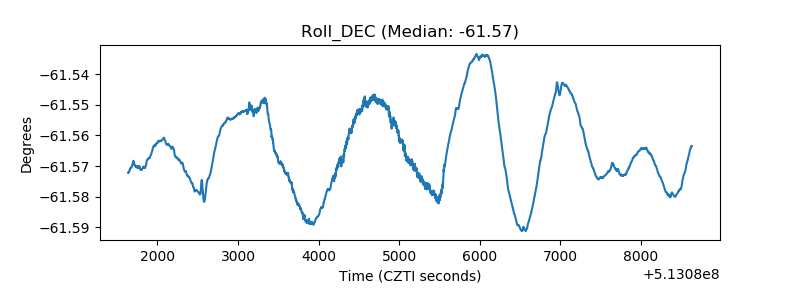 |
| _Roll_RA | 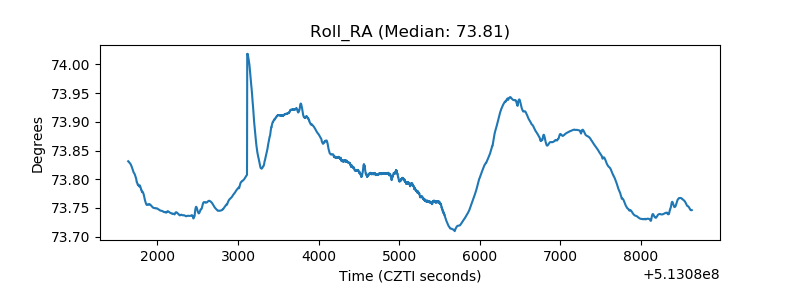 |
| Veto Counter | 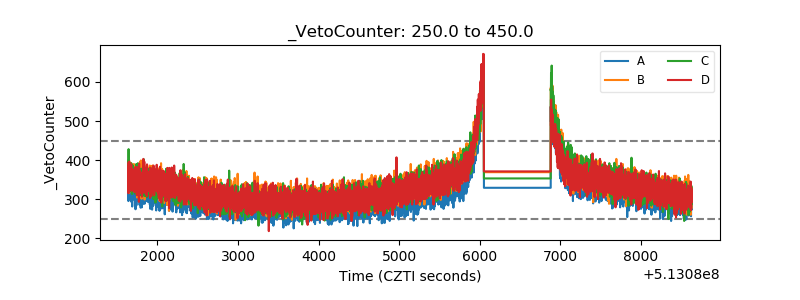 |