| Param | Original file | Final file |
|---|---|---|
| Filename | modeM0/AS1A14_083T14_9000006564_56917cztM0_level2.fits | modeM0/AS1A14_083T14_9000006564_56917cztM0_level2_quad_clean.evt |
| Size (bytes) | 1,050,056,640 | 78,491,520 |
| Size | 1001.4 MB | 74.9 MB |
| Events in quadrant A | 4,652,669 | 634,040 |
| Events in quadrant B | 5,924,637 | 636,375 |
| Events in quadrant C | 13,088,697 | 479,053 |
| Events in quadrant D | 14,671,876 | 145,966 |
| Mode SS | |||
|---|---|---|---|
| Quadrant | BADHDUFLAG | Total packets | Discarded packets |
| A | 0 | 140 | 0 |
| B | 0 | 140 | 0 |
| C | 0 | 140 | 0 |
| D | 0 | 140 | 0 |
| Mode M9 | |||
|---|---|---|---|
| Quadrant | BADHDUFLAG | Total packets | Discarded packets |
| A | 0 | 1 | 0 |
| B | 0 | 1 | 0 |
| C | 0 | 1 | 0 |
| D | 0 | 1 | 0 |
| Mode M0 | |||
|---|---|---|---|
| Quadrant | BADHDUFLAG | Total packets | Discarded packets |
| A | 0 | 18644 | 2 |
| B | 0 | 22283 | 2 |
| C | 0 | 43622 | 2 |
| D | 0 | 48342 | 4 |
| Quadrant | Total seconds | Saturated seconds | Saturation percentage |
|---|---|---|---|
| A | 6898 | 285 | 4.131632% |
| B | 6899 | 741 | 10.740687% |
| C | 6899 | 2140 | 31.018988% |
| D | 6898 | 5389 | 78.124094% |
Noise dominated data is calculated using 1-second bins in cleaned event files. If a bin has >2000 counts, and if more than 50% of those come from <1% of pixels, then it is considered to be noise-dominated and hence unusable.
| Quadrant | # 1 sec bins | Bins with >0 counts | Bins with >2000 counts | High rate bins dominated by noise | Noise dominated (total time) | Noise dominated (detector-on time) | Marked lightcurve |
|---|---|---|---|---|---|---|---|
| A | 7053 | 6901 | 175 | 175 | 2.48% | 2.54% | 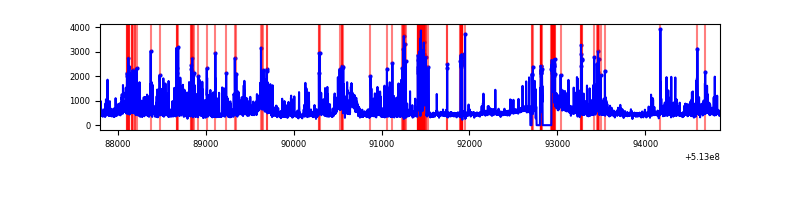 |
| B | 7054 | 6900 | 464 | 464 | 6.58% | 6.72% | 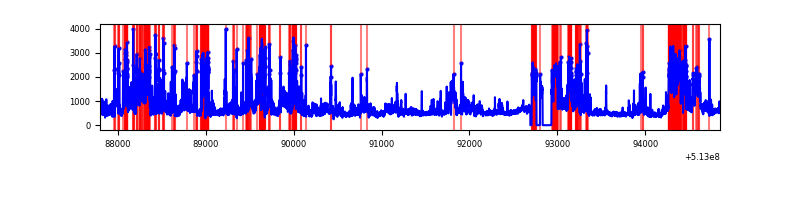 |
| C | 7054 | 6902 | 2562 | 2562 | 36.32% | 37.12% | 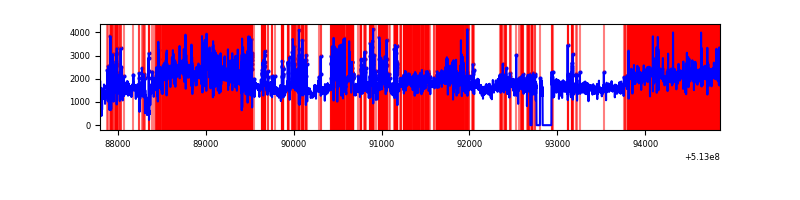 |
| D | 7052 | 6897 | 4410 | 4410 | 62.54% | 63.94% | 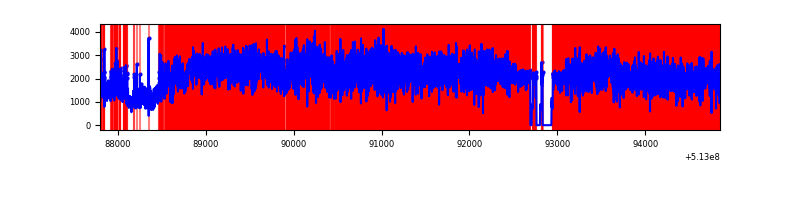 |
Top three noisy pixels from each quadrant. If the there are fewer than three noisy pixels in the level2.evt file, extra rows are filled as -1
| Pixel properties | Quadrant properties | ||||||
|---|---|---|---|---|---|---|---|
| Quadrant | DetID | PixID | Counts | Sigma | Mean | Median | Sigma |
| A | 7 | 64 | 1355177 | 7627.26 | 717 | 699 | 177.6 |
| A | 4 | 249 | 216378 | 1214.52 | 717 | 699 | 177.6 |
| A | 10 | 251 | 176722 | 991.21 | 717 | 699 | 177.6 |
| B | 5 | 172 | 1161914 | 7933.62 | 680 | 654 | 146.4 |
| B | 5 | 185 | 1103362 | 7533.6 | 680 | 654 | 146.4 |
| B | 10 | 16 | 509223 | 3474.5 | 680 | 654 | 146.4 |
| C | 9 | 38 | 9102705 | 51242.95 | 649 | 644 | 177.6 |
| C | 13 | 3 | 1176227 | 6618.32 | 649 | 644 | 177.6 |
| C | 14 | 254 | 174660 | 979.68 | 649 | 644 | 177.6 |
| D | 12 | 33 | 11135449 | 85225.06 | 451 | 430 | 130.7 |
| D | 2 | 249 | 821079 | 6281.07 | 451 | 430 | 130.7 |
| D | 5 | 222 | 358042 | 2737.09 | 451 | 430 | 130.7 |
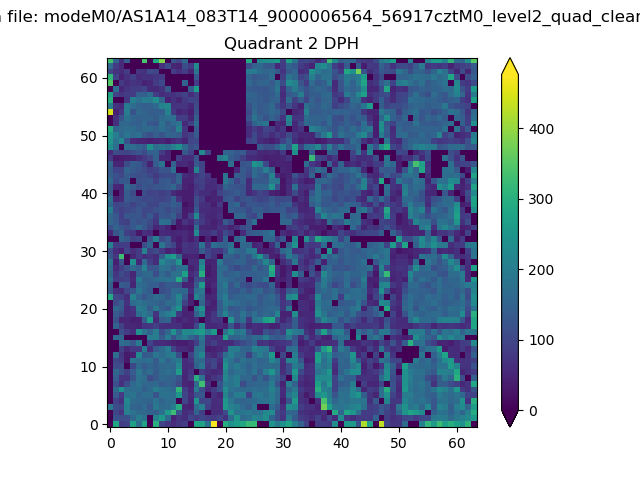
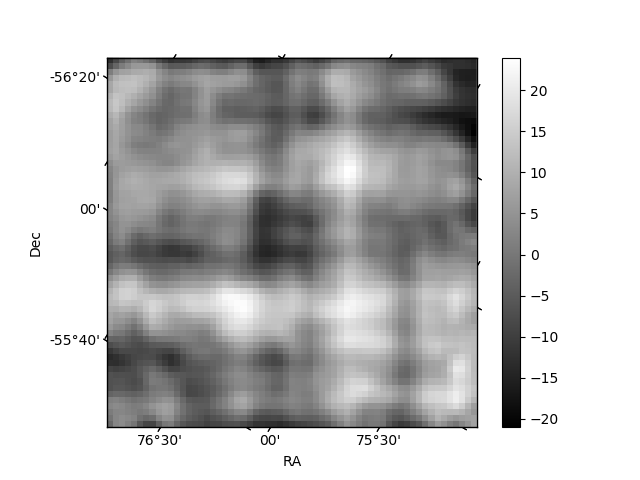
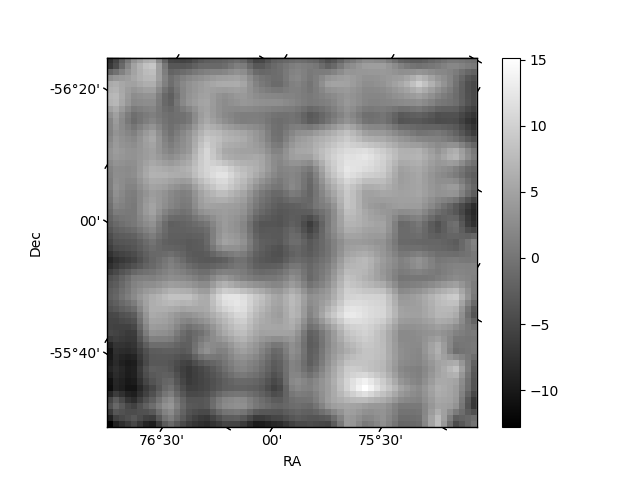
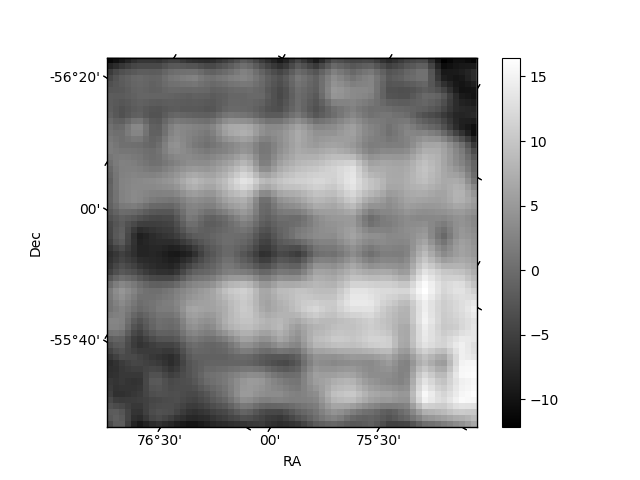
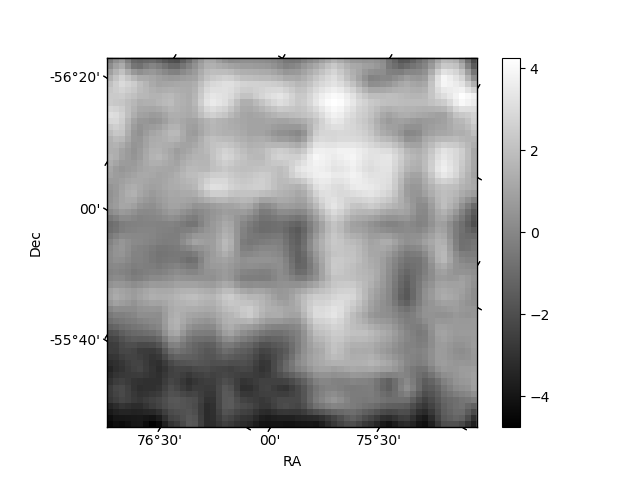
Histogram calculated using DETX and DETY for each event in the final _common_clean file
| Quadrant A | 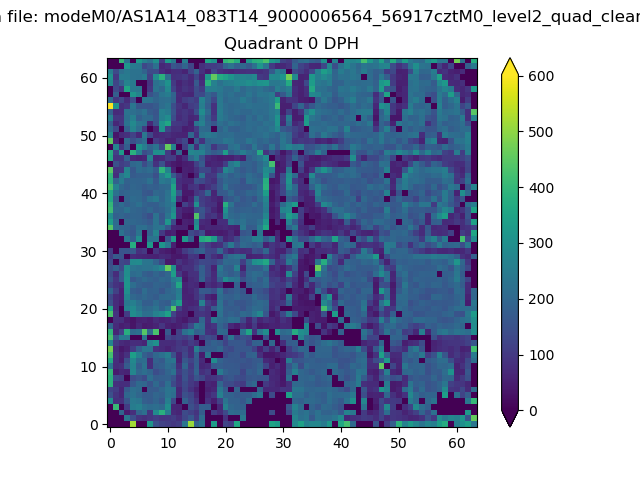 |
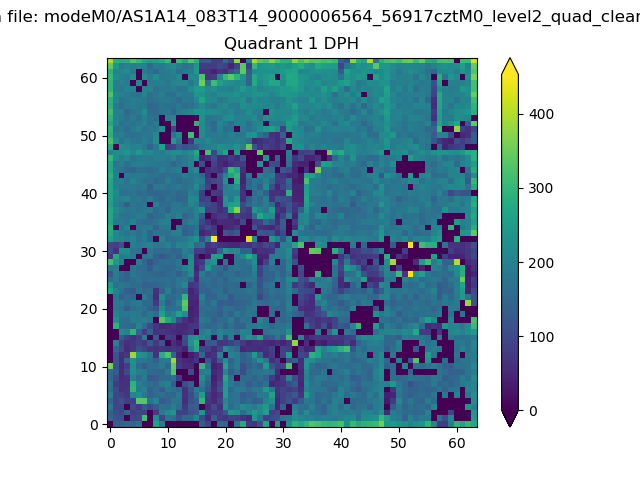 |
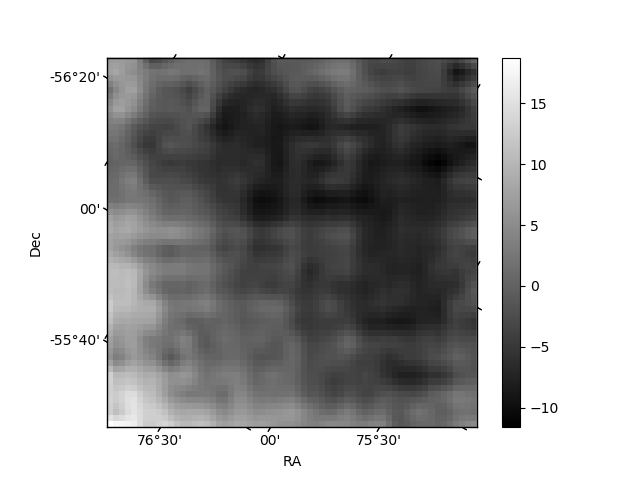
Quadrant B |
|---|---|---|---|
| Quadrant D | 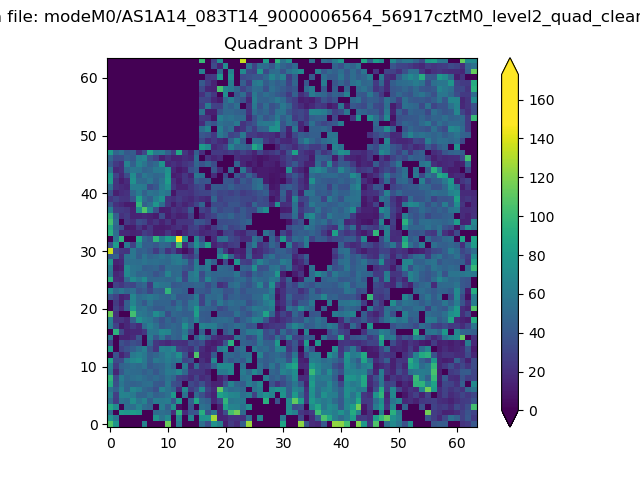 |
 |
Quadrant C |
| Plot type | Count rate plots | Images |
|---|---|---|
| Comparison with Poisson distribution Blue bars denote a histogram of data divided into 1 sec bins. Red curve is a Poisson curve with rate = median count rate of data. |
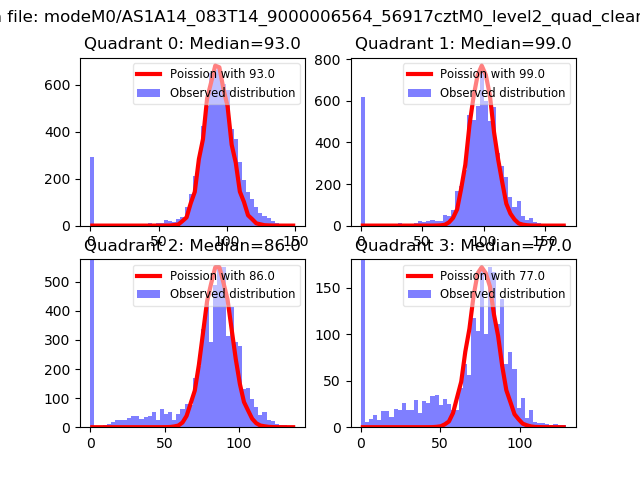 |
 |
| Quadrant-wise count rates Data is divided into 100 sec bins |
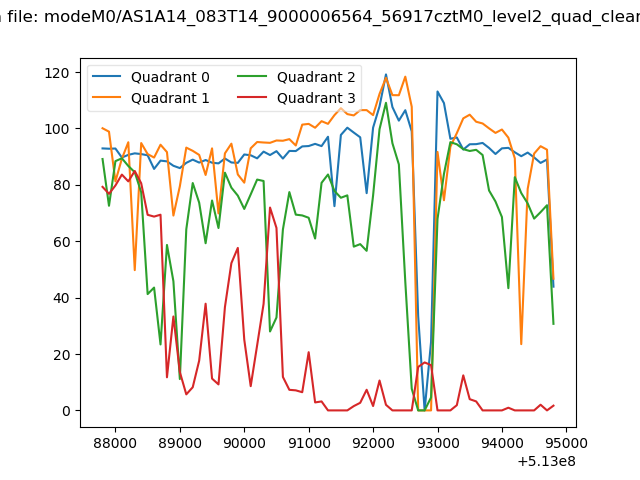 |
|
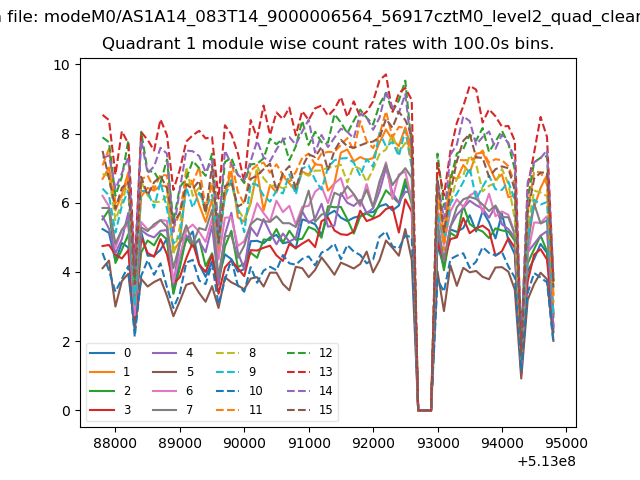
| Module-wise count rates for Quadrant A Data is divided into 100 sec bins |
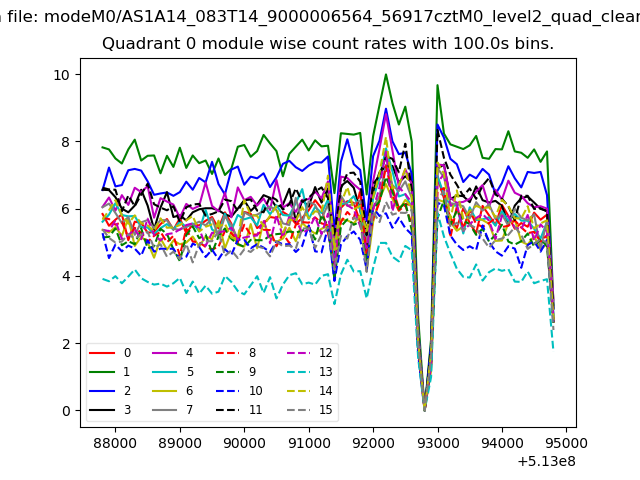 |
 |
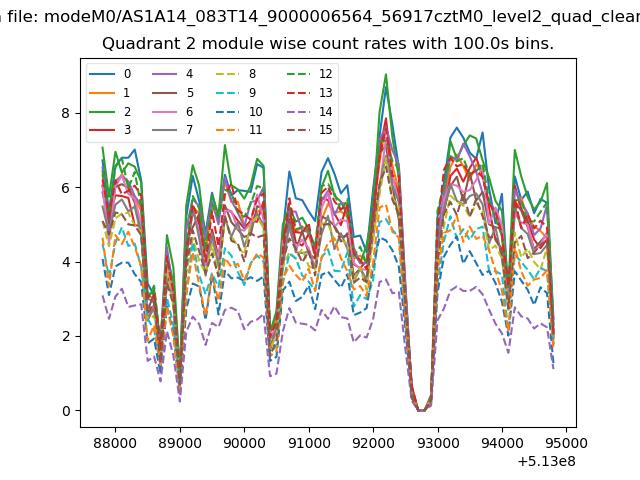
| Module-wise count rates for Quadrant B Data is divided into 100 sec bins |
 |
 |
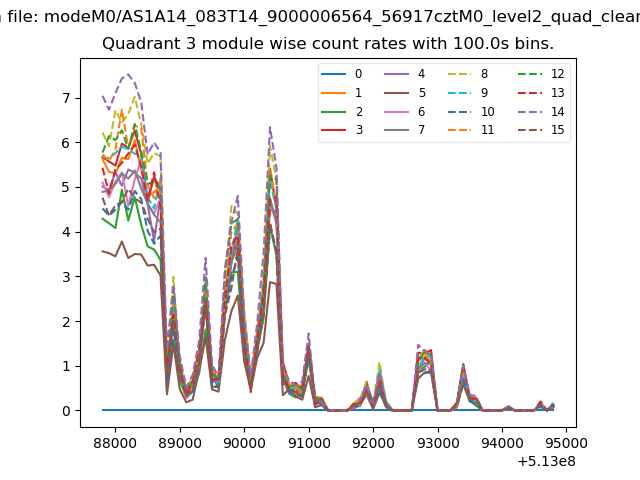
| Module-wise count rates for Quadrant C Data is divided into 100 sec bins |
 |
 |
| Module-wise count rates for Quadrant D Data is divided into 100 sec bins |
 |
 |
| Parameter | Plot |
|---|---|
| CZT HV Monitor | 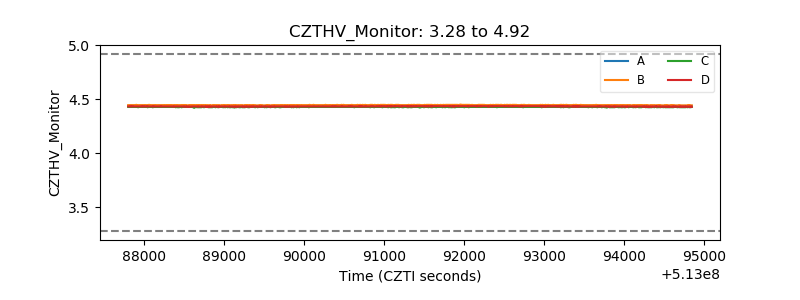 |
| D_VDD | 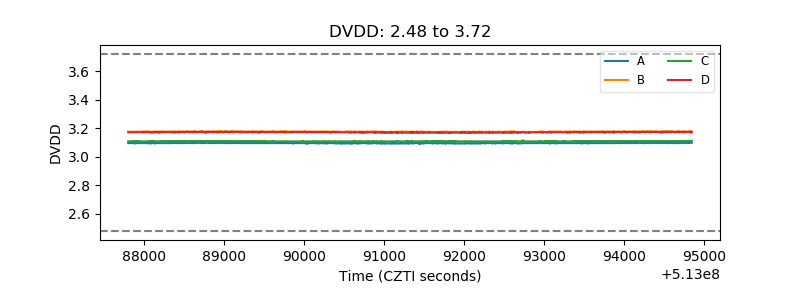 |
| Temperature 1 | 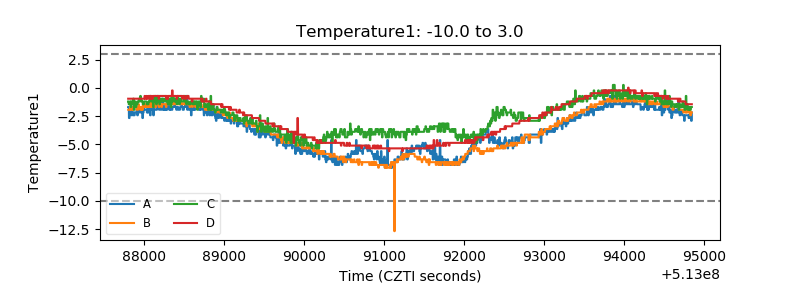 |
| Veto HV Monitor | 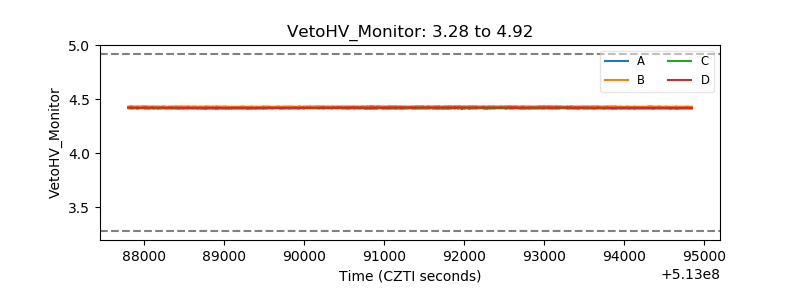 |
| Veto LLD | 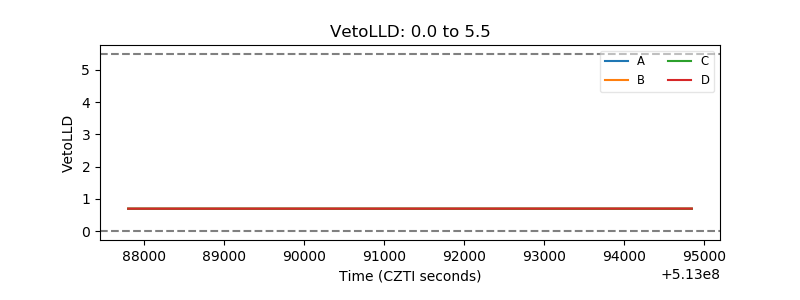 |
| Alpha Counter | 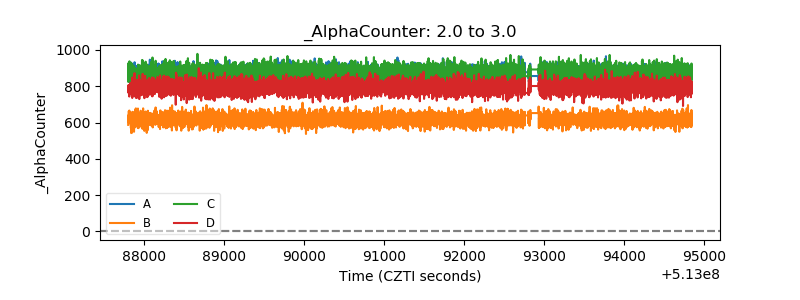 |
| _CPM_Rate | 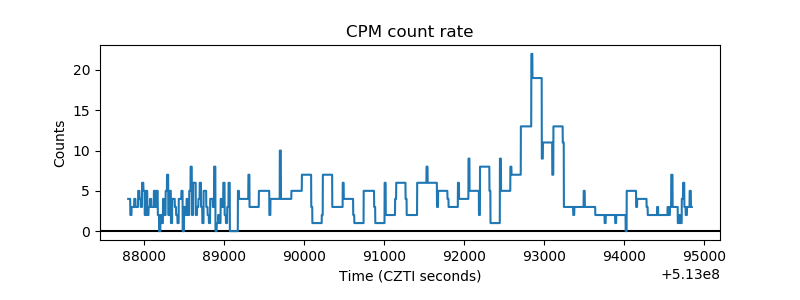 |
| CZT Counter | 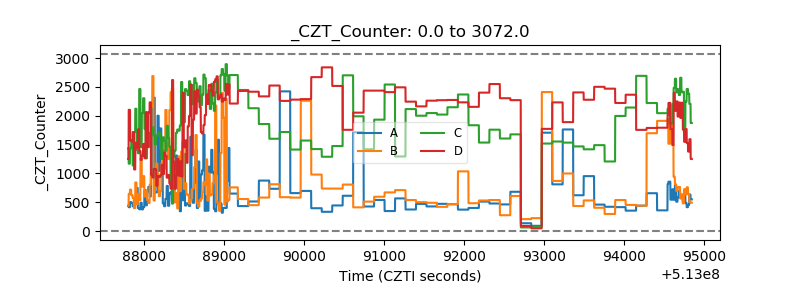 |
| +2.5 Volts monitor |  |
| +5 Volts monitor |  |
| _ROLL_ROT | 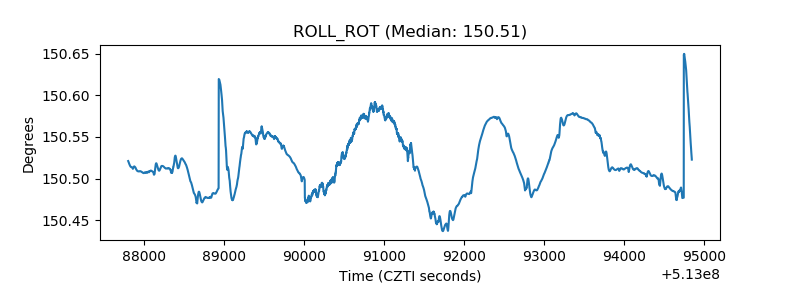 |
| _Roll_DEC | 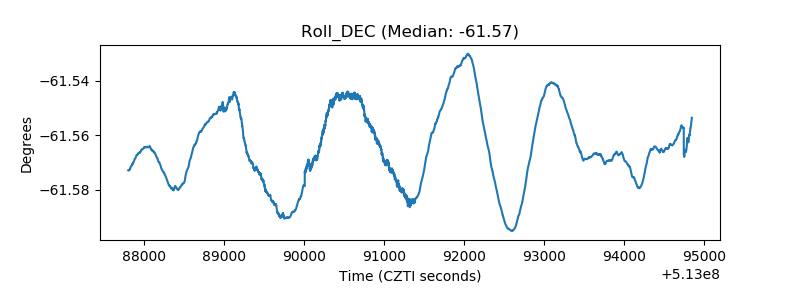 |
| _Roll_RA | 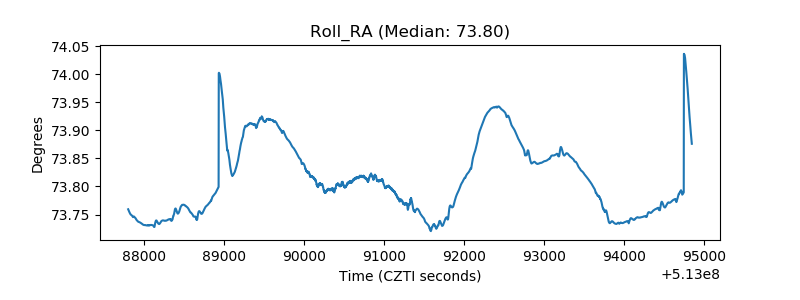 |
| Veto Counter | 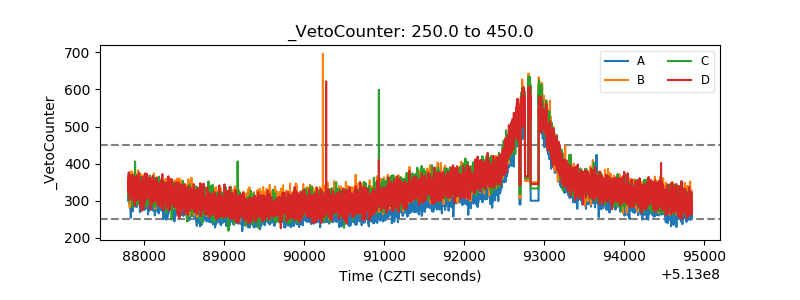 |