| Param | Original file | Final file |
|---|---|---|
| Filename | modeM0/AS1A14_083T14_9000006564_56918cztM0_level2.fits | modeM0/AS1A14_083T14_9000006564_56918cztM0_level2_quad_clean.evt |
| Size (bytes) | 1,128,790,080 | 65,675,520 |
| Size | 1.1 GB | 62.6 MB |
| Events in quadrant A | 4,080,064 | 637,385 |
| Events in quadrant B | 5,381,856 | 659,385 |
| Events in quadrant C | 16,019,115 | 205,745 |
| Events in quadrant D | 15,768,163 | 3,474 |
| Mode SS | |||
|---|---|---|---|
| Quadrant | BADHDUFLAG | Total packets | Discarded packets |
| A | 0 | 138 | 0 |
| B | 0 | 138 | 0 |
| C | 0 | 138 | 0 |
| D | 0 | 138 | 0 |
| Mode M0 | |||
|---|---|---|---|
| Quadrant | BADHDUFLAG | Total packets | Discarded packets |
| A | 0 | 16957 | 0 |
| B | 0 | 20791 | 0 |
| C | 0 | 52293 | 0 |
| D | 0 | 51514 | 3 |
| Quadrant | Total seconds | Saturated seconds | Saturation percentage |
|---|---|---|---|
| A | 6923 | 160 | 2.311137% |
| B | 6924 | 466 | 6.730214% |
| C | 6924 | 4887 | 70.580589% |
| D | 6923 | 6895 | 99.595551% |
Noise dominated data is calculated using 1-second bins in cleaned event files. If a bin has >2000 counts, and if more than 50% of those come from <1% of pixels, then it is considered to be noise-dominated and hence unusable.
| Quadrant | # 1 sec bins | Bins with >0 counts | Bins with >2000 counts | High rate bins dominated by noise | Noise dominated (total time) | Noise dominated (detector-on time) | Marked lightcurve |
|---|---|---|---|---|---|---|---|
| A | 6923 | 6923 | 134 | 134 | 1.94% | 1.94% | 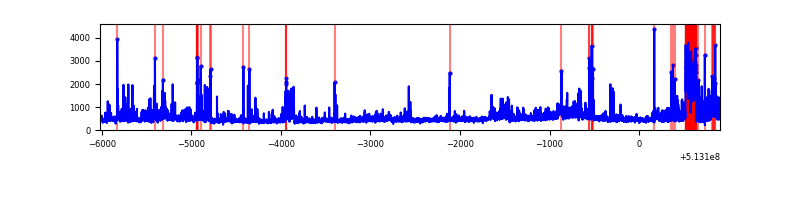 |
| B | 6924 | 6924 | 383 | 383 | 5.53% | 5.53% | 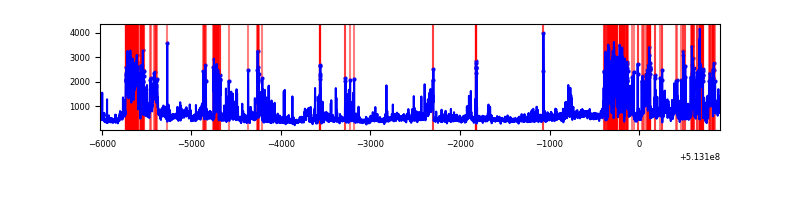 |
| C | 6923 | 6923 | 5536 | 5536 | 79.97% | 79.97% | 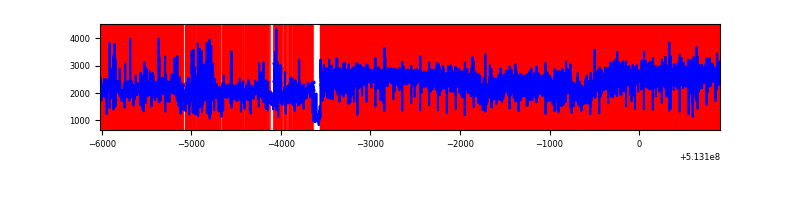 |
| D | 6922 | 6922 | 5684 | 5684 | 82.11% | 82.11% | 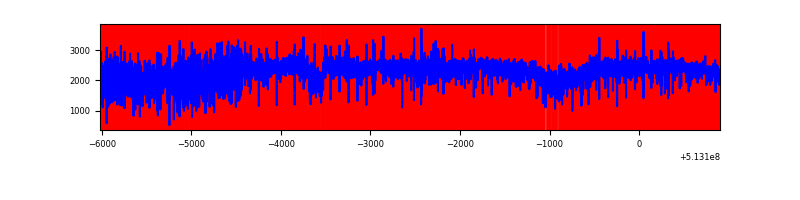 |
Top three noisy pixels from each quadrant. If the there are fewer than three noisy pixels in the level2.evt file, extra rows are filled as -1
| Pixel properties | Quadrant properties | ||||||
|---|---|---|---|---|---|---|---|
| Quadrant | DetID | PixID | Counts | Sigma | Mean | Median | Sigma |
| A | 7 | 64 | 634163 | 3589.86 | 705 | 687 | 176.5 |
| A | 10 | 251 | 513690 | 2907.15 | 705 | 687 | 176.5 |
| A | 4 | 249 | 84855 | 476.97 | 705 | 687 | 176.5 |
| B | 5 | 185 | 1781122 | 12076.32 | 689 | 667 | 147.4 |
| B | 5 | 172 | 269345 | 1822.37 | 689 | 667 | 147.4 |
| B | 7 | 0 | 191272 | 1292.82 | 689 | 667 | 147.4 |
| C | 9 | 38 | 13278638 | 93101.55 | 518 | 513 | 142.6 |
| C | 14 | 254 | 314058 | 2198.47 | 518 | 513 | 142.6 |
| C | 13 | 3 | 274998 | 1924.59 | 518 | 513 | 142.6 |
| D | 12 | 33 | 13622228 | 178386.2 | 256 | 242 | 76.4 |
| D | 5 | 222 | 356303 | 4662.78 | 256 | 242 | 76.4 |
| D | 8 | 240 | 285750 | 3738.85 | 256 | 242 | 76.4 |
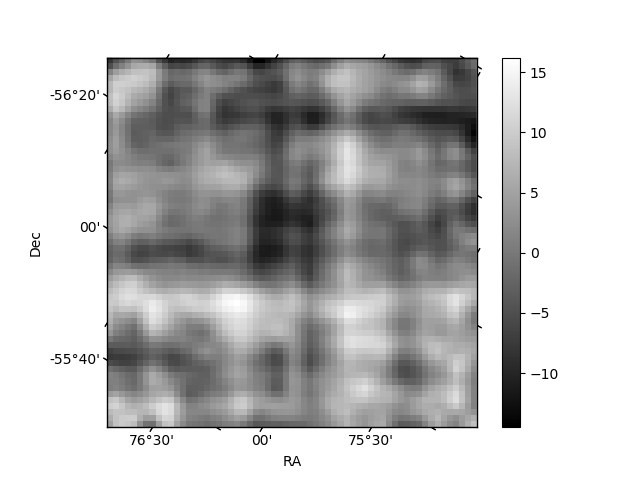
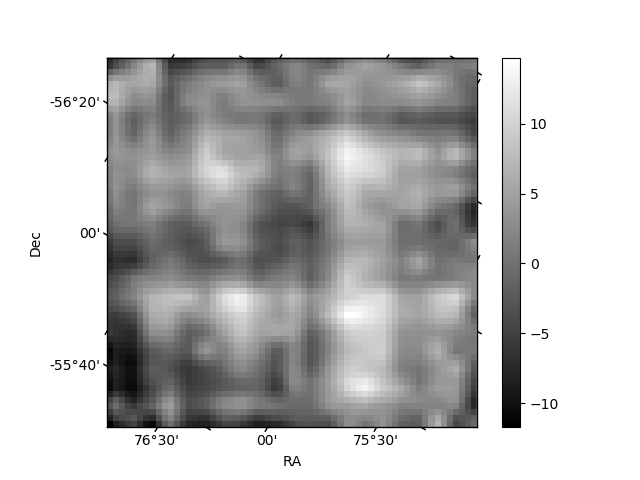
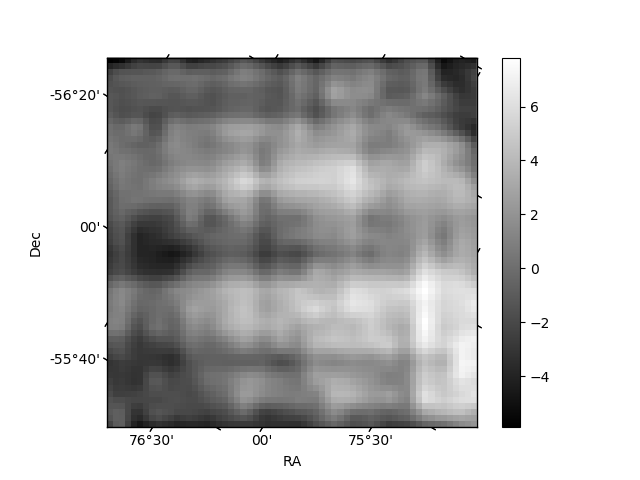
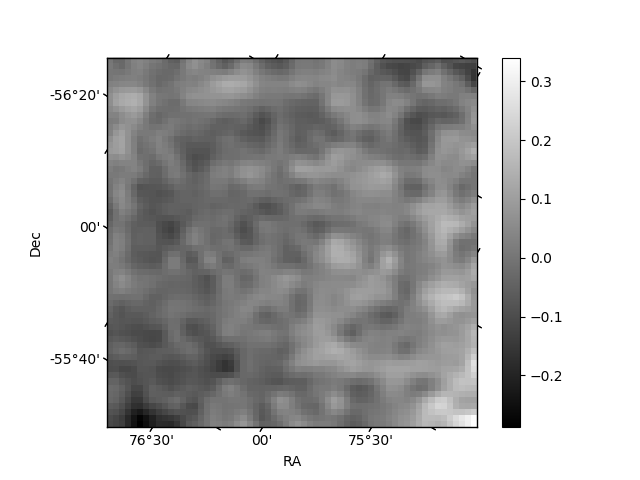
Histogram calculated using DETX and DETY for each event in the final _common_clean file
| Quadrant A | 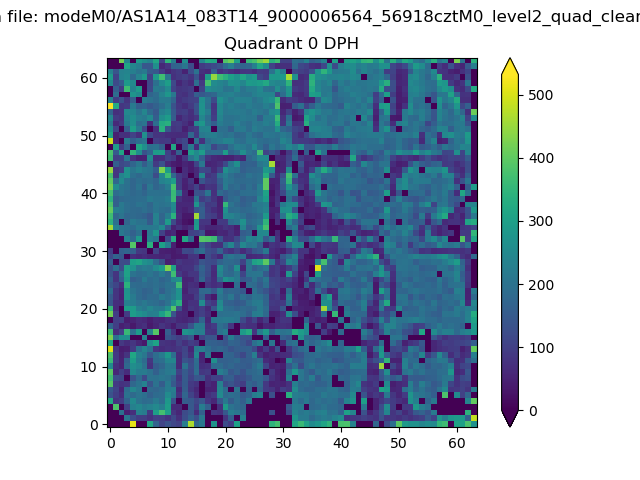 |
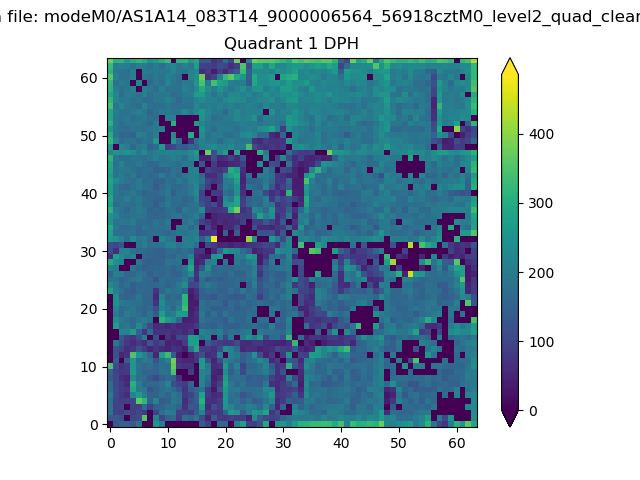 |
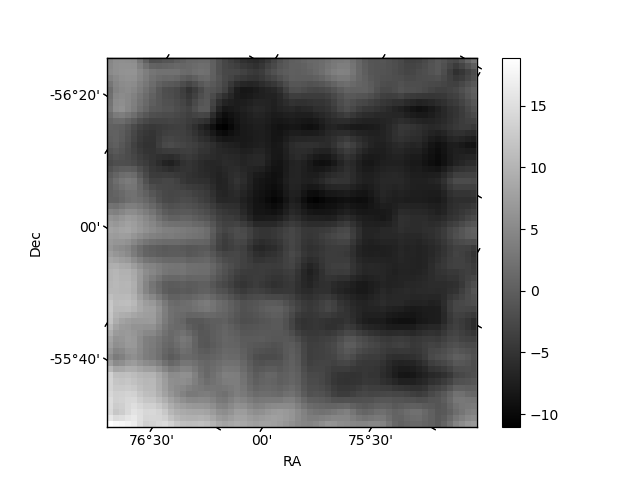
Quadrant B |
|---|---|---|---|
| Quadrant D | 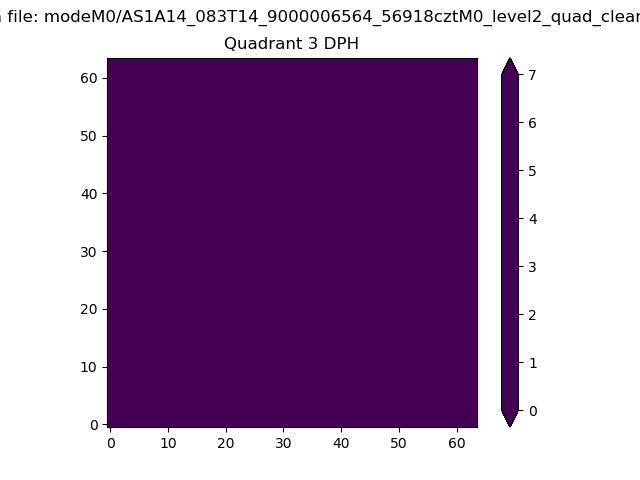 |
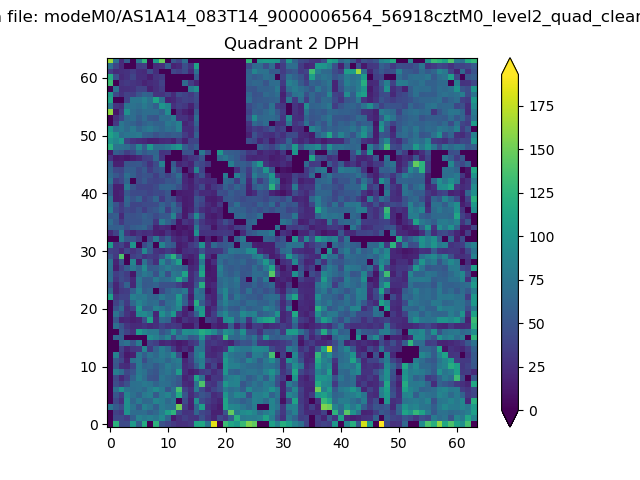 |
Quadrant C |
| Plot type | Count rate plots | Images |
|---|---|---|
| Comparison with Poisson distribution Blue bars denote a histogram of data divided into 1 sec bins. Red curve is a Poisson curve with rate = median count rate of data. |
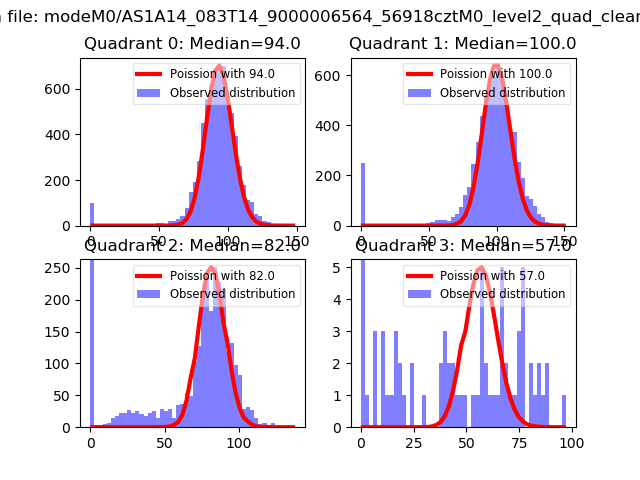 |
 |
| Quadrant-wise count rates Data is divided into 100 sec bins |
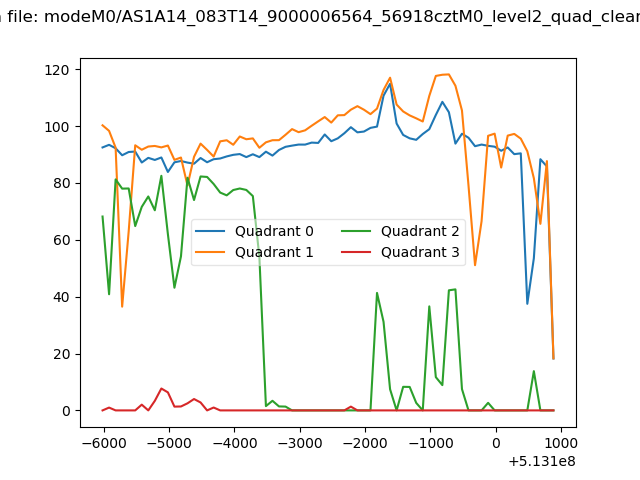 |
|
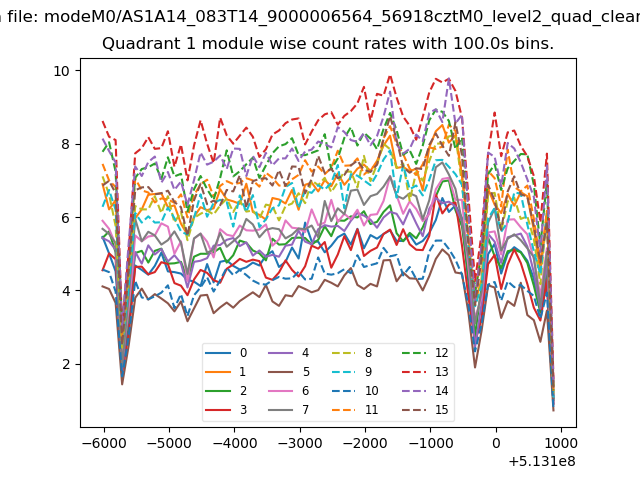
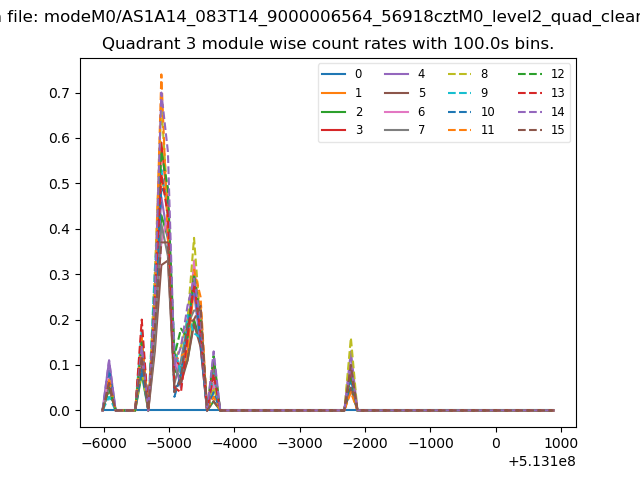
| Module-wise count rates for Quadrant A Data is divided into 100 sec bins |
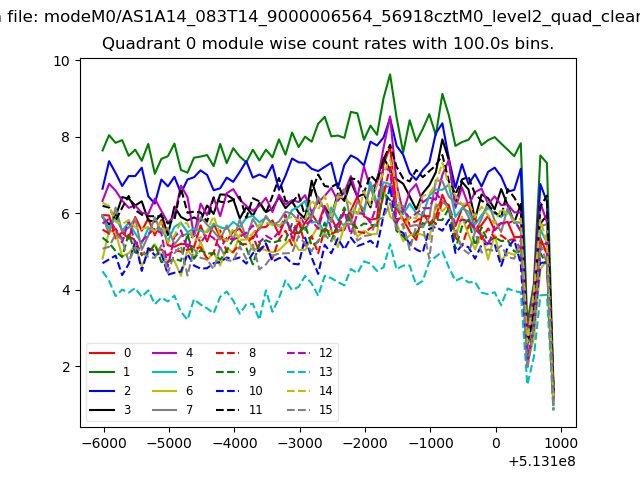 |
 |
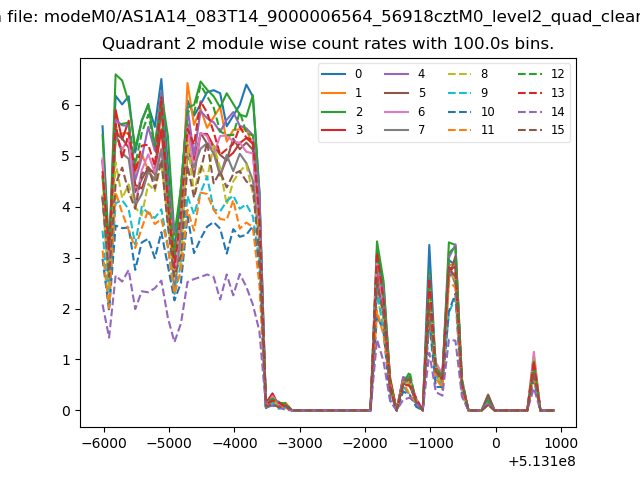
| Module-wise count rates for Quadrant B Data is divided into 100 sec bins |
 |
 |
| Module-wise count rates for Quadrant C Data is divided into 100 sec bins |
 |
 |
| Module-wise count rates for Quadrant D Data is divided into 100 sec bins |
 |
 |
| Parameter | Plot |
|---|---|
| CZT HV Monitor | 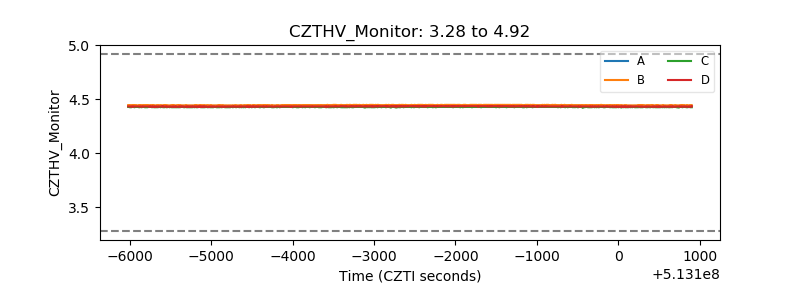 |
| D_VDD | 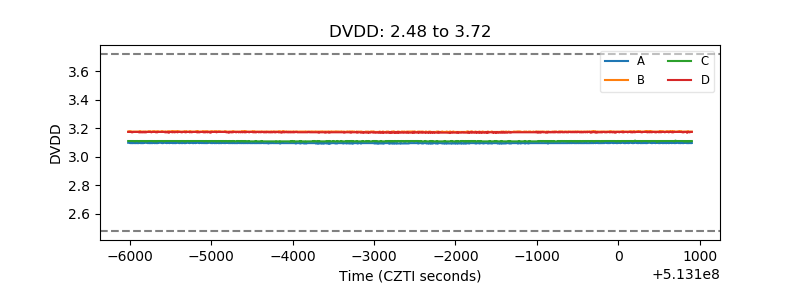 |
| Temperature 1 | 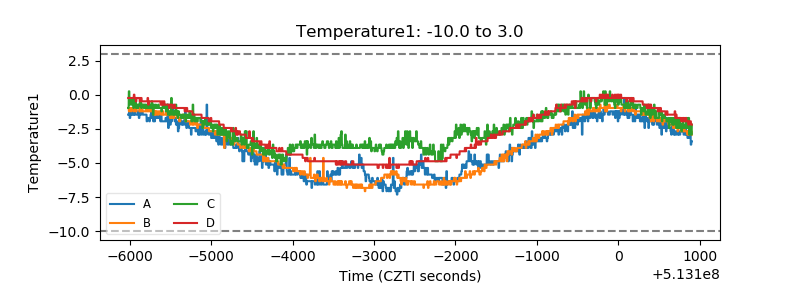 |
| Veto HV Monitor | 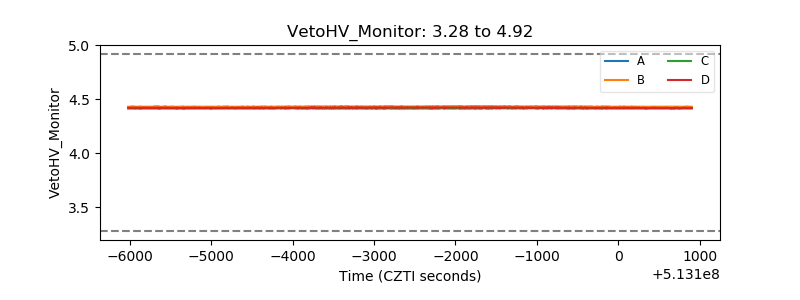 |
| Veto LLD | 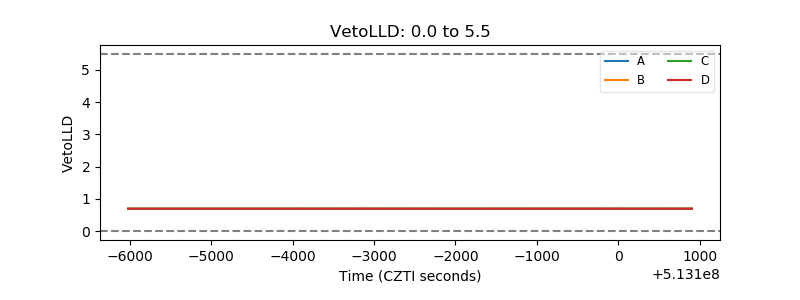 |
| Alpha Counter | 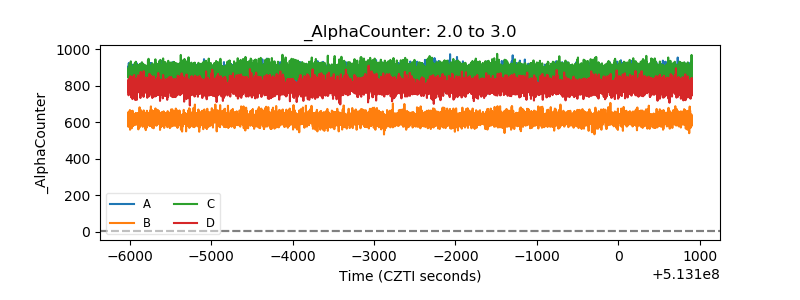 |
| _CPM_Rate | 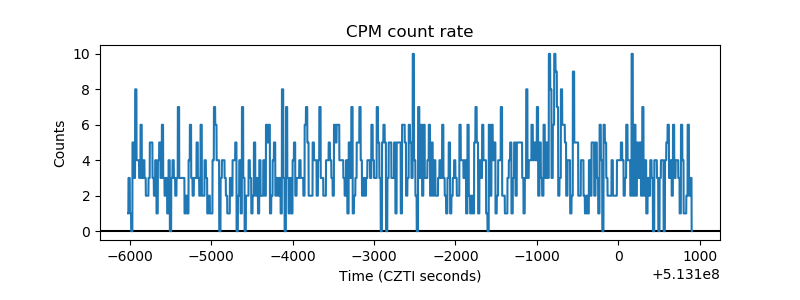 |
| CZT Counter | 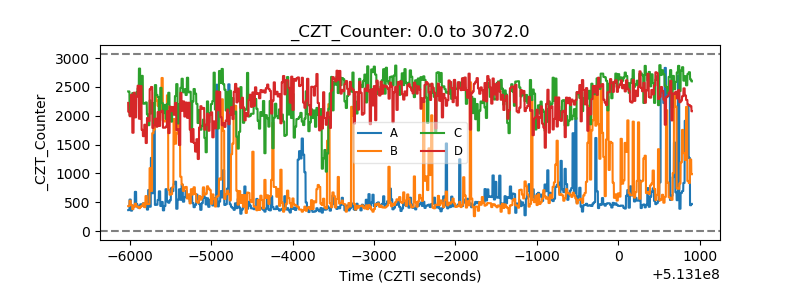 |
| +2.5 Volts monitor |  |
| +5 Volts monitor |  |
| _ROLL_ROT | 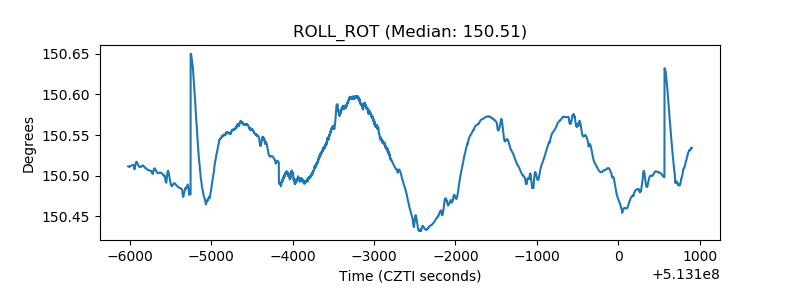 |
| _Roll_DEC | 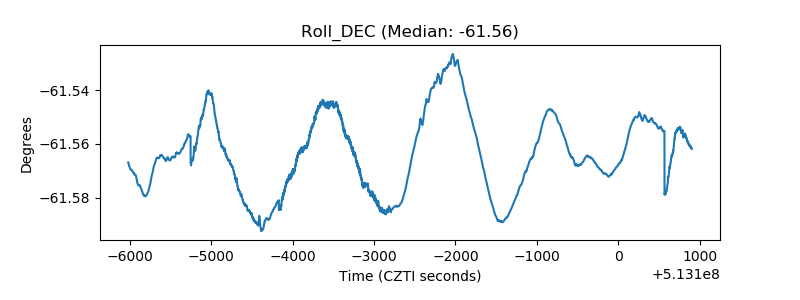 |
| _Roll_RA | 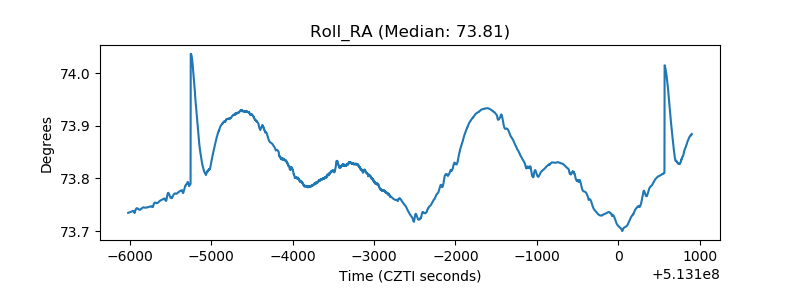 |
| Veto Counter | 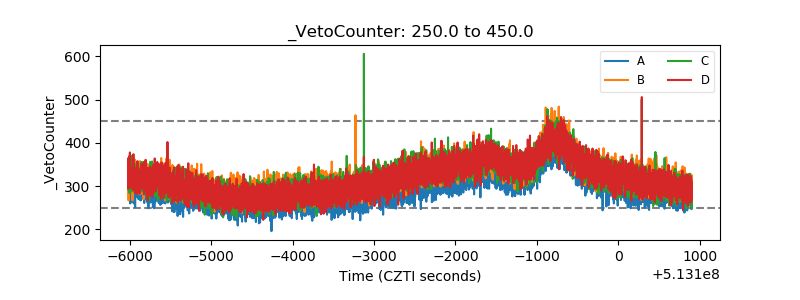 |