| Param | Original file | Final file |
|---|---|---|
| Filename | modeM0/AS1A14_083T14_9000006564_56919cztM0_level2.fits | modeM0/AS1A14_083T14_9000006564_56919cztM0_level2_quad_clean.evt |
| Size (bytes) | 1,140,776,640 | 55,523,520 |
| Size | 1.1 GB | 53.0 MB |
| Events in quadrant A | 4,997,770 | 569,218 |
| Events in quadrant B | 5,646,549 | 621,971 |
| Events in quadrant C | 16,154,801 | 26,901 |
| Events in quadrant D | 14,918,811 | 978 |
| Mode SS | |||
|---|---|---|---|
| Quadrant | BADHDUFLAG | Total packets | Discarded packets |
| A | 0 | 143 | 5 |
| B | 0 | 142 | 4 |
| C | 0 | 142 | 0 |
| D | 0 | 142 | 6 |
| Mode M9 | |||
|---|---|---|---|
| Quadrant | BADHDUFLAG | Total packets | Discarded packets |
| A | 0 | 1 | 1 |
| B | 1 | 1 | 1 |
| C | 1 | -1 | -1 |
| D | 1 | -1 | -1 |
| Mode M0 | |||
|---|---|---|---|
| Quadrant | BADHDUFLAG | Total packets | Discarded packets |
| A | 0 | 20951 | 1181 |
| B | 0 | 22807 | 1561 |
| C | 0 | 56954 | 4470 |
| D | 0 | 52574 | 3838 |
| Quadrant | Total seconds | Saturated seconds | Saturation percentage |
|---|---|---|---|
| A | 6716 | 620 | 9.231686% |
| B | 6667 | 475 | 7.124644% |
| C | 6488 | 6207 | 95.668927% |
| D | 6526 | 6519 | 99.892737% |
Noise dominated data is calculated using 1-second bins in cleaned event files. If a bin has >2000 counts, and if more than 50% of those come from <1% of pixels, then it is considered to be noise-dominated and hence unusable.
| Quadrant | # 1 sec bins | Bins with >0 counts | Bins with >2000 counts | High rate bins dominated by noise | Noise dominated (total time) | Noise dominated (detector-on time) | Marked lightcurve |
|---|---|---|---|---|---|---|---|
| A | 7146 | 6842 | 553 | 553 | 7.74% | 8.08% | 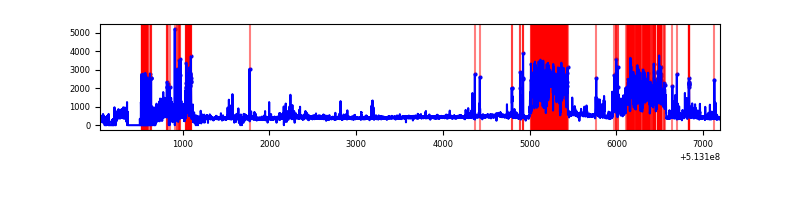 |
| B | 7143 | 6839 | 398 | 398 | 5.57% | 5.82% | 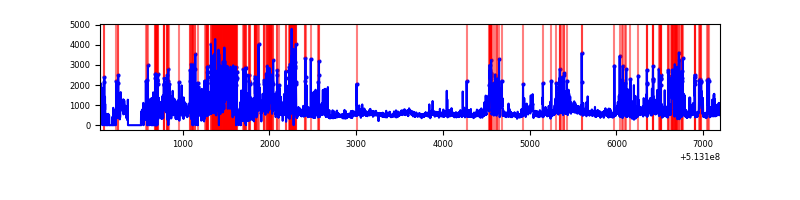 |
| C | 7138 | 6631 | 5845 | 5845 | 81.89% | 88.15% | 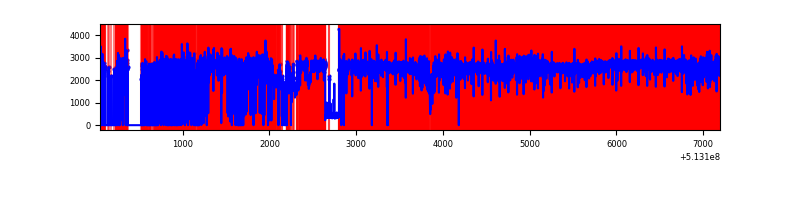 |
| D | 7142 | 6528 | 5851 | 5851 | 81.92% | 89.63% | 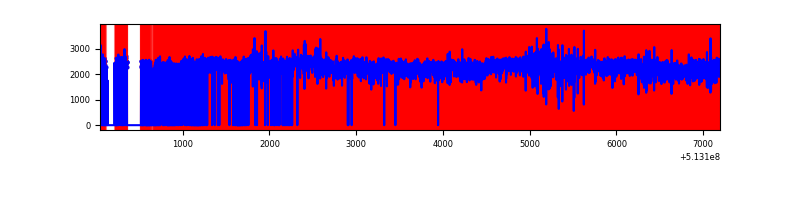 |
Top three noisy pixels from each quadrant. If the there are fewer than three noisy pixels in the level2.evt file, extra rows are filled as -1
| Pixel properties | Quadrant properties | ||||||
|---|---|---|---|---|---|---|---|
| Quadrant | DetID | PixID | Counts | Sigma | Mean | Median | Sigma |
| A | 7 | 64 | 1920551 | 11581.59 | 663 | 646 | 165.8 |
| A | 10 | 251 | 192815 | 1159.24 | 663 | 646 | 165.8 |
| A | 13 | 248 | 176490 | 1060.76 | 663 | 646 | 165.8 |
| B | 5 | 185 | 1823084 | 12796.92 | 663 | 639 | 142.4 |
| B | 5 | 172 | 375280 | 2630.67 | 663 | 639 | 142.4 |
| B | 0 | 171 | 287284 | 2012.78 | 663 | 639 | 142.4 |
| C | 9 | 38 | 13784724 | 143938.48 | 348 | 345 | 95.8 |
| C | 13 | 3 | 697988 | 7284.89 | 348 | 345 | 95.8 |
| C | 14 | 254 | 150059 | 1563.34 | 348 | 345 | 95.8 |
| D | 12 | 33 | 13701800 | 219045.74 | 215 | 204 | 62.6 |
| D | 2 | 249 | 155098 | 2476.27 | 215 | 204 | 62.6 |
| D | 8 | 240 | 79547 | 1268.45 | 215 | 204 | 62.6 |
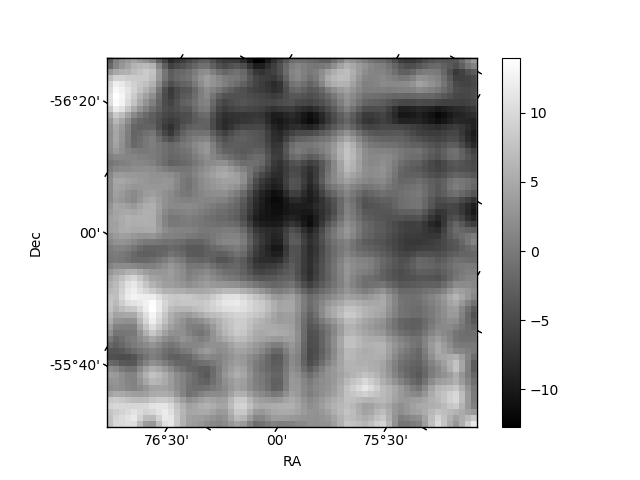
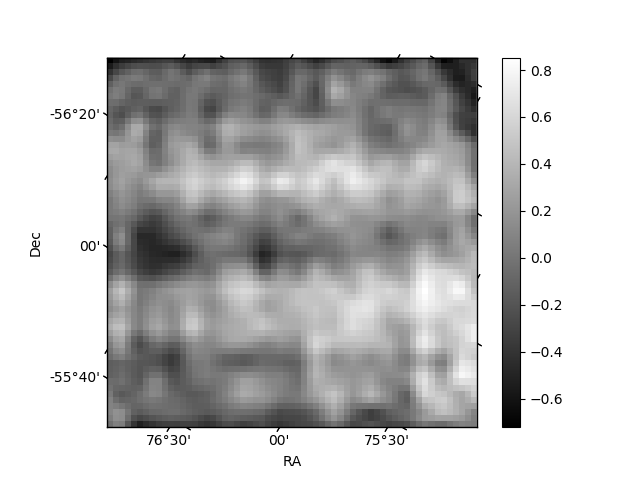
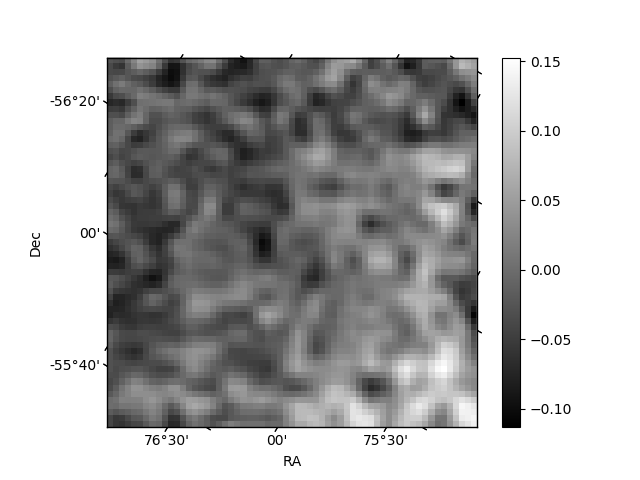
Histogram calculated using DETX and DETY for each event in the final _common_clean file
| Quadrant A | 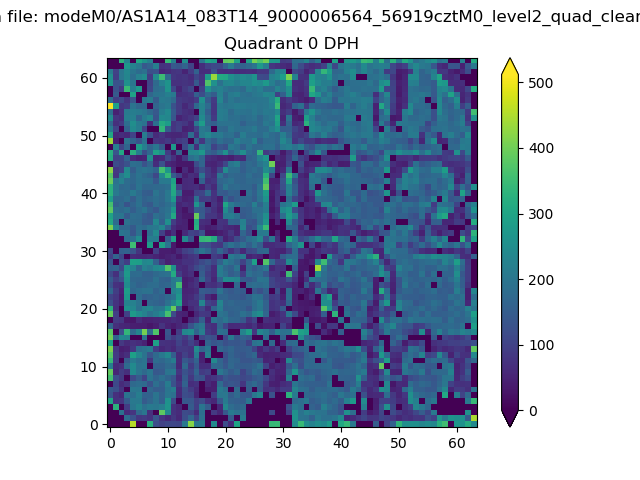 |
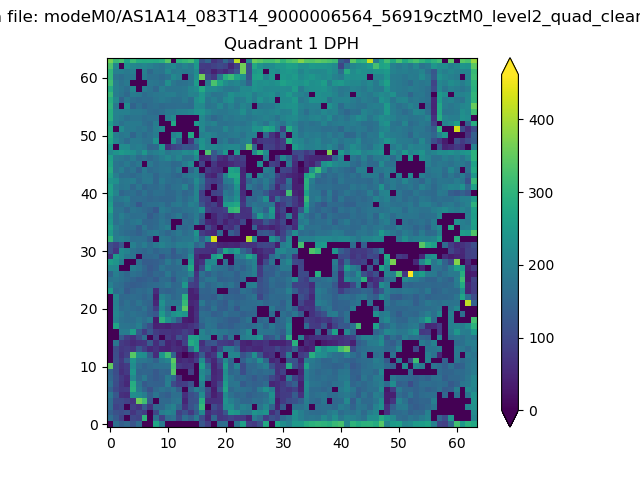 |
Quadrant B |
|---|---|---|---|
| Quadrant D | 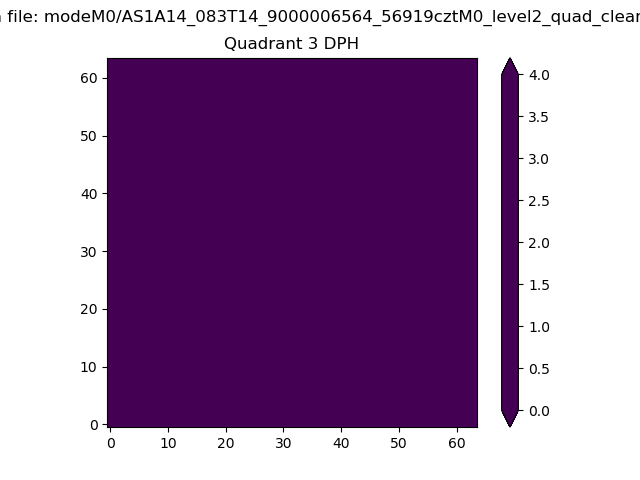 |
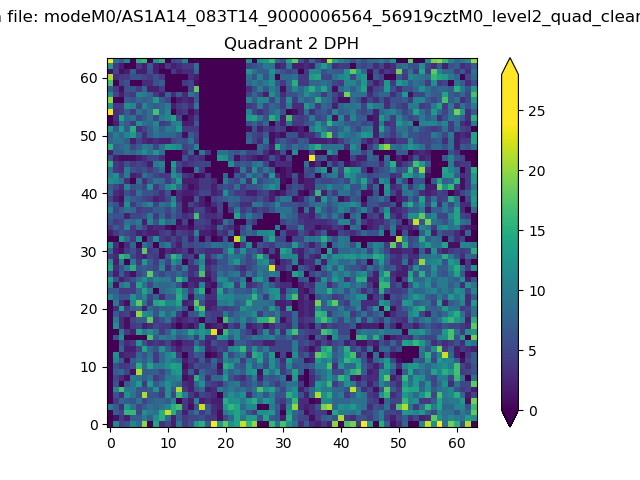 |
Quadrant C |
| Plot type | Count rate plots | Images |
|---|---|---|
| Comparison with Poisson distribution Blue bars denote a histogram of data divided into 1 sec bins. Red curve is a Poisson curve with rate = median count rate of data. |
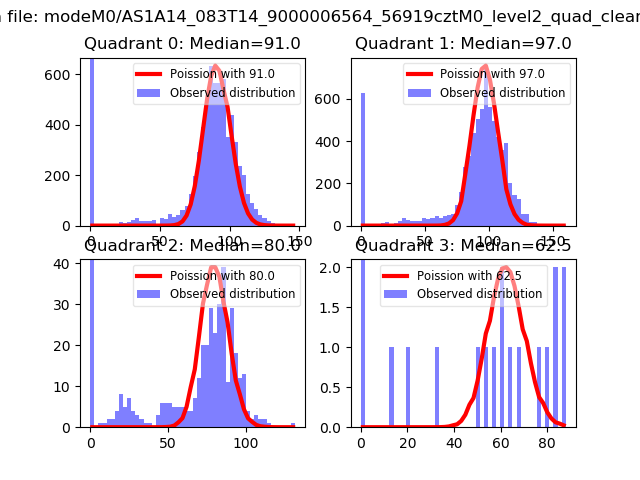 |
 |
| Quadrant-wise count rates Data is divided into 100 sec bins |
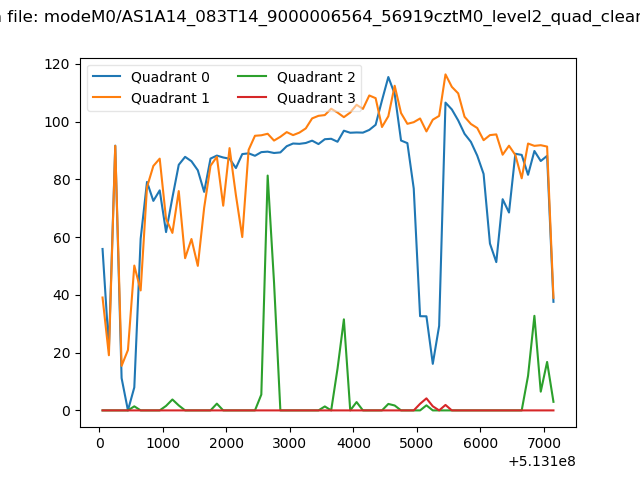 |
|
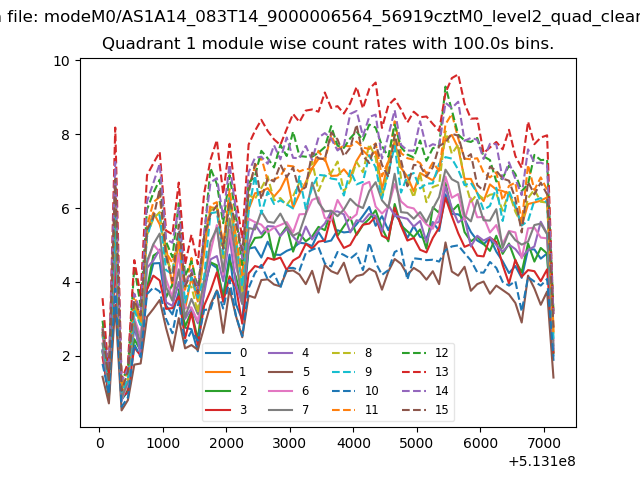
| Module-wise count rates for Quadrant A Data is divided into 100 sec bins |
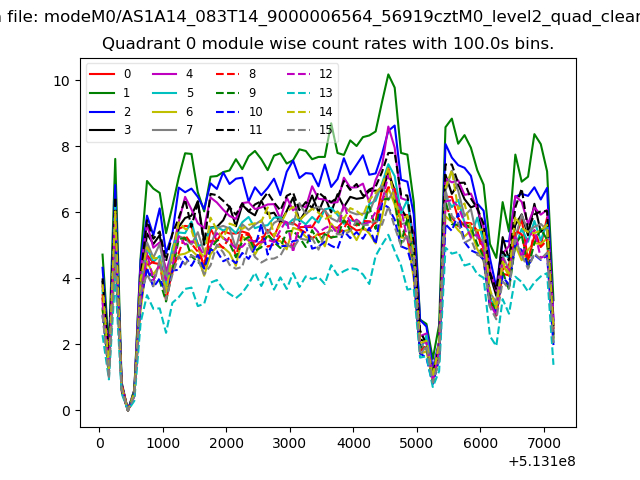 |
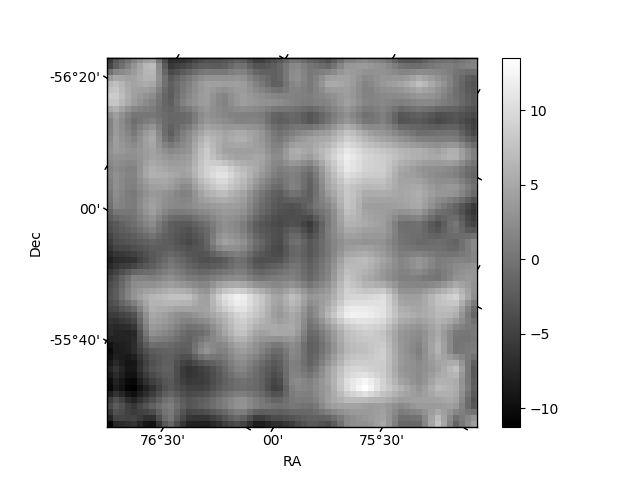 |
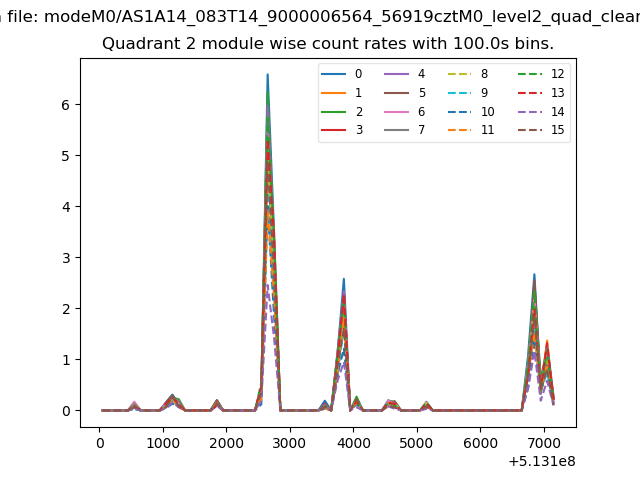
| Module-wise count rates for Quadrant B Data is divided into 100 sec bins |
 |
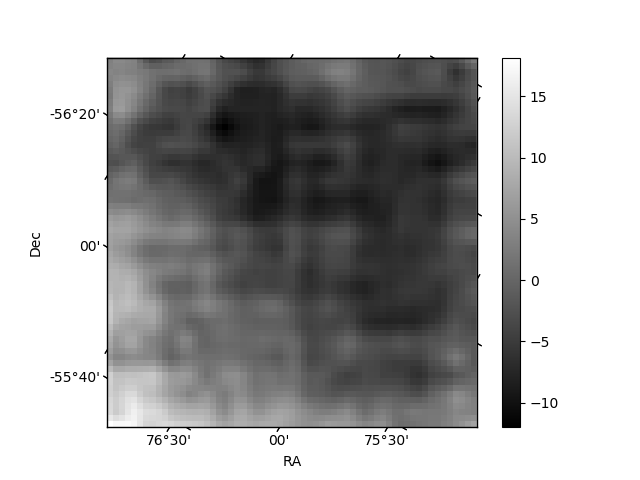 |
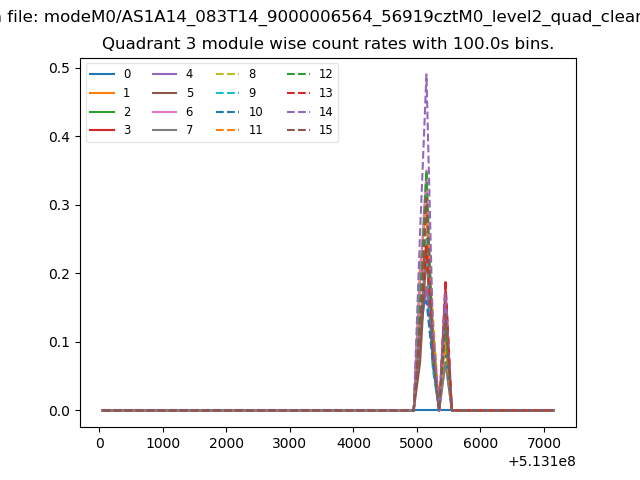
| Module-wise count rates for Quadrant C Data is divided into 100 sec bins |
 |
 |
| Module-wise count rates for Quadrant D Data is divided into 100 sec bins |
 |
 |
| Parameter | Plot |
|---|---|
| CZT HV Monitor | 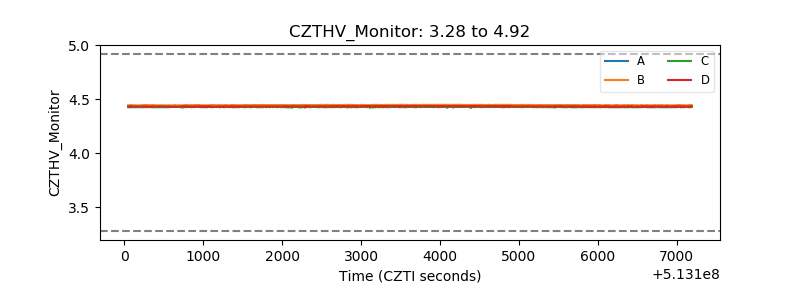 |
| D_VDD | 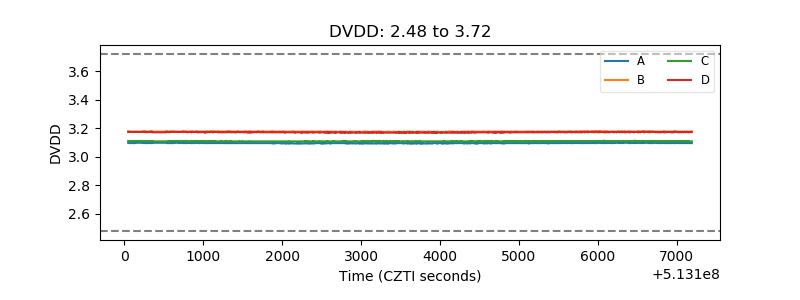 |
| Temperature 1 | 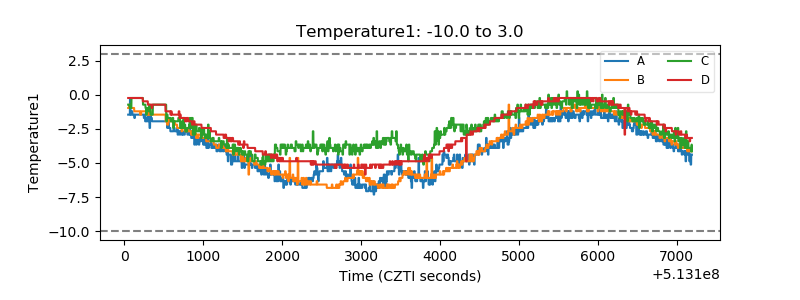 |
| Veto HV Monitor |  |
| Veto LLD | 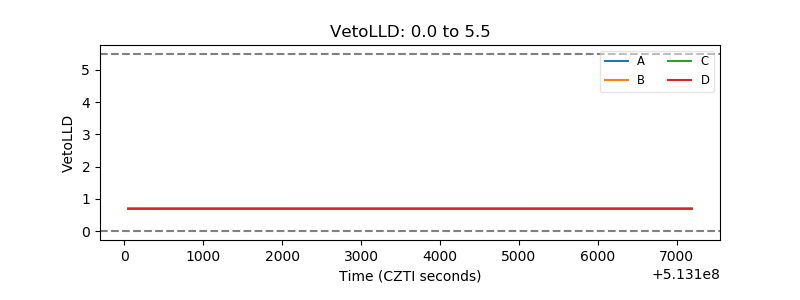 |
| Alpha Counter | 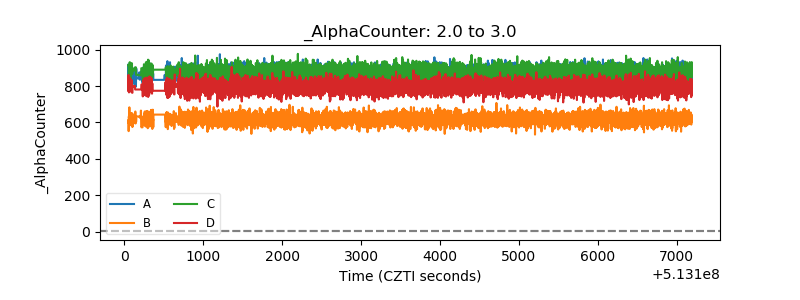 |
| _CPM_Rate | 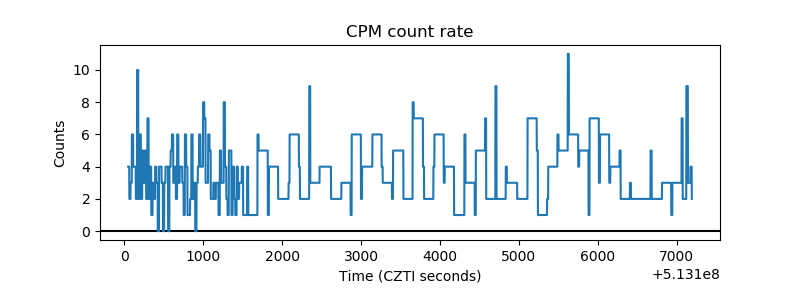 |
| CZT Counter | 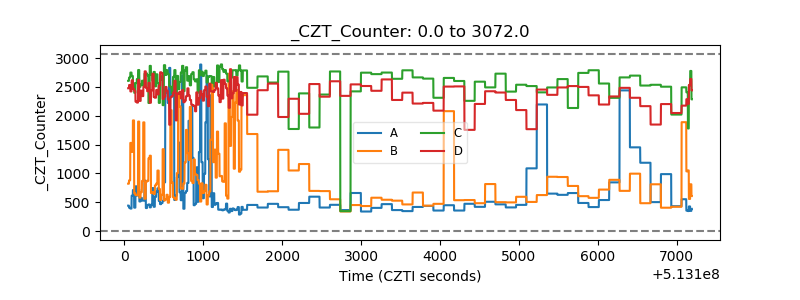 |
| +2.5 Volts monitor |  |
| +5 Volts monitor |  |
| _ROLL_ROT | 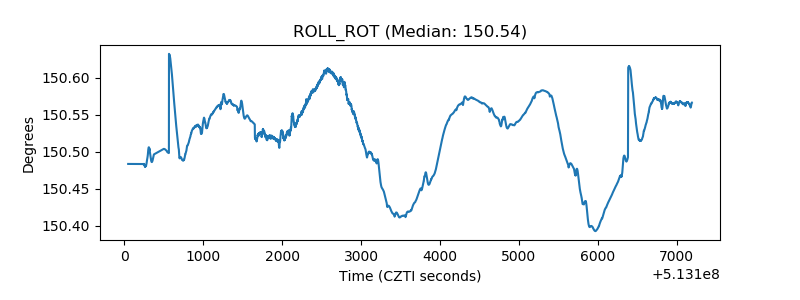 |
| _Roll_DEC | 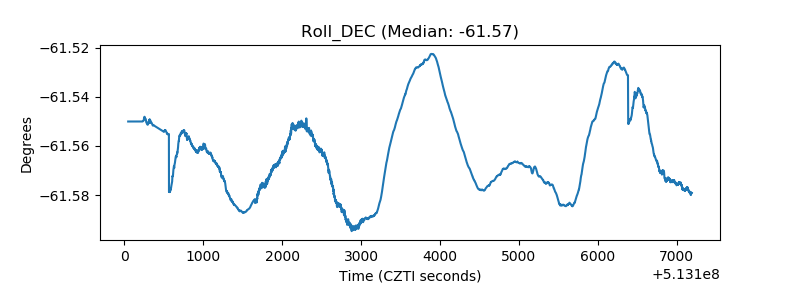 |
| _Roll_RA | 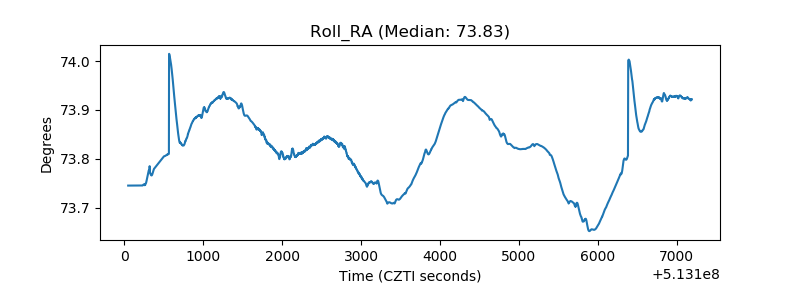 |
| Veto Counter | 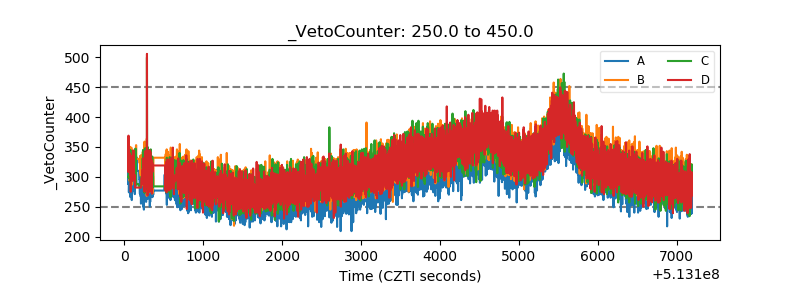 |