| Param | Original file | Final file |
|---|---|---|
| Filename | modeM0/AS1A14_083T14_9000006564_56923cztM0_level2.fits | modeM0/AS1A14_083T14_9000006564_56923cztM0_level2_quad_clean.evt |
| Size (bytes) | 872,409,600 | 78,681,600 |
| Size | 832.0 MB | 75.0 MB |
| Events in quadrant A | 6,025,105 | 621,248 |
| Events in quadrant B | 4,579,186 | 652,708 |
| Events in quadrant C | 3,894,734 | 601,640 |
| Events in quadrant D | 17,250,686 | 18,624 |
| Mode SS | |||
|---|---|---|---|
| Quadrant | BADHDUFLAG | Total packets | Discarded packets |
| A | 0 | 144 | 0 |
| B | 0 | 144 | 0 |
| C | 0 | 144 | 0 |
| D | 0 | 144 | 0 |
| Mode M9 | |||
|---|---|---|---|
| Quadrant | BADHDUFLAG | Total packets | Discarded packets |
| A | 0 | 15 | 0 |
| B | 0 | 15 | 0 |
| C | 0 | 15 | 0 |
| D | 0 | 15 | 0 |
| Mode M0 | |||
|---|---|---|---|
| Quadrant | BADHDUFLAG | Total packets | Discarded packets |
| A | 0 | 23182 | 2 |
| B | 0 | 18728 | 2 |
| C | 0 | 16825 | 2 |
| D | 0 | 55820 | 2 |
| Quadrant | Total seconds | Saturated seconds | Saturation percentage |
|---|---|---|---|
| A | 7005 | 460 | 6.566738% |
| B | 7006 | 492 | 7.022552% |
| C | 7006 | 189 | 2.697688% |
| D | 7006 | 6835 | 97.559235% |
Noise dominated data is calculated using 1-second bins in cleaned event files. If a bin has >2000 counts, and if more than 50% of those come from <1% of pixels, then it is considered to be noise-dominated and hence unusable.
| Quadrant | # 1 sec bins | Bins with >0 counts | Bins with >2000 counts | High rate bins dominated by noise | Noise dominated (total time) | Noise dominated (detector-on time) | Marked lightcurve |
|---|---|---|---|---|---|---|---|
| A | 8455 | 7006 | 331 | 331 | 3.91% | 4.72% | 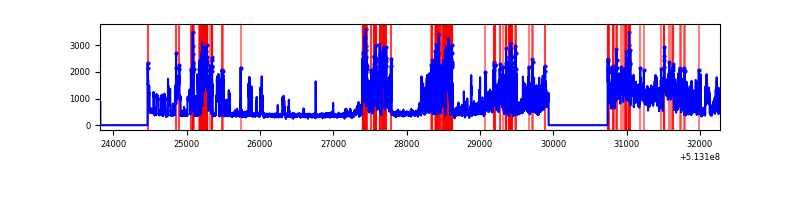 |
| B | 8456 | 7007 | 332 | 332 | 3.93% | 4.74% | 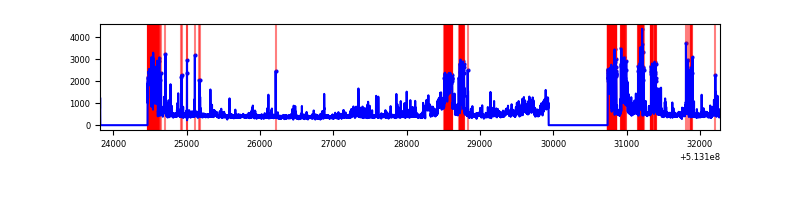 |
| C | 8456 | 7008 | 168 | 168 | 1.99% | 2.40% | 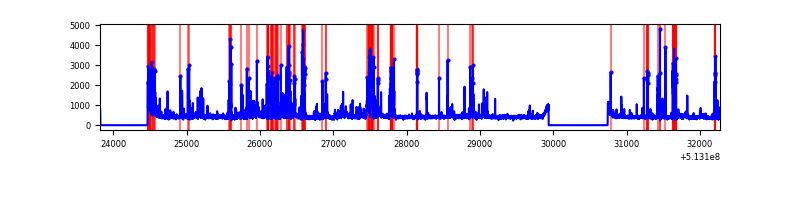 |
| D | 8455 | 7005 | 6651 | 6651 | 78.66% | 94.95% | 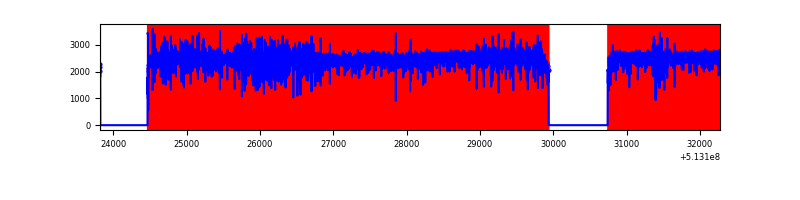 |
Top three noisy pixels from each quadrant. If the there are fewer than three noisy pixels in the level2.evt file, extra rows are filled as -1
| Pixel properties | Quadrant properties | ||||||
|---|---|---|---|---|---|---|---|
| Quadrant | DetID | PixID | Counts | Sigma | Mean | Median | Sigma |
| A | 7 | 64 | 2796278 | 15882.63 | 709 | 694 | 176.0 |
| A | 11 | 31 | 257600 | 1459.57 | 709 | 694 | 176.0 |
| A | 12 | 15 | 80005 | 450.59 | 709 | 694 | 176.0 |
| B | 5 | 172 | 705396 | 4736.42 | 692 | 667 | 148.8 |
| B | 10 | 16 | 638047 | 4283.77 | 692 | 667 | 148.8 |
| B | 5 | 185 | 123441 | 825.15 | 692 | 667 | 148.8 |
| C | 13 | 3 | 886219 | 4624.67 | 696 | 690 | 191.5 |
| C | 14 | 254 | 209078 | 1088.3 | 696 | 690 | 191.5 |
| C | 11 | 244 | 24272 | 123.16 | 696 | 690 | 191.5 |
| D | 12 | 33 | 14780416 | 143074.39 | 355 | 339 | 103.3 |
| D | 11 | 129 | 337295 | 3261.81 | 355 | 339 | 103.3 |
| D | 8 | 160 | 317784 | 3072.94 | 355 | 339 | 103.3 |
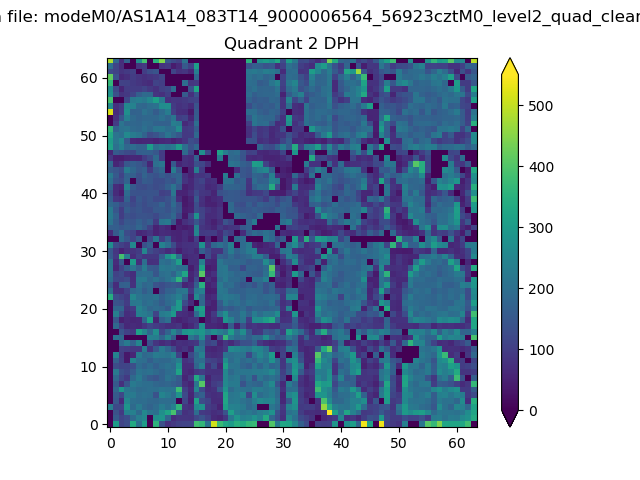
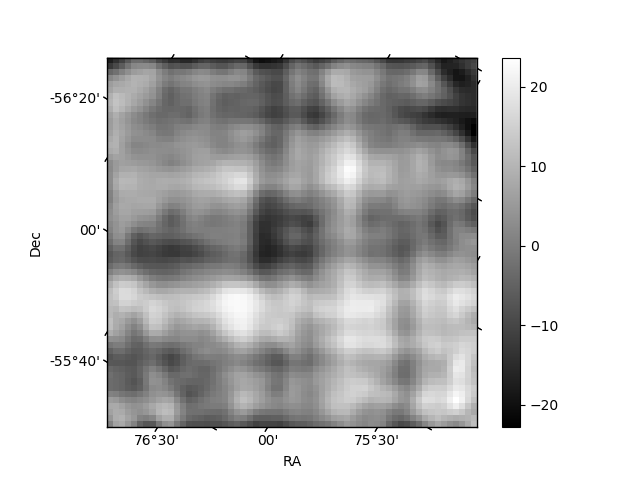
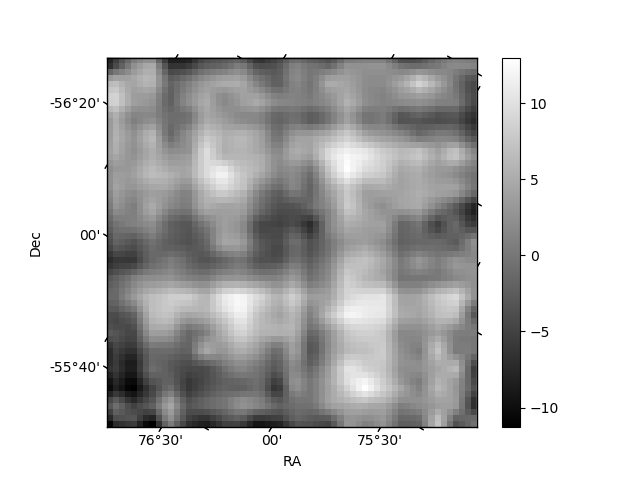
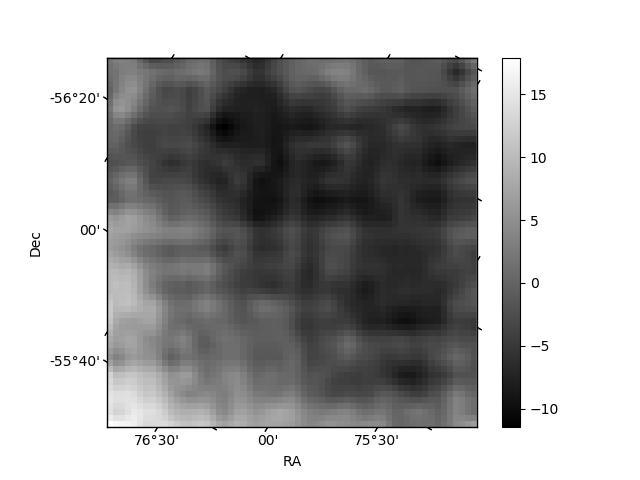
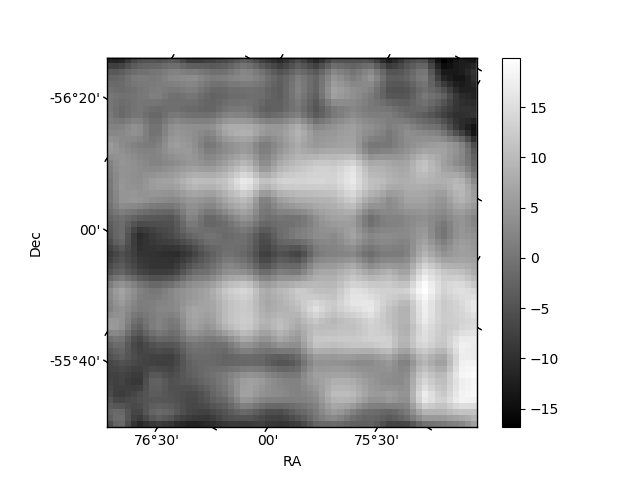
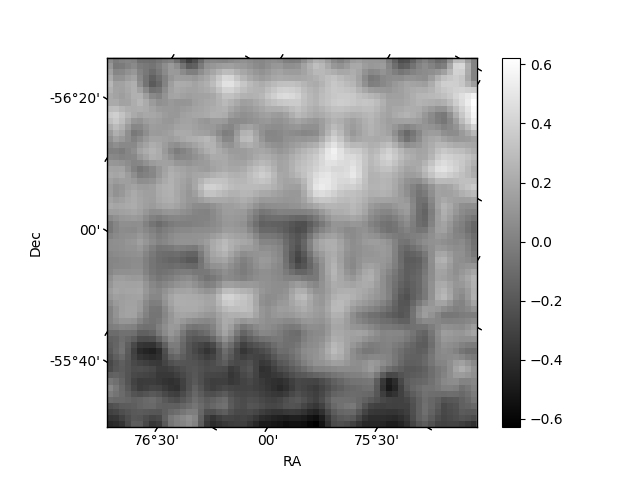
Histogram calculated using DETX and DETY for each event in the final _common_clean file
| Quadrant A | 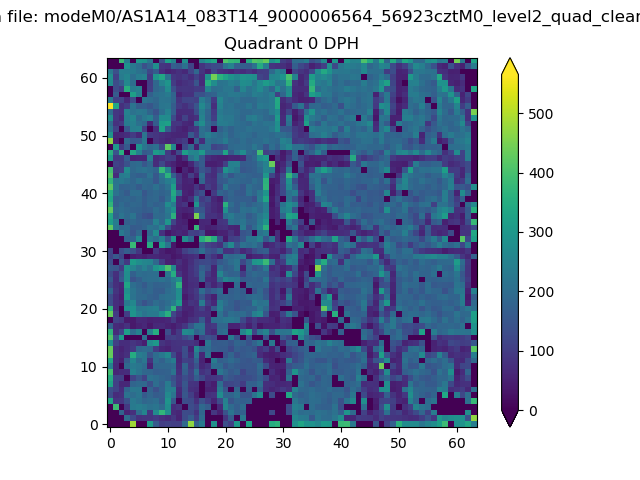 |
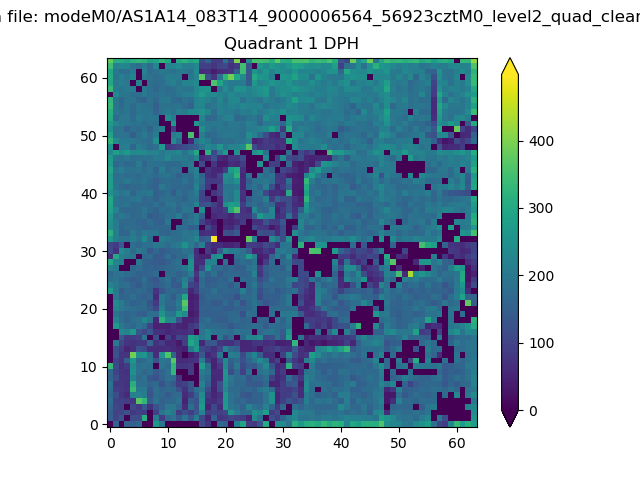 |
Quadrant B |
|---|---|---|---|
| Quadrant D | 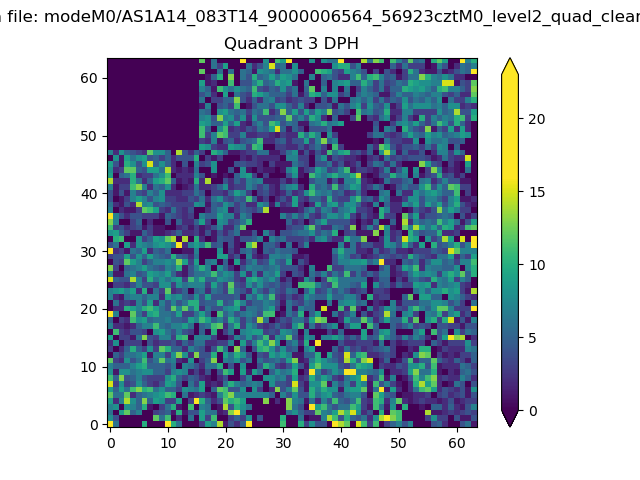 |
 |
Quadrant C |
| Plot type | Count rate plots | Images |
|---|---|---|
| Comparison with Poisson distribution Blue bars denote a histogram of data divided into 1 sec bins. Red curve is a Poisson curve with rate = median count rate of data. |
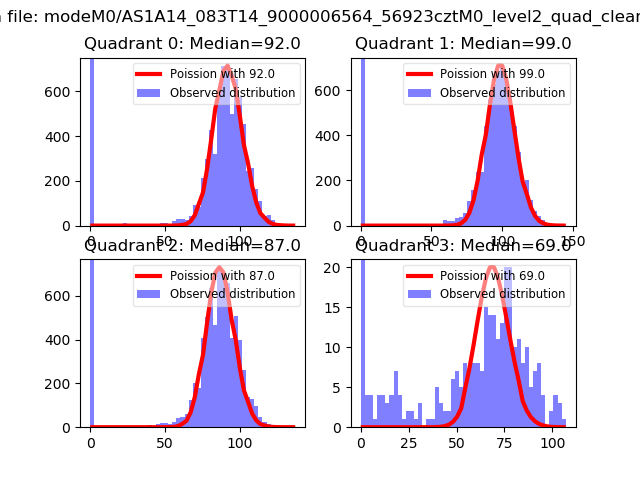 |
 |
| Quadrant-wise count rates Data is divided into 100 sec bins |
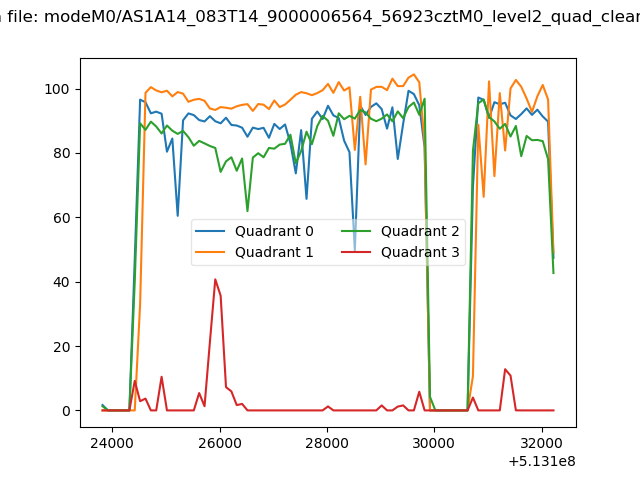 |
|
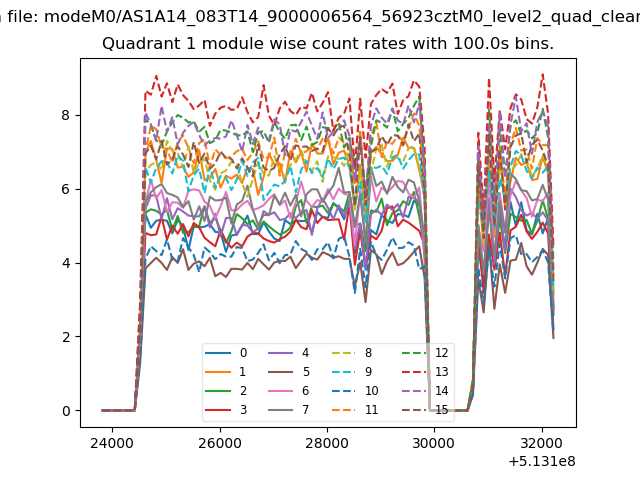
| Module-wise count rates for Quadrant A Data is divided into 100 sec bins |
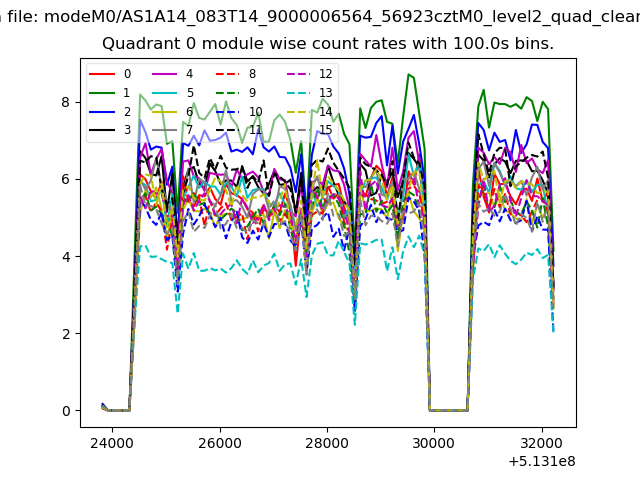 |
 |
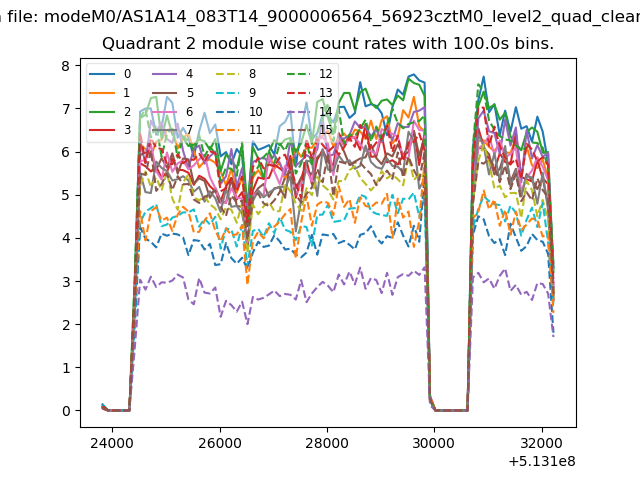
| Module-wise count rates for Quadrant B Data is divided into 100 sec bins |
 |
 |
| Module-wise count rates for Quadrant C Data is divided into 100 sec bins |
 |
 |
| Module-wise count rates for Quadrant D Data is divided into 100 sec bins |
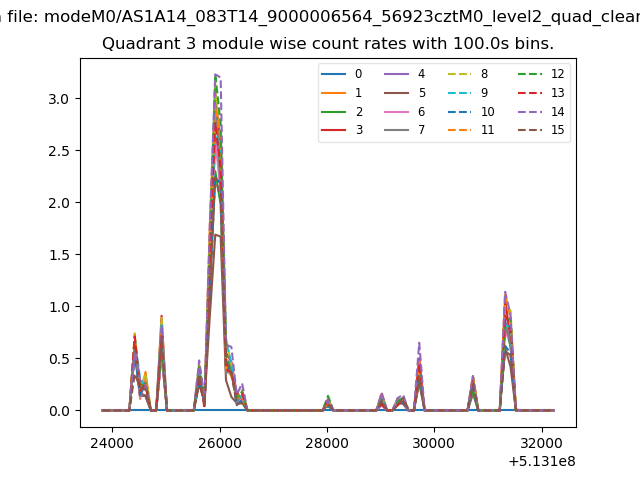 |
 |
| Parameter | Plot |
|---|---|
| CZT HV Monitor | 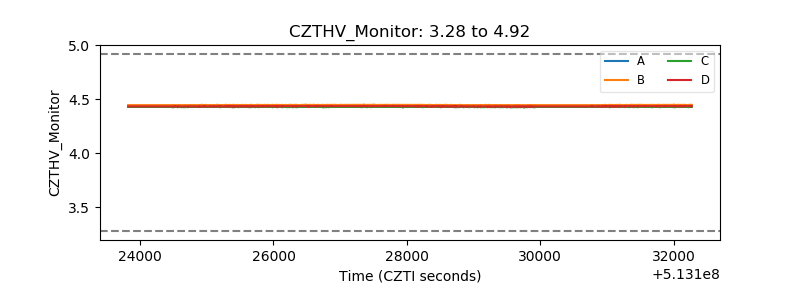 |
| D_VDD | 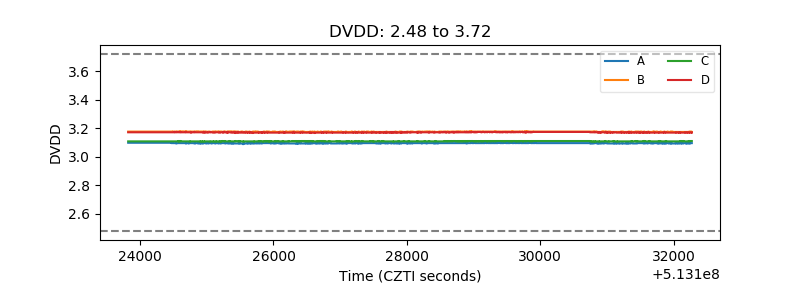 |
| Temperature 1 | 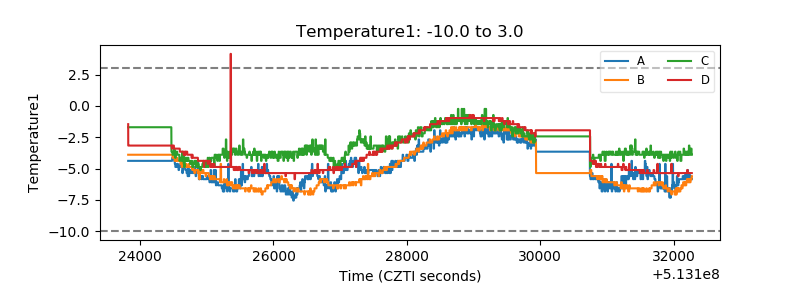 |
| Veto HV Monitor | 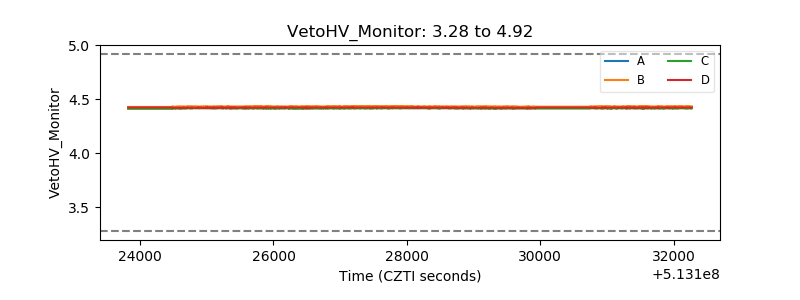 |
| Veto LLD | 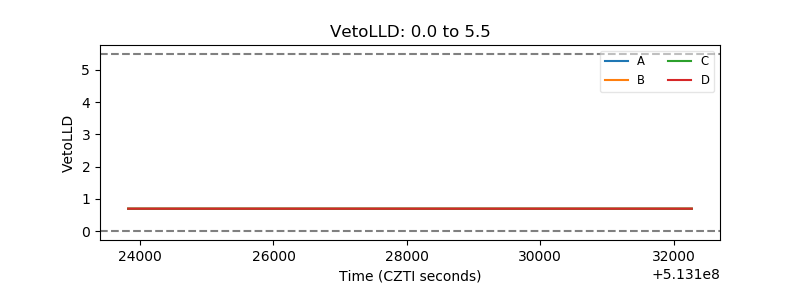 |
| Alpha Counter | 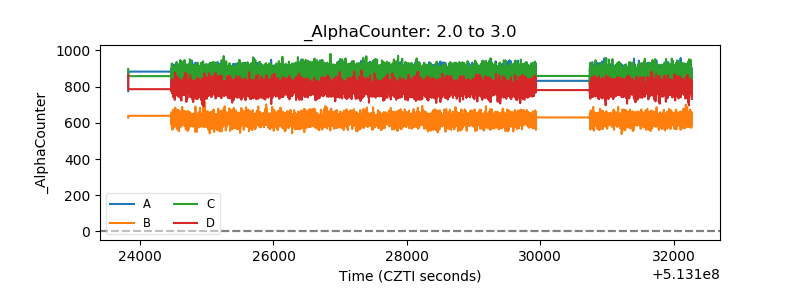 |
| _CPM_Rate | 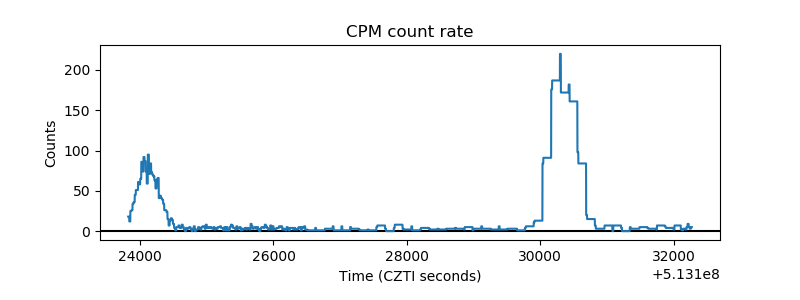 |
| CZT Counter | 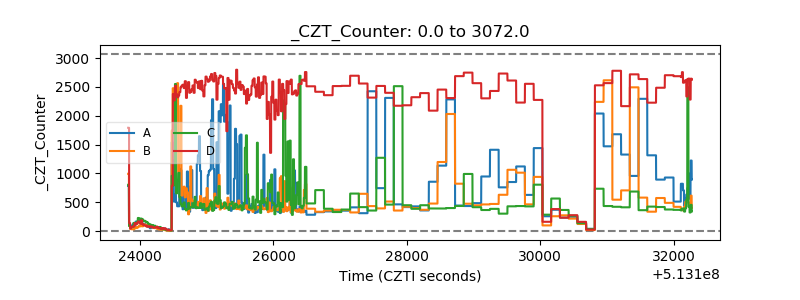 |
| +2.5 Volts monitor |  |
| +5 Volts monitor |  |
| _ROLL_ROT | 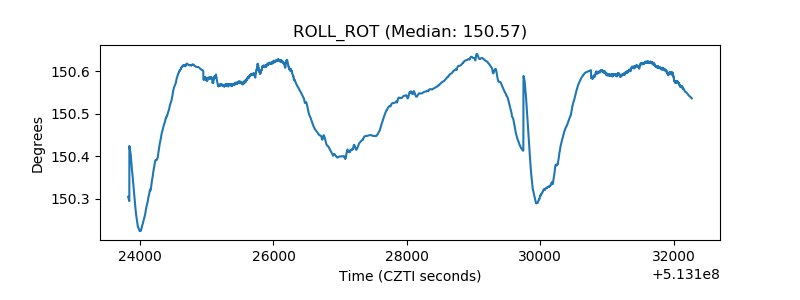 |
| _Roll_DEC | 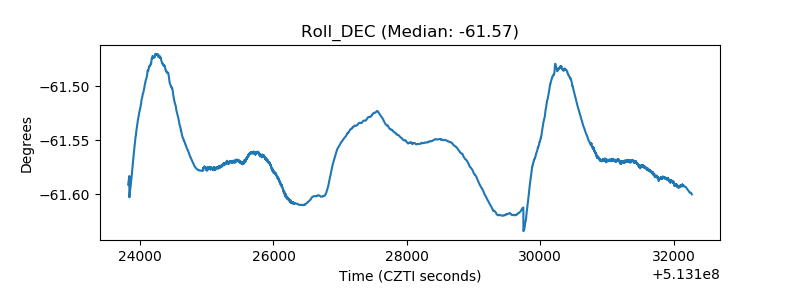 |
| _Roll_RA | 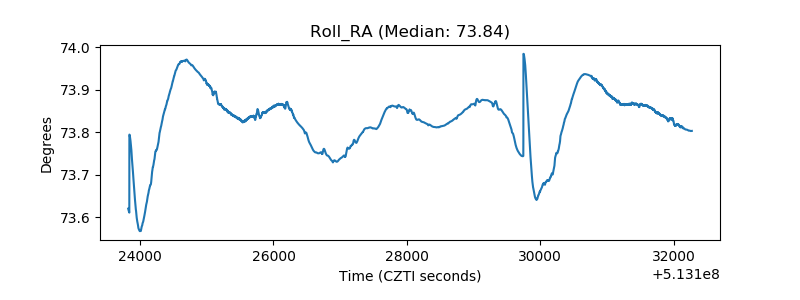 |
| Veto Counter | 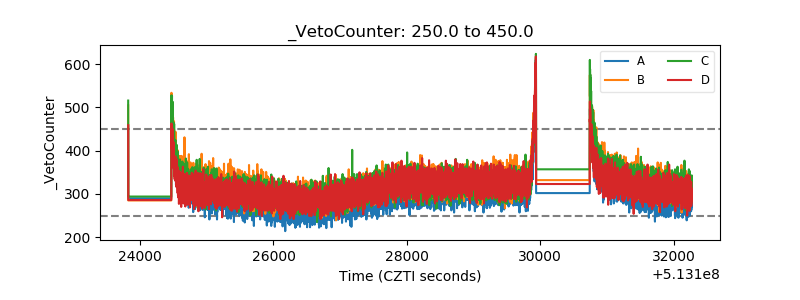 |