| Param | Original file | Final file |
|---|---|---|
| Filename | modeM0/AS1A14_083T14_9000006564_56924cztM0_level2.fits | modeM0/AS1A14_083T14_9000006564_56924cztM0_level2_quad_clean.evt |
| Size (bytes) | 850,530,240 | 78,370,560 |
| Size | 811.1 MB | 74.7 MB |
| Events in quadrant A | 4,573,759 | 639,231 |
| Events in quadrant B | 5,639,923 | 631,299 |
| Events in quadrant C | 3,347,048 | 615,008 |
| Events in quadrant D | 17,382,964 | 3,197 |
| Mode SS | |||
|---|---|---|---|
| Quadrant | BADHDUFLAG | Total packets | Discarded packets |
| A | 0 | 142 | 0 |
| B | 0 | 142 | 0 |
| C | 0 | 142 | 0 |
| D | 0 | 142 | 0 |
| Mode M9 | |||
|---|---|---|---|
| Quadrant | BADHDUFLAG | Total packets | Discarded packets |
| A | 0 | 18 | 0 |
| B | 0 | 18 | 0 |
| C | 0 | 18 | 0 |
| D | 0 | 18 | 0 |
| Mode M0 | |||
|---|---|---|---|
| Quadrant | BADHDUFLAG | Total packets | Discarded packets |
| A | 0 | 18814 | 2 |
| B | 0 | 21627 | 2 |
| C | 0 | 15270 | 2 |
| D | 0 | 56235 | 2 |
| Quadrant | Total seconds | Saturated seconds | Saturation percentage |
|---|---|---|---|
| A | 6951 | 238 | 3.423968% |
| B | 6952 | 818 | 11.766398% |
| C | 6952 | 91 | 1.308976% |
| D | 6952 | 6924 | 99.597238% |
Noise dominated data is calculated using 1-second bins in cleaned event files. If a bin has >2000 counts, and if more than 50% of those come from <1% of pixels, then it is considered to be noise-dominated and hence unusable.
| Quadrant | # 1 sec bins | Bins with >0 counts | Bins with >2000 counts | High rate bins dominated by noise | Noise dominated (total time) | Noise dominated (detector-on time) | Marked lightcurve |
|---|---|---|---|---|---|---|---|
| A | 8726 | 6951 | 151 | 151 | 1.73% | 2.17% | 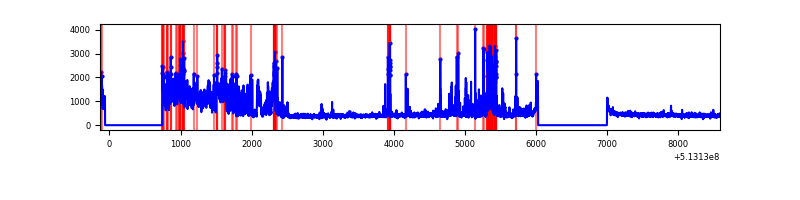 |
| B | 8727 | 6953 | 522 | 522 | 5.98% | 7.51% | 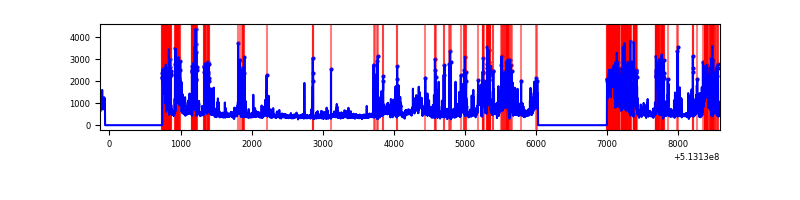 |
| C | 8727 | 6954 | 52 | 52 | 0.60% | 0.75% | 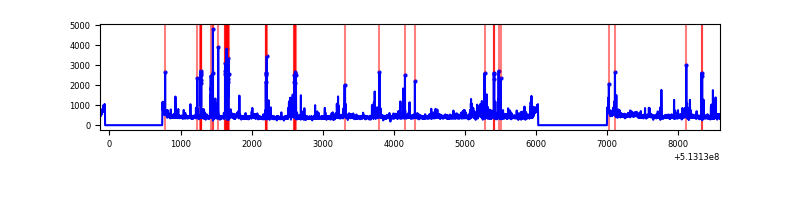 |
| D | 8726 | 6951 | 6789 | 6789 | 77.80% | 97.67% | 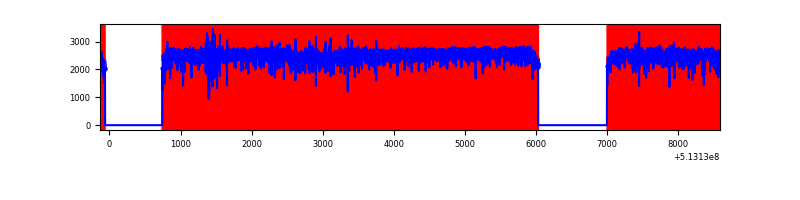 |
Top three noisy pixels from each quadrant. If the there are fewer than three noisy pixels in the level2.evt file, extra rows are filled as -1
| Pixel properties | Quadrant properties | ||||||
|---|---|---|---|---|---|---|---|
| Quadrant | DetID | PixID | Counts | Sigma | Mean | Median | Sigma |
| A | 7 | 64 | 1363870 | 7733.94 | 718 | 701 | 176.3 |
| A | 10 | 251 | 353905 | 2003.9 | 718 | 701 | 176.3 |
| A | 11 | 31 | 23559 | 129.68 | 718 | 701 | 176.3 |
| B | 5 | 172 | 1318101 | 9095.65 | 680 | 654 | 144.8 |
| B | 10 | 16 | 816488 | 5632.51 | 680 | 654 | 144.8 |
| B | 5 | 185 | 494712 | 3410.97 | 680 | 654 | 144.8 |
| C | 13 | 3 | 409121 | 2104.04 | 711 | 702 | 194.1 |
| C | 14 | 254 | 112808 | 577.53 | 711 | 702 | 194.1 |
| C | 9 | 237 | 21887 | 109.14 | 711 | 702 | 194.1 |
| D | 12 | 33 | 15392249 | 193995.04 | 274 | 262 | 79.3 |
| D | 8 | 160 | 458085 | 5770.24 | 274 | 262 | 79.3 |
| D | 8 | 240 | 124999 | 1572.14 | 274 | 262 | 79.3 |
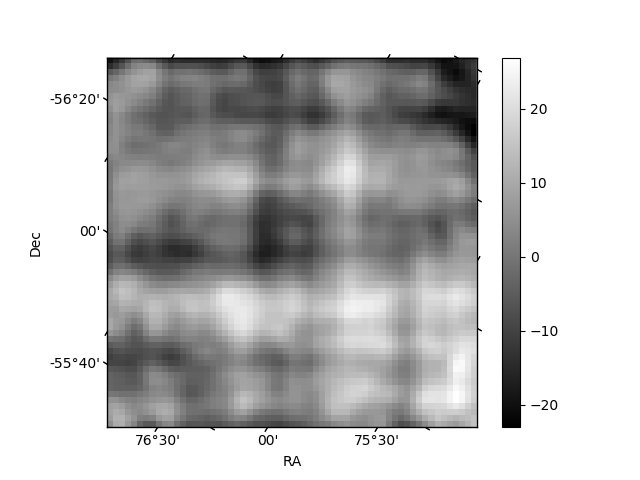
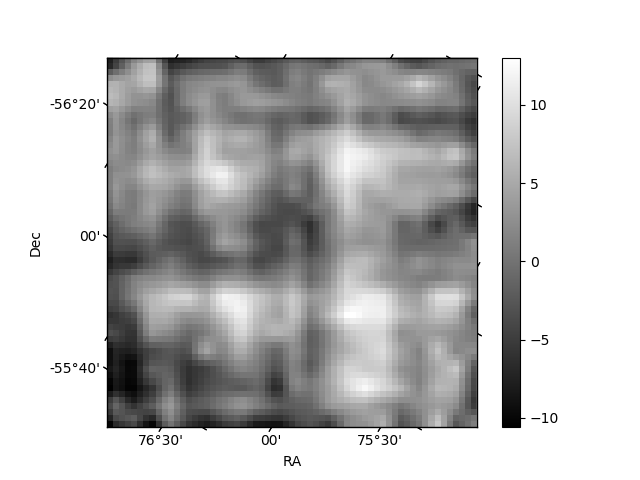
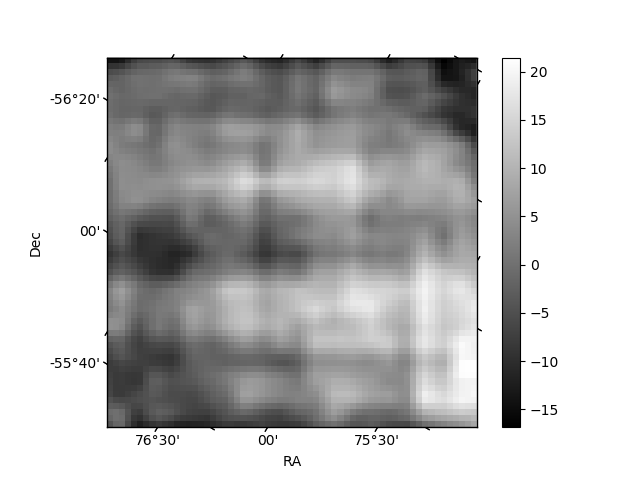
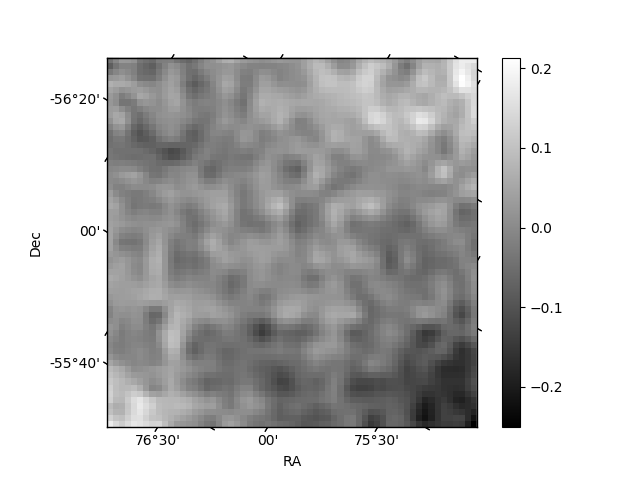
Histogram calculated using DETX and DETY for each event in the final _common_clean file
| Quadrant A | 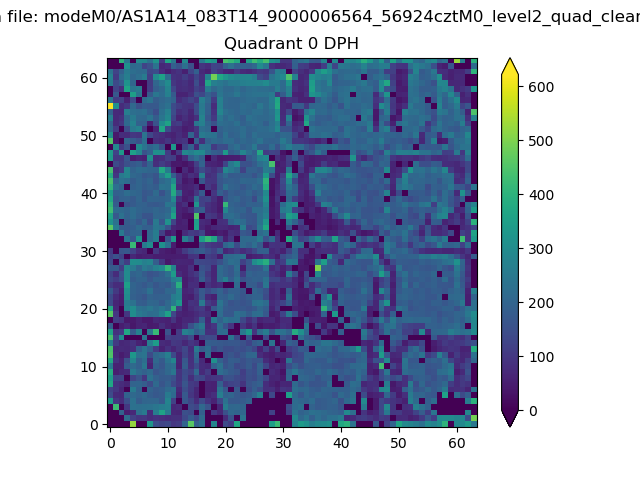 |
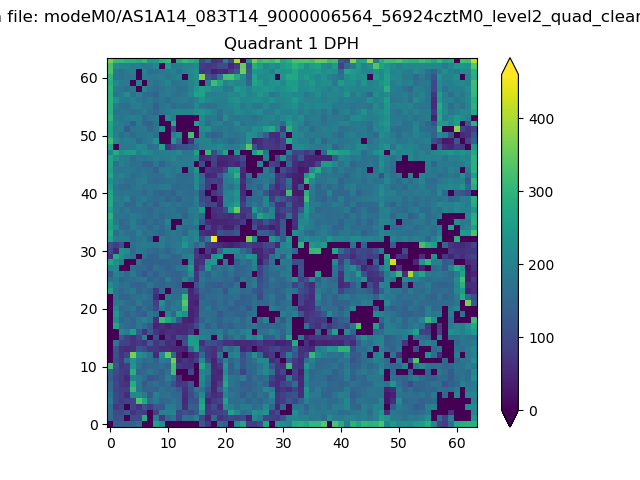 |
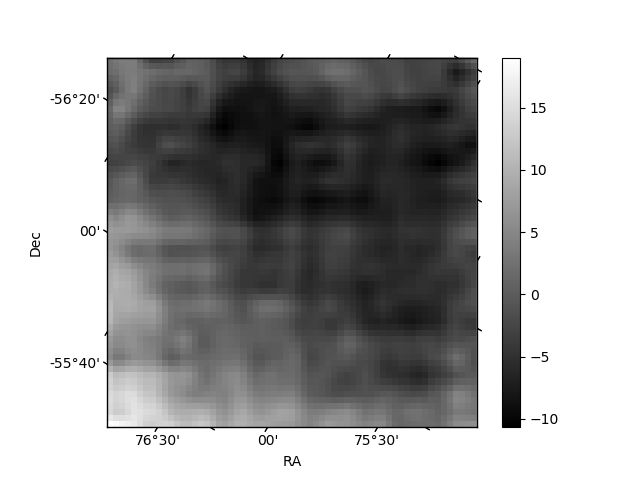
Quadrant B |
|---|---|---|---|
| Quadrant D | 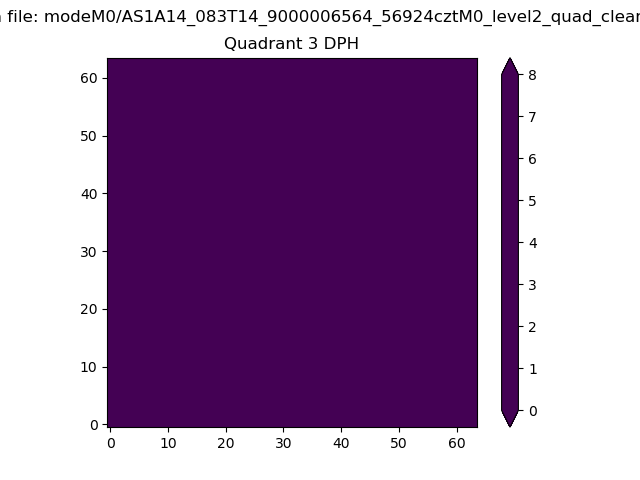 |
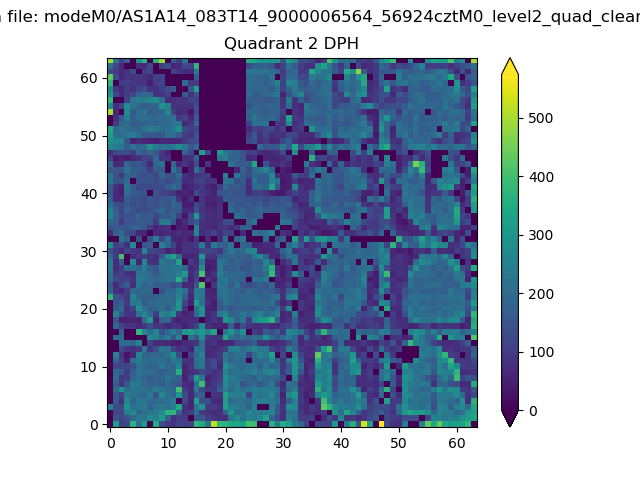 |
Quadrant C |
| Plot type | Count rate plots | Images |
|---|---|---|
| Comparison with Poisson distribution Blue bars denote a histogram of data divided into 1 sec bins. Red curve is a Poisson curve with rate = median count rate of data. |
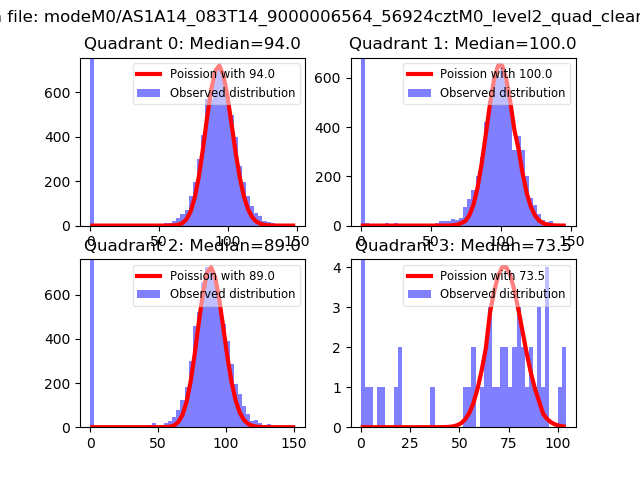 |
 |
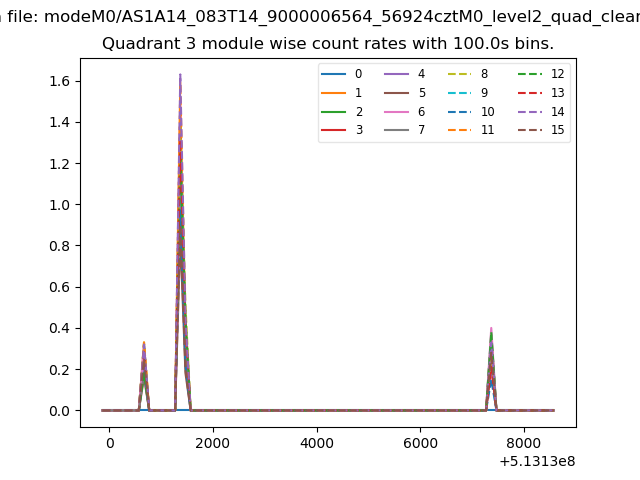
| Quadrant-wise count rates Data is divided into 100 sec bins |
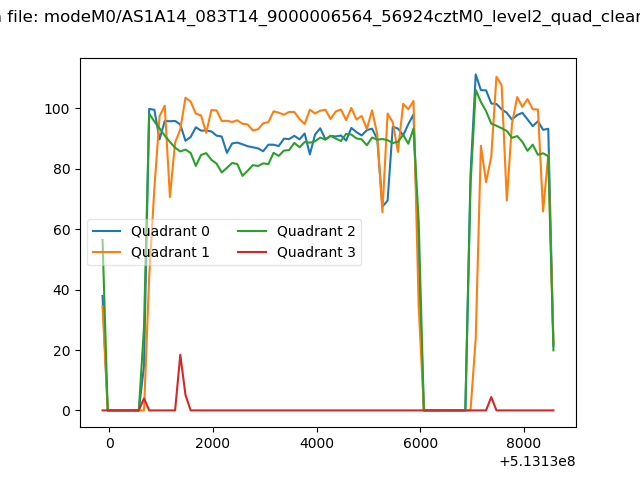 |
|
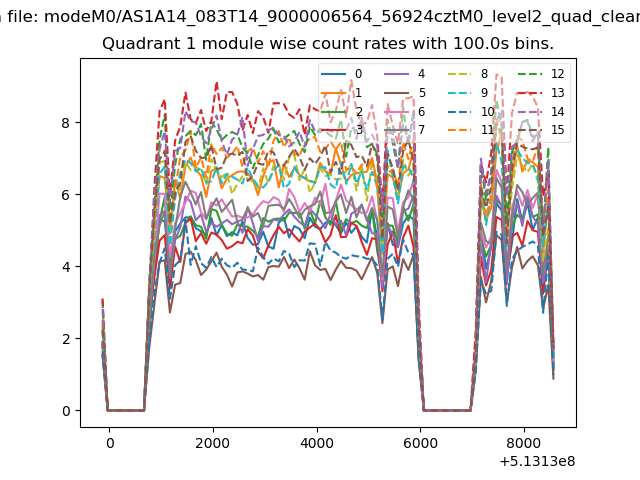
| Module-wise count rates for Quadrant A Data is divided into 100 sec bins |
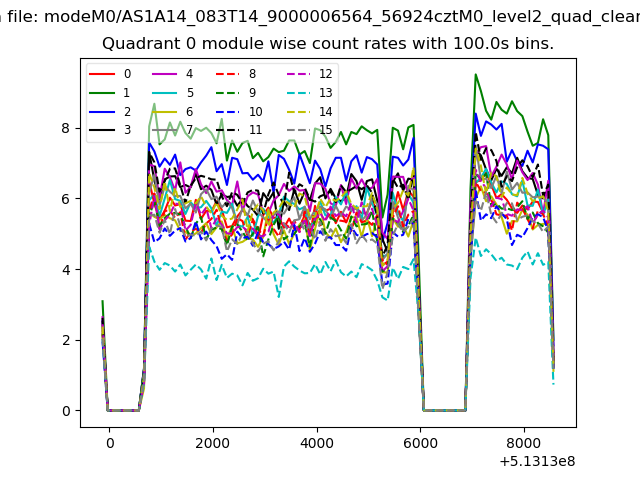 |
 |
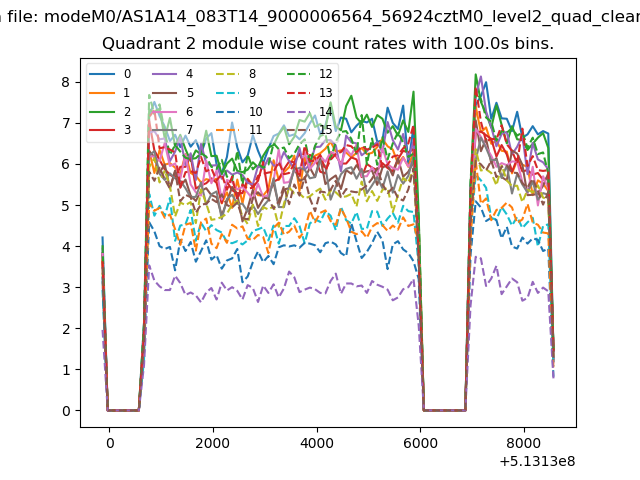
| Module-wise count rates for Quadrant B Data is divided into 100 sec bins |
 |
 |
| Module-wise count rates for Quadrant C Data is divided into 100 sec bins |
 |
 |
| Module-wise count rates for Quadrant D Data is divided into 100 sec bins |
 |
 |
| Parameter | Plot |
|---|---|
| CZT HV Monitor | 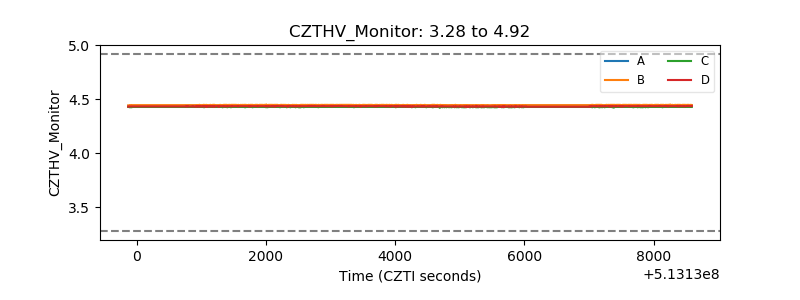 |
| D_VDD | 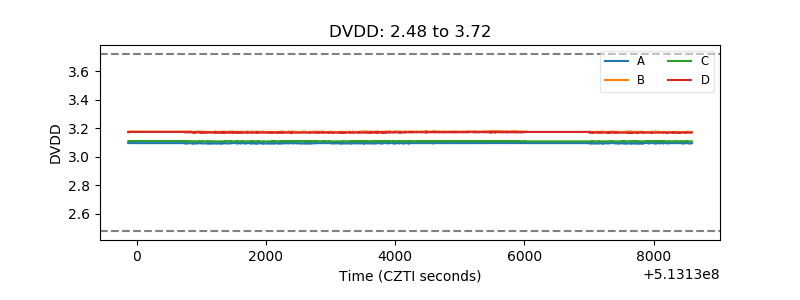 |
| Temperature 1 | 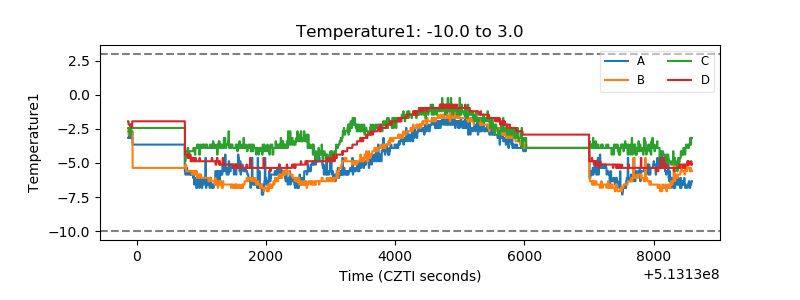 |
| Veto HV Monitor | 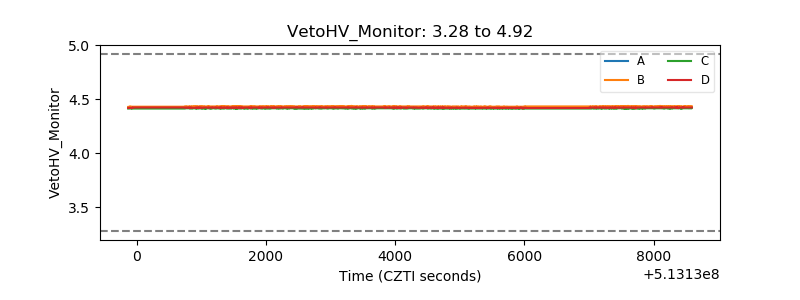 |
| Veto LLD | 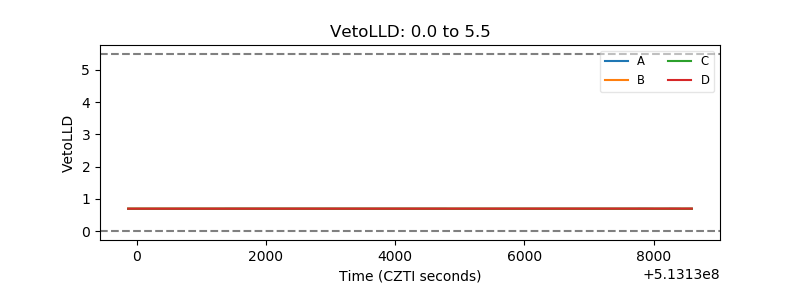 |
| Alpha Counter | 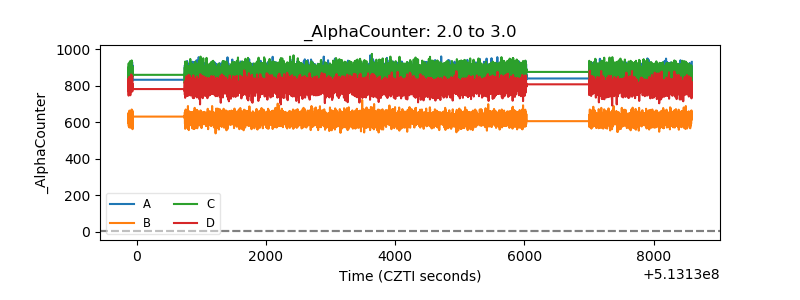 |
| _CPM_Rate | 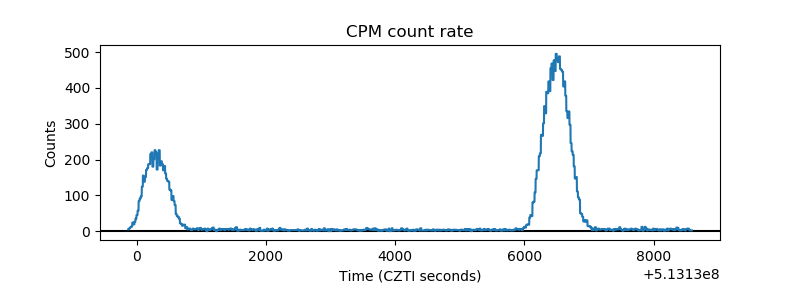 |
| CZT Counter | 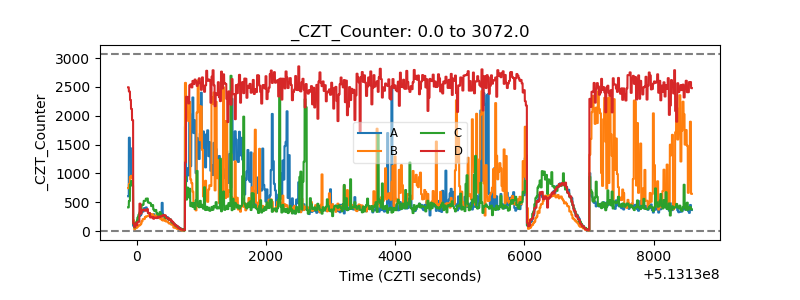 |
| +2.5 Volts monitor |  |
| +5 Volts monitor |  |
| _ROLL_ROT | 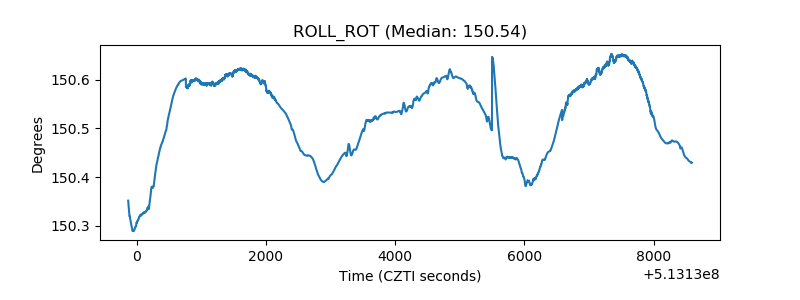 |
| _Roll_DEC | 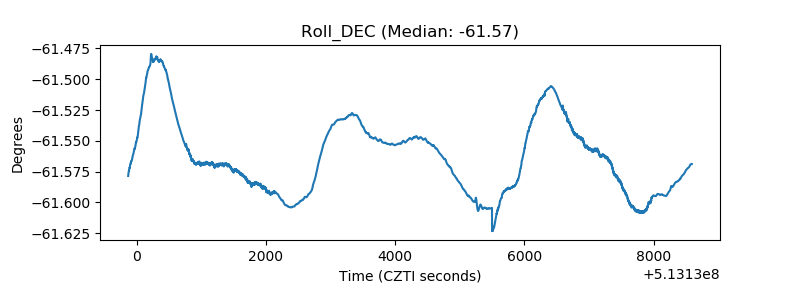 |
| _Roll_RA | 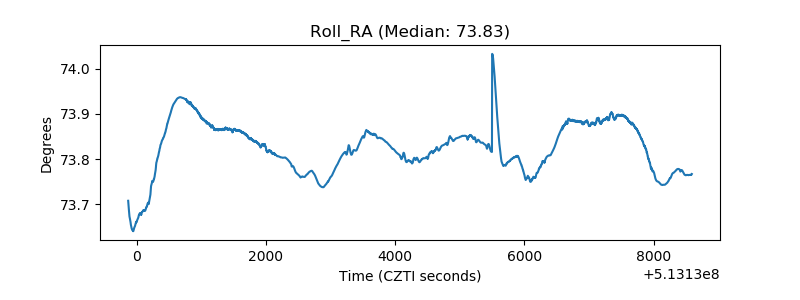 |
| Veto Counter | 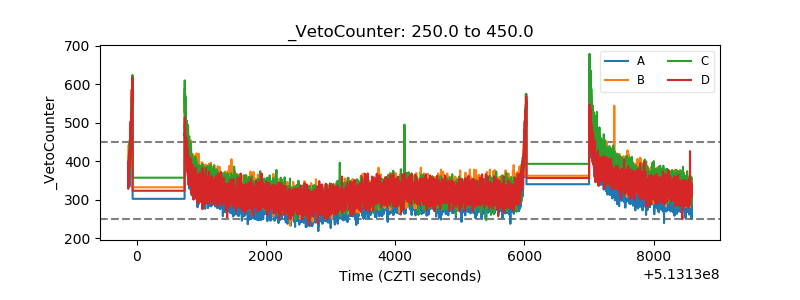 |