| Param | Original file | Final file |
|---|---|---|
| Filename | modeM0/AS1A14_083T14_9000006564_56926cztM0_level2.fits | modeM0/AS1A14_083T14_9000006564_56926cztM0_level2_quad_clean.evt |
| Size (bytes) | 865,437,120 | 60,782,400 |
| Size | 825.3 MB | 58.0 MB |
| Events in quadrant A | 7,428,655 | 364,853 |
| Events in quadrant B | 6,313,091 | 504,274 |
| Events in quadrant C | 3,188,396 | 540,974 |
| Events in quadrant D | 14,640,215 | 11,437 |
| Mode SS | |||
|---|---|---|---|
| Quadrant | BADHDUFLAG | Total packets | Discarded packets |
| A | 0 | 122 | 0 |
| B | 0 | 122 | 0 |
| C | 0 | 122 | 0 |
| D | 0 | 122 | 0 |
| Mode M9 | |||
|---|---|---|---|
| Quadrant | BADHDUFLAG | Total packets | Discarded packets |
| A | 0 | 10 | 0 |
| B | 0 | 10 | 0 |
| C | 0 | 10 | 0 |
| D | 0 | 10 | 0 |
| Mode M0 | |||
|---|---|---|---|
| Quadrant | BADHDUFLAG | Total packets | Discarded packets |
| A | 0 | 26600 | 1 |
| B | 0 | 23063 | 1 |
| C | 0 | 13969 | 1 |
| D | 0 | 47524 | 1 |
| Quadrant | Total seconds | Saturated seconds | Saturation percentage |
|---|---|---|---|
| A | 5993 | 2188 | 36.509261% |
| B | 5994 | 1292 | 21.554888% |
| C | 5994 | 181 | 3.019686% |
| D | 5994 | 5911 | 98.615282% |
Noise dominated data is calculated using 1-second bins in cleaned event files. If a bin has >2000 counts, and if more than 50% of those come from <1% of pixels, then it is considered to be noise-dominated and hence unusable.
| Quadrant | # 1 sec bins | Bins with >0 counts | Bins with >2000 counts | High rate bins dominated by noise | Noise dominated (total time) | Noise dominated (detector-on time) | Marked lightcurve |
|---|---|---|---|---|---|---|---|
| A | 7042 | 5992 | 2050 | 2050 | 29.11% | 34.21% | 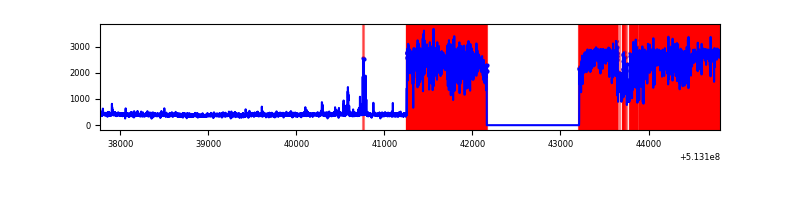 |
| B | 7044 | 5994 | 964 | 964 | 13.69% | 16.08% | 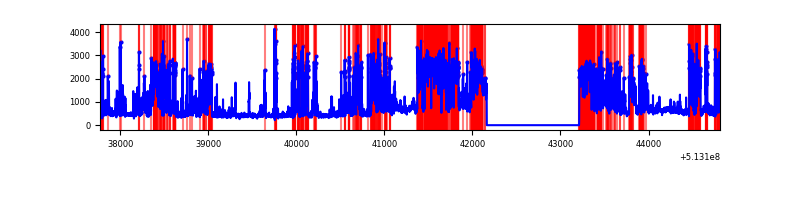 |
| C | 7044 | 5995 | 135 | 135 | 1.92% | 2.25% | 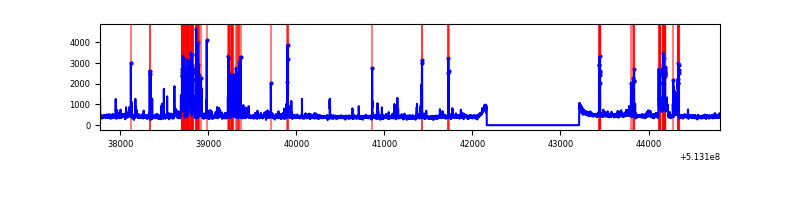 |
| D | 7043 | 5993 | 5575 | 5575 | 79.16% | 93.03% | 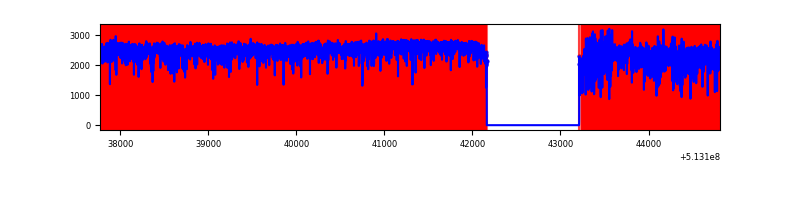 |
Top three noisy pixels from each quadrant. If the there are fewer than three noisy pixels in the level2.evt file, extra rows are filled as -1
| Pixel properties | Quadrant properties | ||||||
|---|---|---|---|---|---|---|---|
| Quadrant | DetID | PixID | Counts | Sigma | Mean | Median | Sigma |
| A | 7 | 64 | 5326144 | 41625.28 | 513 | 499 | 127.9 |
| A | 4 | 249 | 26524 | 203.41 | 513 | 499 | 127.9 |
| A | 8 | 249 | 21174 | 161.6 | 513 | 499 | 127.9 |
| B | 5 | 185 | 2707445 | 22420.66 | 564 | 541 | 120.7 |
| B | 5 | 172 | 706482 | 5847.15 | 564 | 541 | 120.7 |
| B | 10 | 16 | 389039 | 3217.84 | 564 | 541 | 120.7 |
| C | 13 | 3 | 647027 | 3879.36 | 615 | 607 | 166.6 |
| C | 14 | 254 | 76497 | 455.44 | 615 | 607 | 166.6 |
| C | 11 | 244 | 15045 | 86.65 | 615 | 607 | 166.6 |
| D | 12 | 33 | 11340869 | 173481.38 | 222 | 211 | 65.4 |
| D | 2 | 249 | 769835 | 11773.16 | 222 | 211 | 65.4 |
| D | 8 | 160 | 682621 | 10439.03 | 222 | 211 | 65.4 |
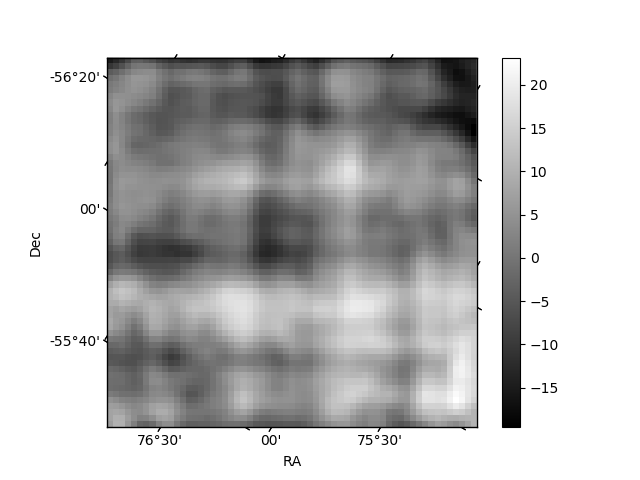
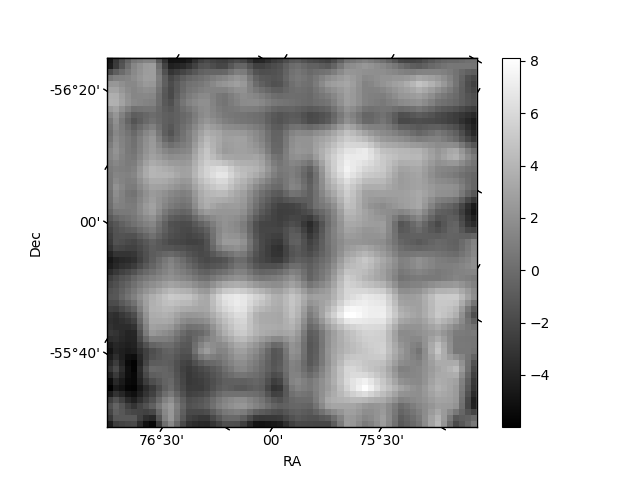
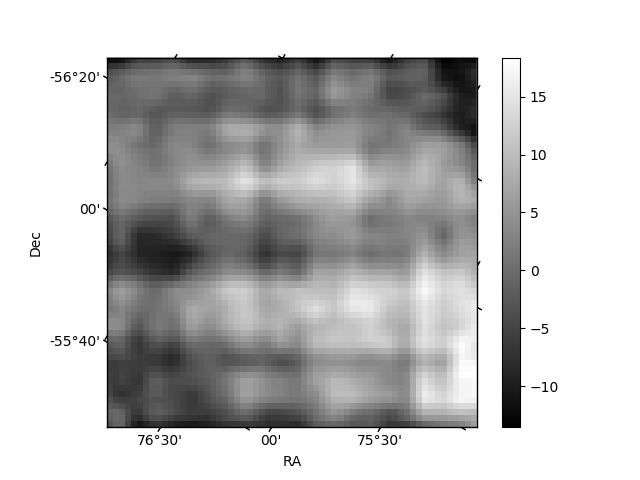
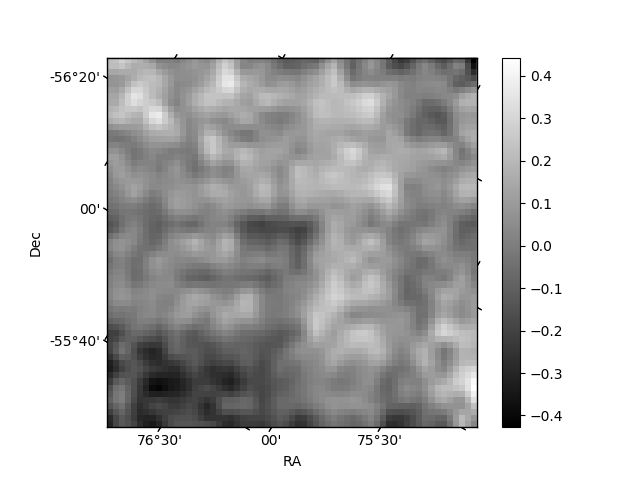
Histogram calculated using DETX and DETY for each event in the final _common_clean file
| Quadrant A | 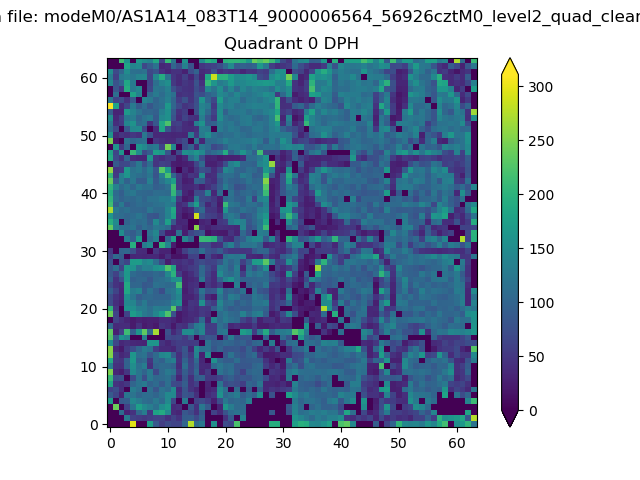 |
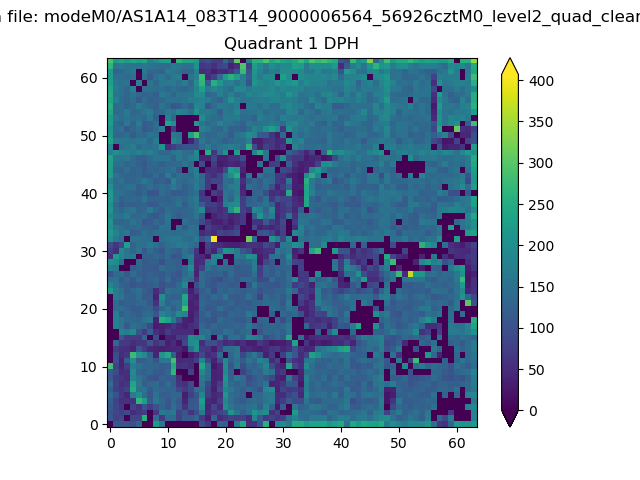 |
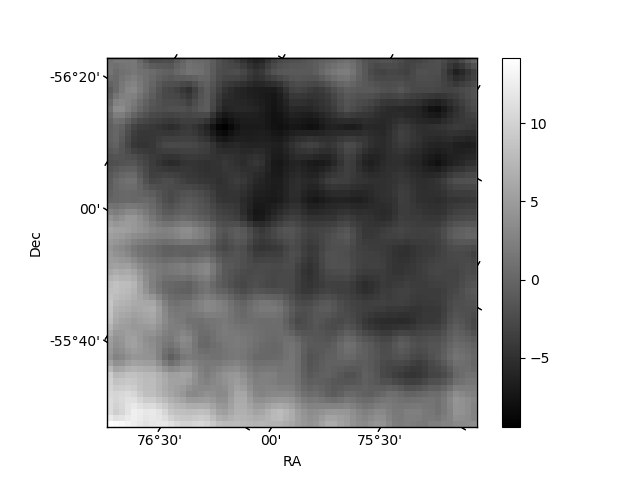
Quadrant B |
|---|---|---|---|
| Quadrant D | 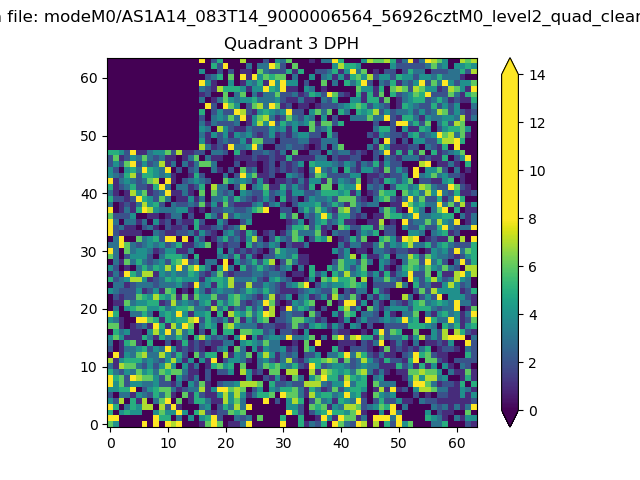 |
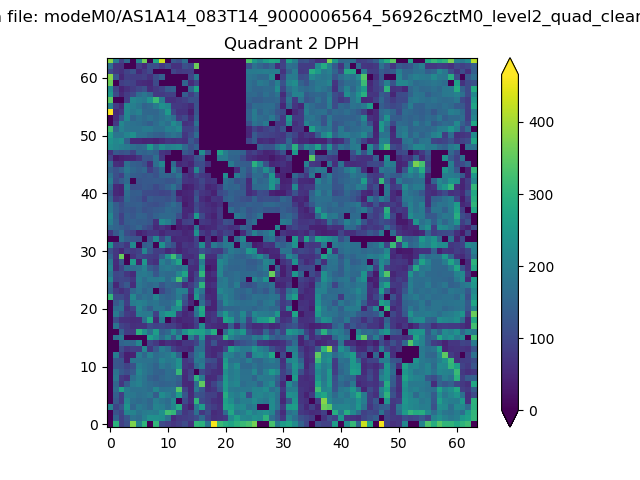 |
Quadrant C |
| Plot type | Count rate plots | Images |
|---|---|---|
| Comparison with Poisson distribution Blue bars denote a histogram of data divided into 1 sec bins. Red curve is a Poisson curve with rate = median count rate of data. |
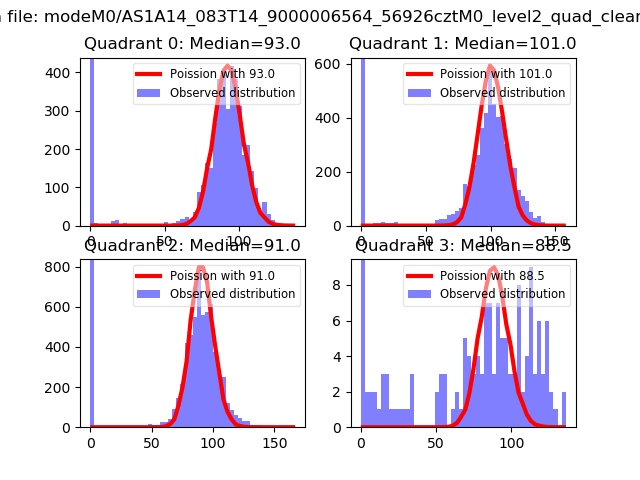 |
 |
| Quadrant-wise count rates Data is divided into 100 sec bins |
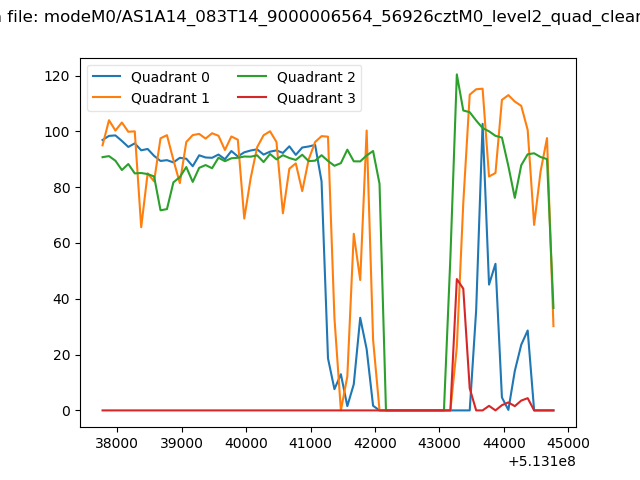 |
|
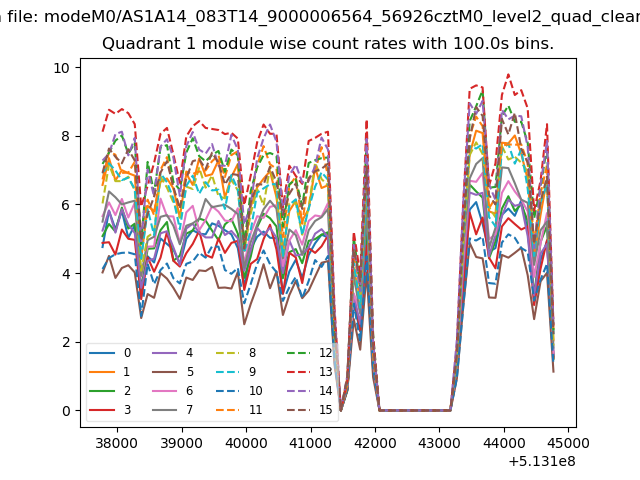
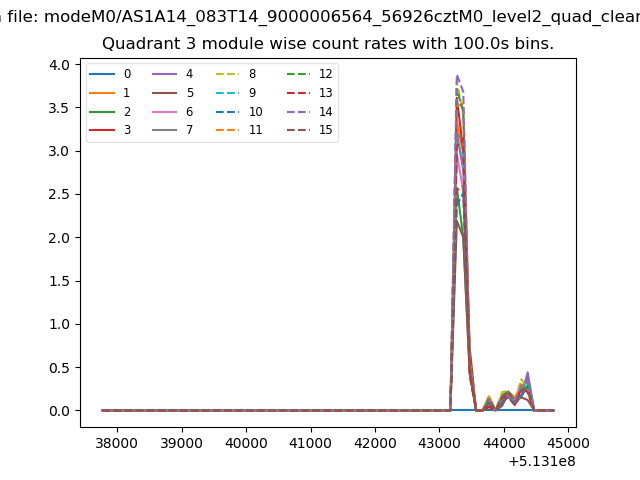
| Module-wise count rates for Quadrant A Data is divided into 100 sec bins |
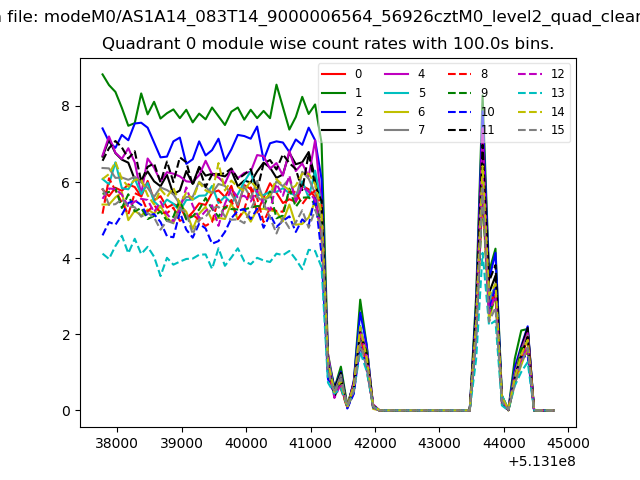 |
 |
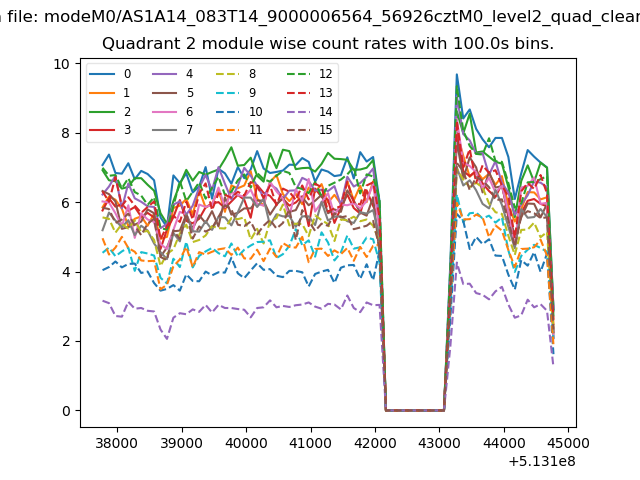
| Module-wise count rates for Quadrant B Data is divided into 100 sec bins |
 |
 |
| Module-wise count rates for Quadrant C Data is divided into 100 sec bins |
 |
 |
| Module-wise count rates for Quadrant D Data is divided into 100 sec bins |
 |
 |
| Parameter | Plot |
|---|---|
| CZT HV Monitor | 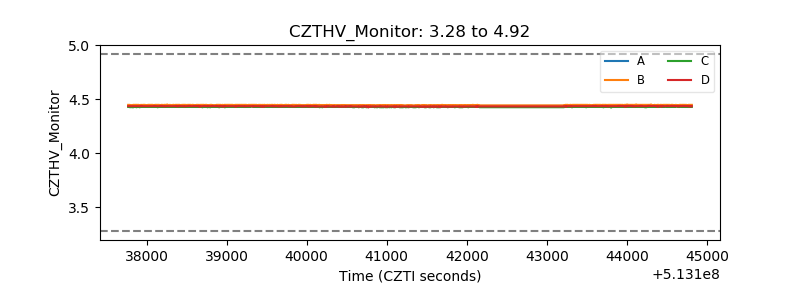 |
| D_VDD | 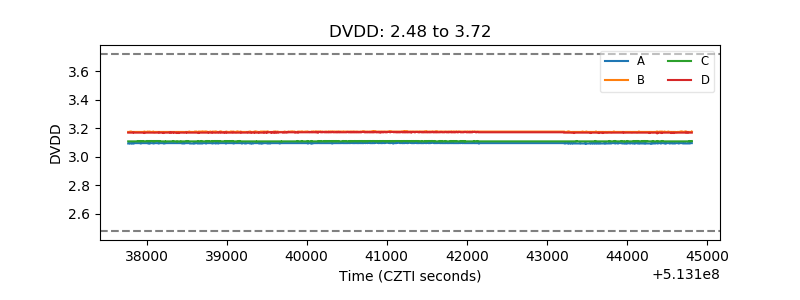 |
| Temperature 1 | 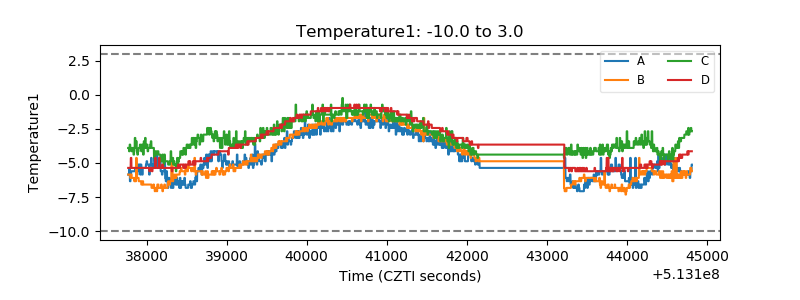 |
| Veto HV Monitor |  |
| Veto LLD | 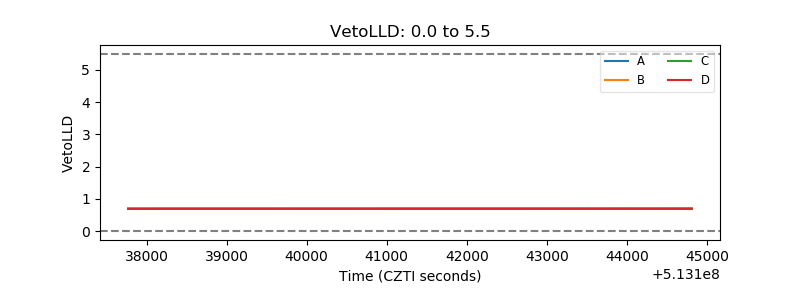 |
| Alpha Counter | 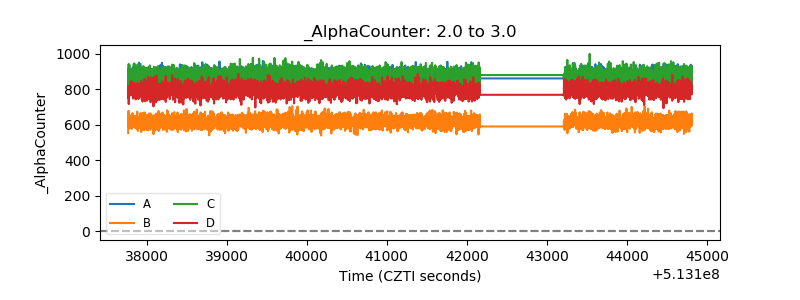 |
| _CPM_Rate | 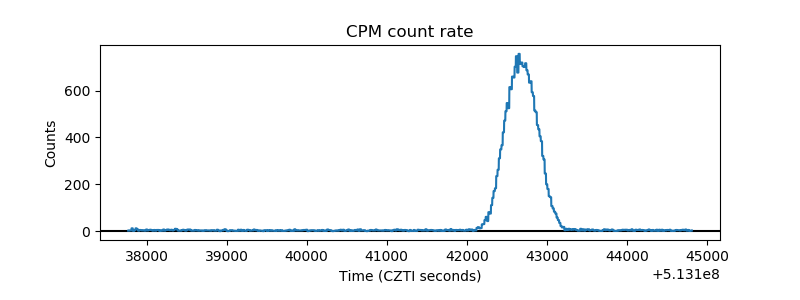 |
| CZT Counter | 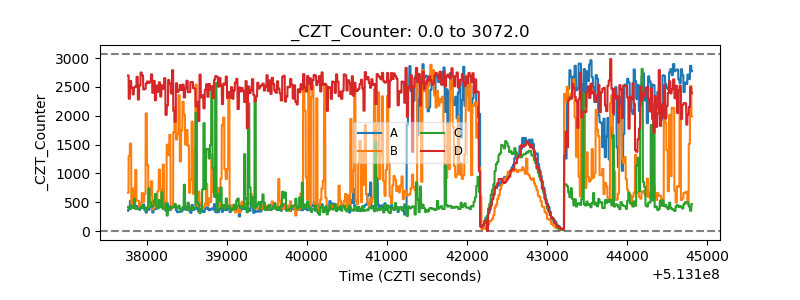 |
| +2.5 Volts monitor |  |
| +5 Volts monitor |  |
| _ROLL_ROT | 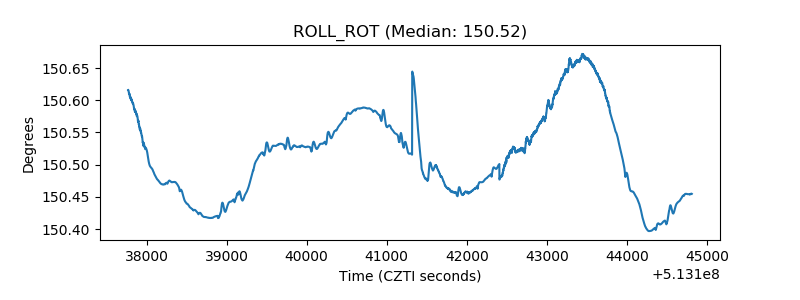 |
| _Roll_DEC | 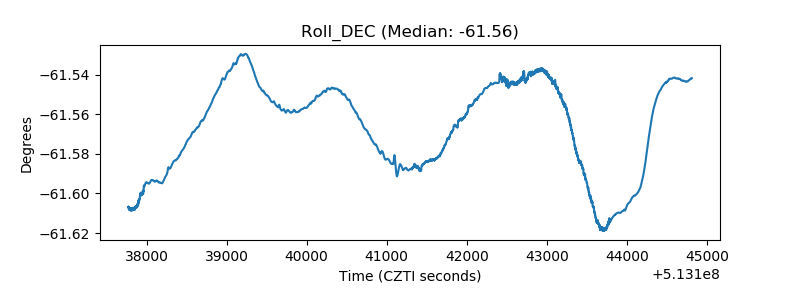 |
| _Roll_RA | 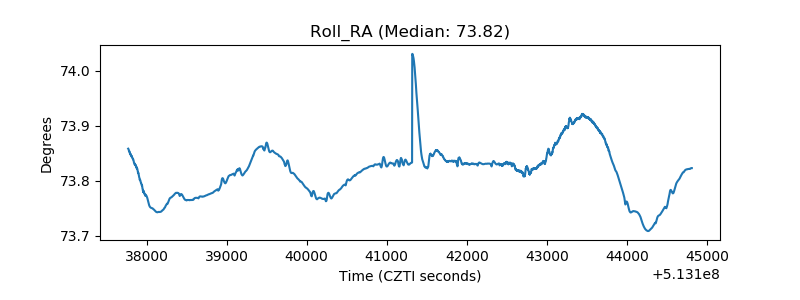 |
| Veto Counter | 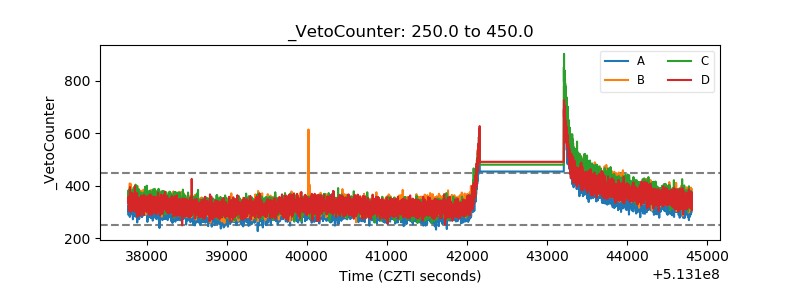 |