| Param | Original file | Final file |
|---|---|---|
| Filename | modeM0/AS1A14_083T14_9000006564_56927cztM0_level2.fits | modeM0/AS1A14_083T14_9000006564_56927cztM0_level2_quad_clean.evt |
| Size (bytes) | 1,064,658,240 | 56,511,360 |
| Size | 1015.3 MB | 53.9 MB |
| Events in quadrant A | 14,481,254 | 145,092 |
| Events in quadrant B | 7,266,643 | 533,989 |
| Events in quadrant C | 3,793,790 | 565,541 |
| Events in quadrant D | 13,394,359 | 37,780 |
| Mode SS | |||
|---|---|---|---|
| Quadrant | BADHDUFLAG | Total packets | Discarded packets |
| A | 0 | 124 | 0 |
| B | 0 | 124 | 0 |
| C | 0 | 124 | 0 |
| D | 0 | 124 | 0 |
| Mode M9 | |||
|---|---|---|---|
| Quadrant | BADHDUFLAG | Total packets | Discarded packets |
| A | 0 | 12 | 0 |
| B | 0 | 12 | 0 |
| C | 0 | 12 | 0 |
| D | 0 | 12 | 0 |
| Mode M0 | |||
|---|---|---|---|
| Quadrant | BADHDUFLAG | Total packets | Discarded packets |
| A | 0 | 47225 | 1 |
| B | 0 | 25921 | 1 |
| C | 0 | 15662 | 1 |
| D | 0 | 43946 | 1 |
| Quadrant | Total seconds | Saturated seconds | Saturation percentage |
|---|---|---|---|
| A | 6135 | 4976 | 81.108394% |
| B | 6136 | 1405 | 22.897653% |
| C | 6136 | 324 | 5.280313% |
| D | 6136 | 5858 | 95.469361% |
Noise dominated data is calculated using 1-second bins in cleaned event files. If a bin has >2000 counts, and if more than 50% of those come from <1% of pixels, then it is considered to be noise-dominated and hence unusable.
| Quadrant | # 1 sec bins | Bins with >0 counts | Bins with >2000 counts | High rate bins dominated by noise | Noise dominated (total time) | Noise dominated (detector-on time) | Marked lightcurve |
|---|---|---|---|---|---|---|---|
| A | 7269 | 6134 | 4795 | 4795 | 65.97% | 78.17% | 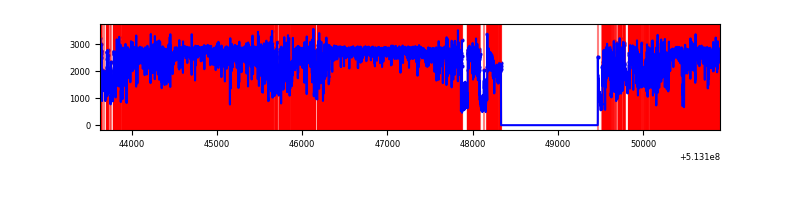 |
| B | 7271 | 6136 | 1028 | 1028 | 14.14% | 16.75% | 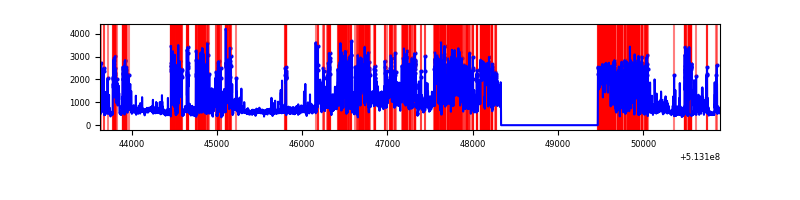 |
| C | 7271 | 6136 | 191 | 191 | 2.63% | 3.11% | 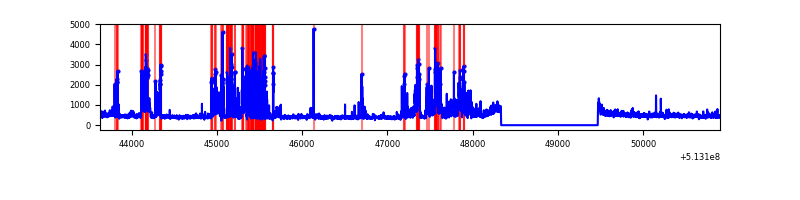 |
| D | 7271 | 6136 | 4547 | 4547 | 62.54% | 74.10% | 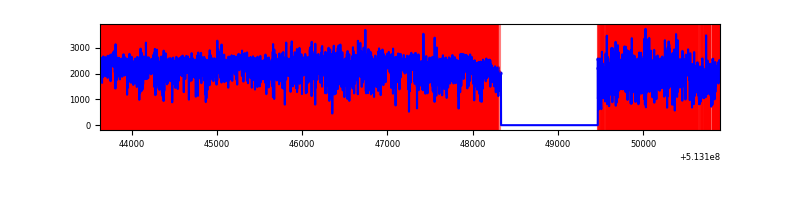 |
Top three noisy pixels from each quadrant. If the there are fewer than three noisy pixels in the level2.evt file, extra rows are filled as -1
| Pixel properties | Quadrant properties | ||||||
|---|---|---|---|---|---|---|---|
| Quadrant | DetID | PixID | Counts | Sigma | Mean | Median | Sigma |
| A | 7 | 64 | 12967725 | 136868.27 | 374 | 364 | 94.7 |
| A | 10 | 251 | 39069 | 408.52 | 374 | 364 | 94.7 |
| A | 3 | 14 | 9744 | 99.0 | 374 | 364 | 94.7 |
| B | 5 | 185 | 3088838 | 25320.73 | 585 | 566 | 122.0 |
| B | 10 | 16 | 875165 | 7170.83 | 585 | 566 | 122.0 |
| B | 5 | 172 | 424924 | 3479.31 | 585 | 566 | 122.0 |
| C | 13 | 3 | 1039366 | 5946.37 | 639 | 632 | 174.7 |
| C | 15 | 230 | 163659 | 933.27 | 639 | 632 | 174.7 |
| C | 14 | 254 | 45912 | 259.21 | 639 | 632 | 174.7 |
| D | 12 | 33 | 11158098 | 144630.3 | 268 | 256 | 77.1 |
| D | 2 | 249 | 357282 | 4627.85 | 268 | 256 | 77.1 |
| D | 8 | 160 | 352838 | 4570.24 | 268 | 256 | 77.1 |
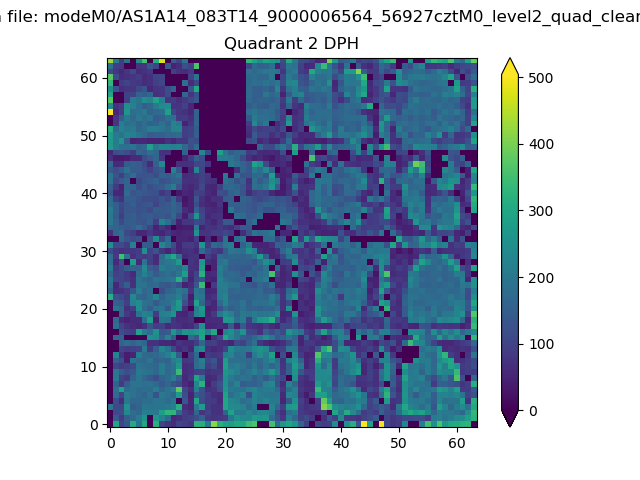
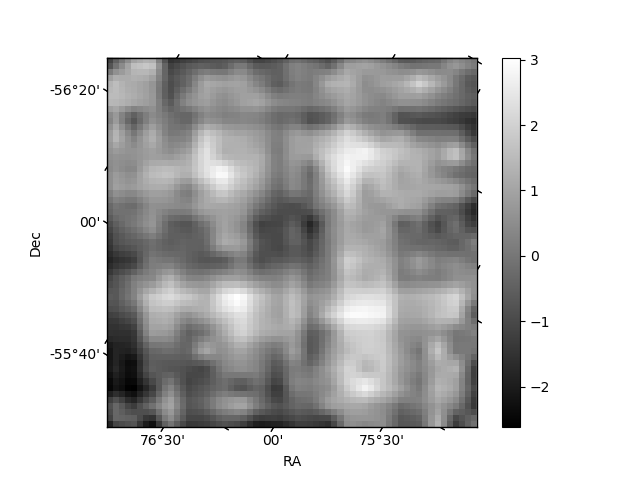
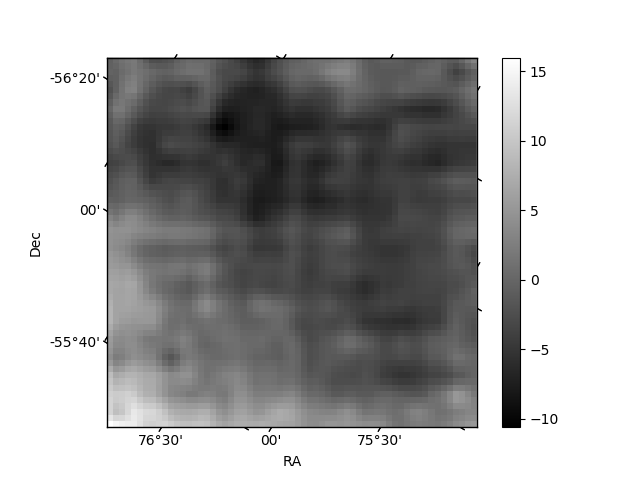
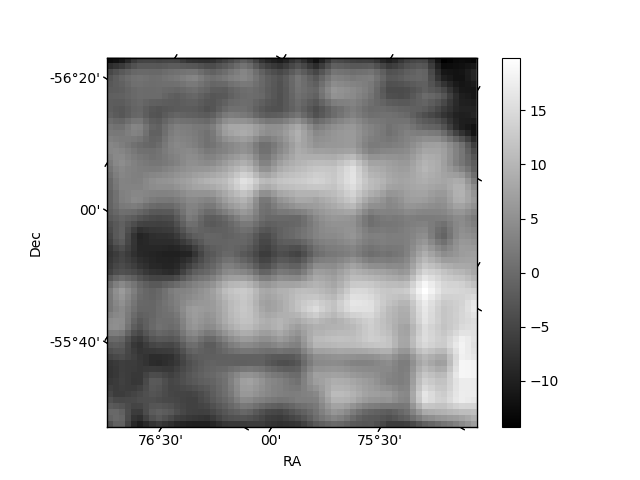
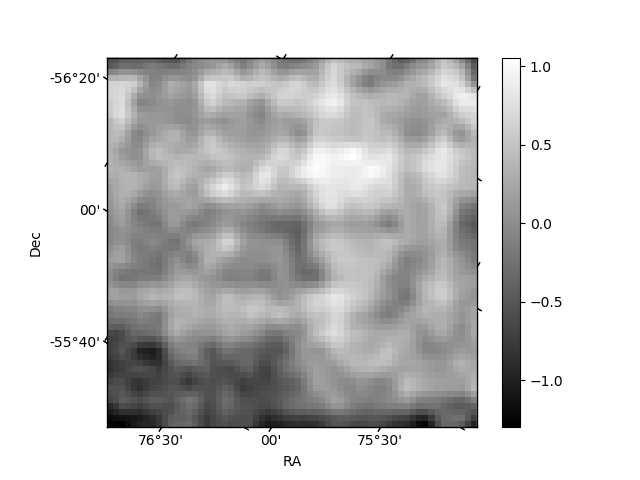
Histogram calculated using DETX and DETY for each event in the final _common_clean file
| Quadrant A | 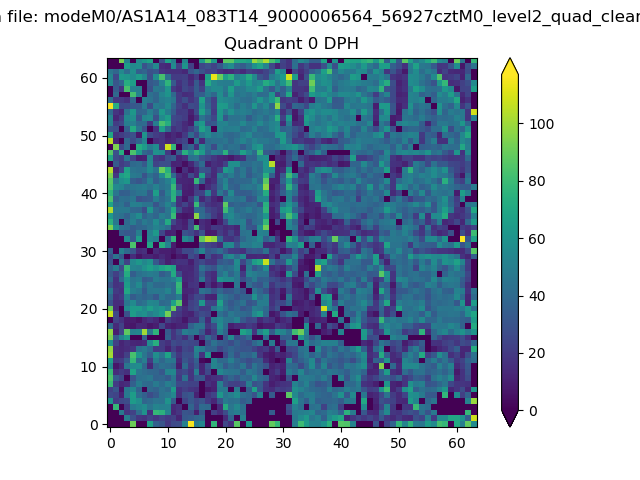 |
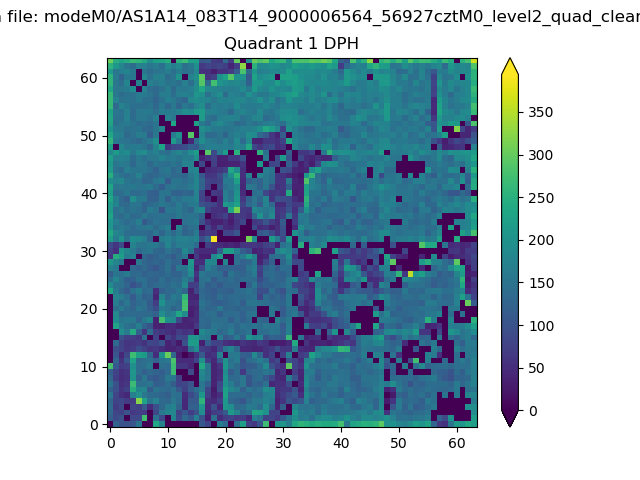 |
Quadrant B |
|---|---|---|---|
| Quadrant D | 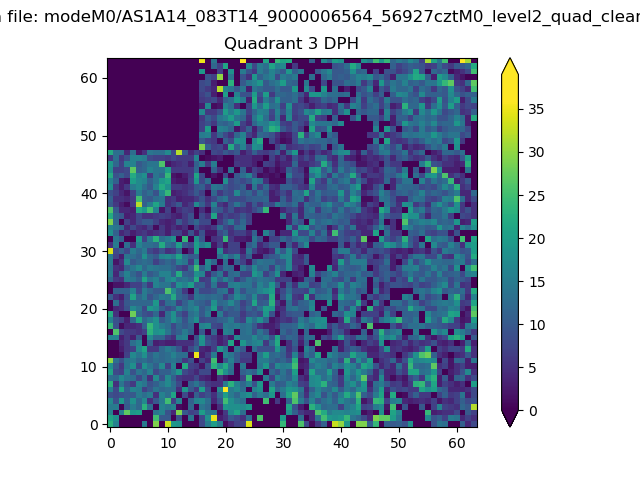 |
 |
Quadrant C |
| Plot type | Count rate plots | Images |
|---|---|---|
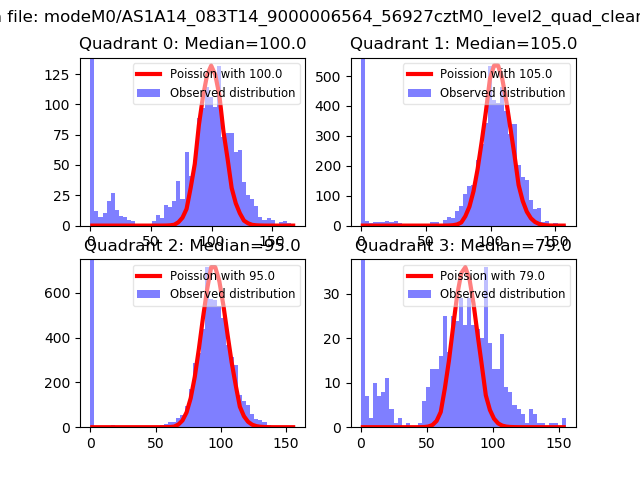
| Comparison with Poisson distribution Blue bars denote a histogram of data divided into 1 sec bins. Red curve is a Poisson curve with rate = median count rate of data. |
 |
 |
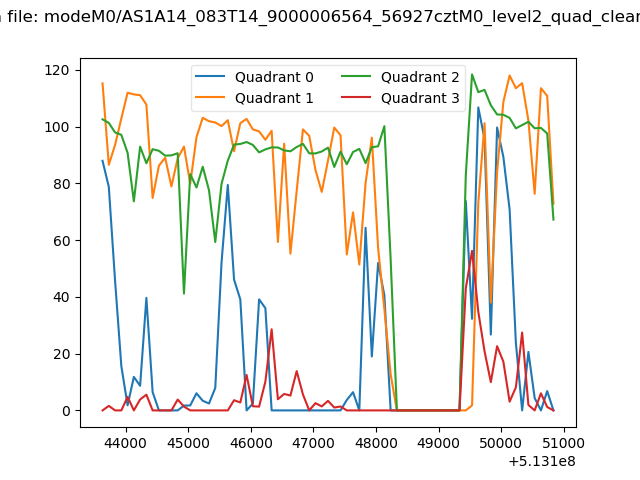
| Quadrant-wise count rates Data is divided into 100 sec bins |
 |
|
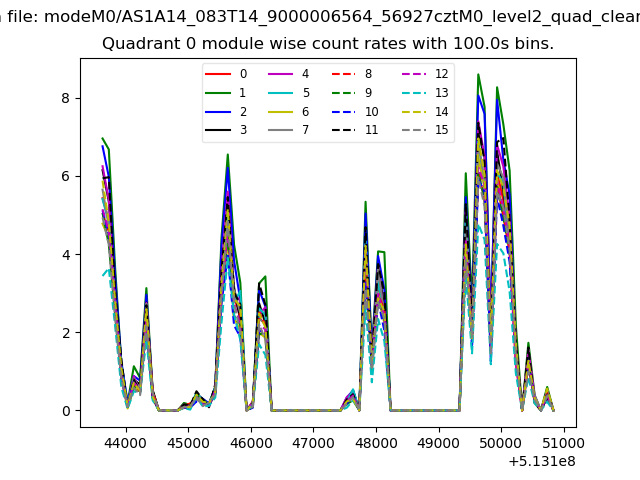
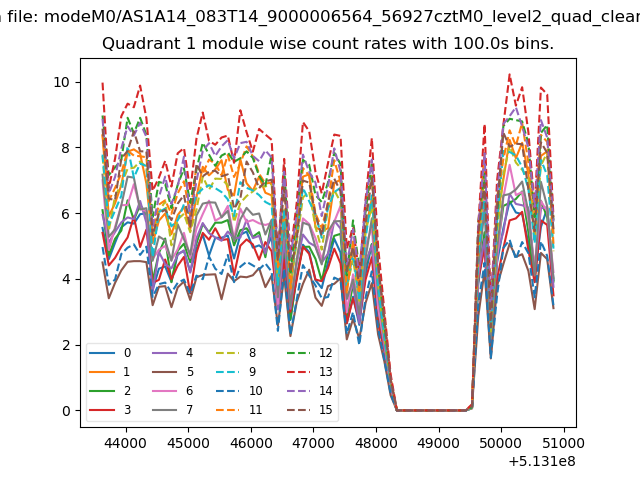
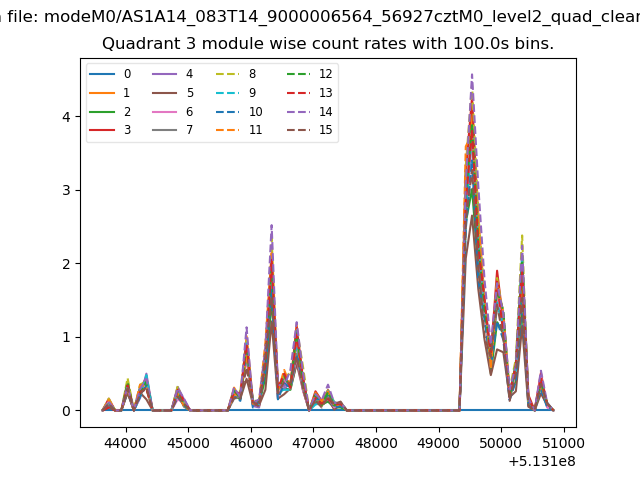
| Module-wise count rates for Quadrant A Data is divided into 100 sec bins |
 |
 |
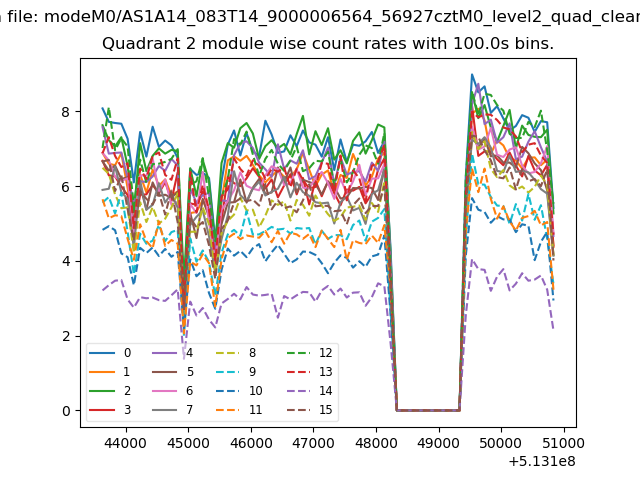
| Module-wise count rates for Quadrant B Data is divided into 100 sec bins |
 |
 |
| Module-wise count rates for Quadrant C Data is divided into 100 sec bins |
 |
 |
| Module-wise count rates for Quadrant D Data is divided into 100 sec bins |
 |
 |
| Parameter | Plot |
|---|---|
| CZT HV Monitor | 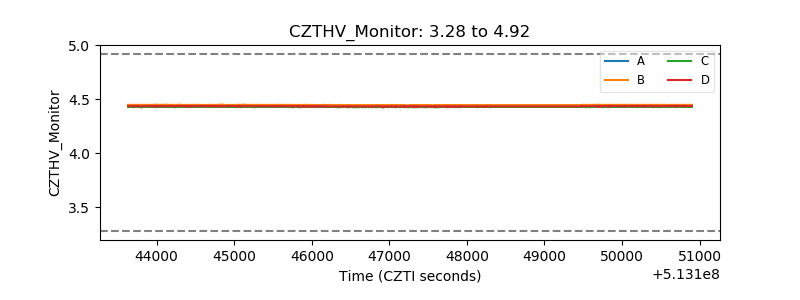 |
| D_VDD | 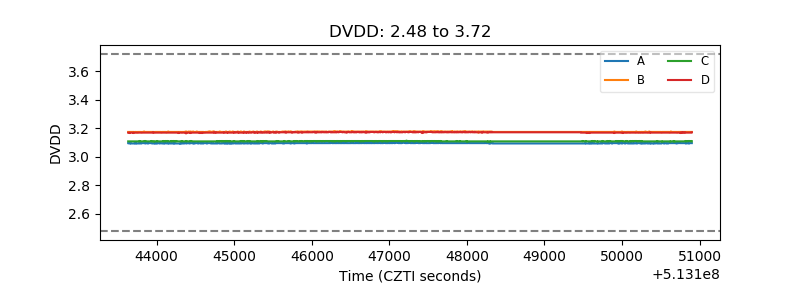 |
| Temperature 1 | 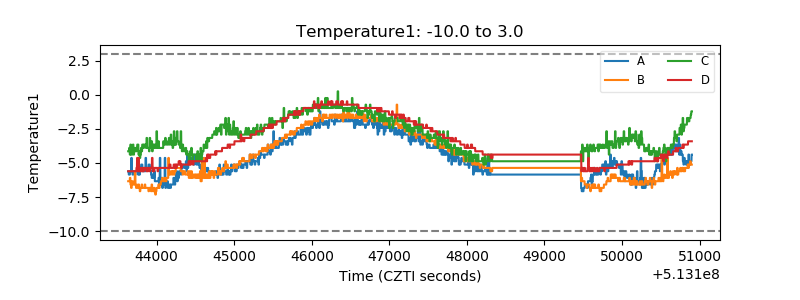 |
| Veto HV Monitor | 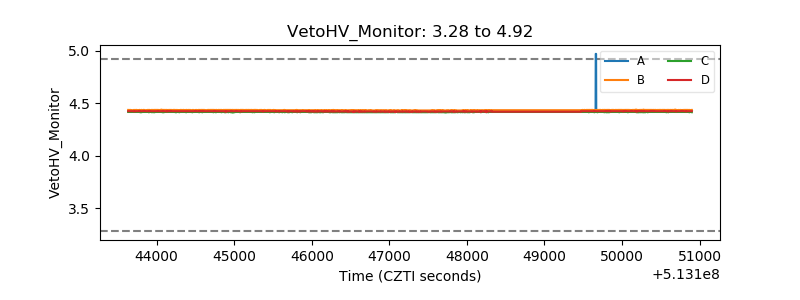 |
| Veto LLD | 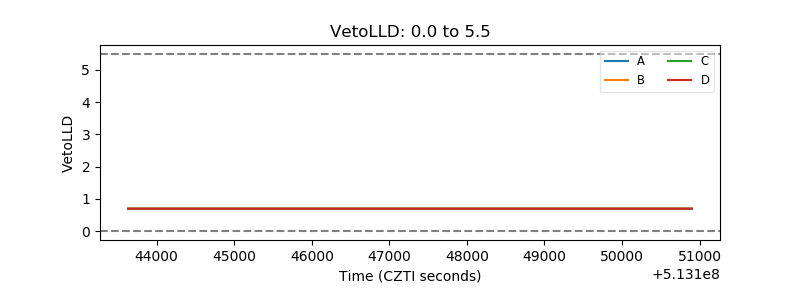 |
| Alpha Counter | 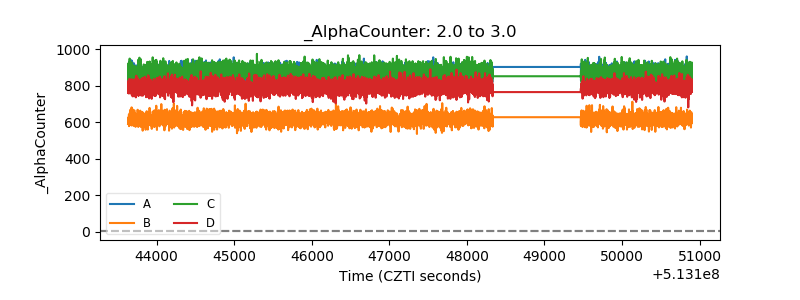 |
| _CPM_Rate | 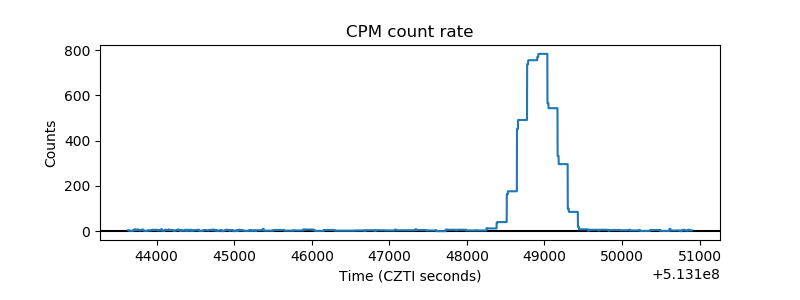 |
| CZT Counter | 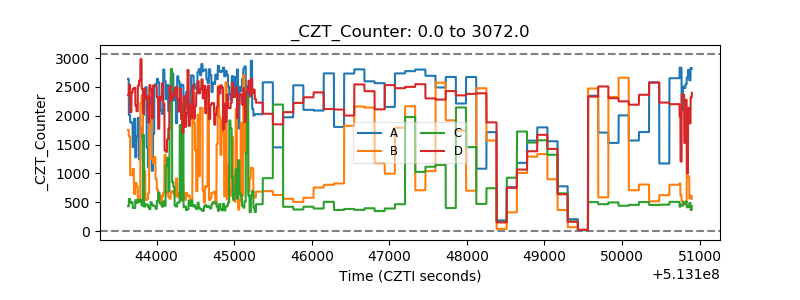 |
| +2.5 Volts monitor |  |
| +5 Volts monitor |  |
| _ROLL_ROT | 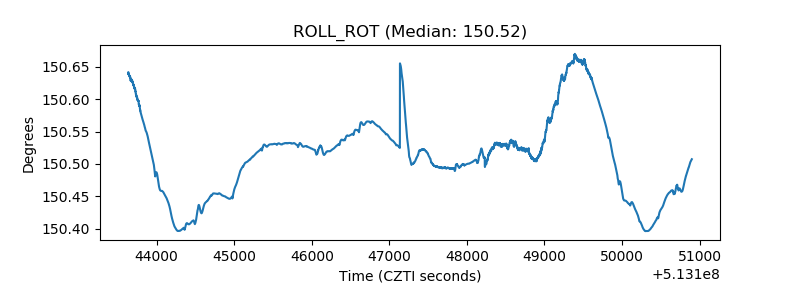 |
| _Roll_DEC | 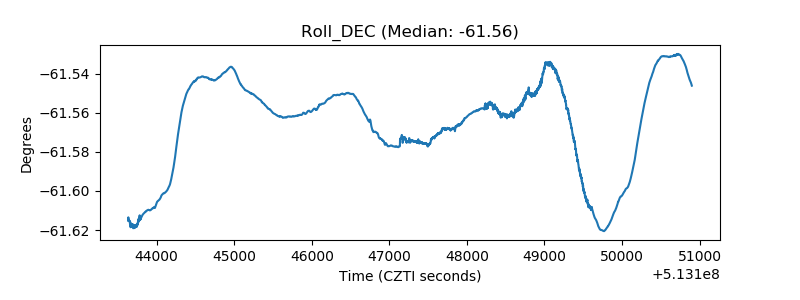 |
| _Roll_RA | 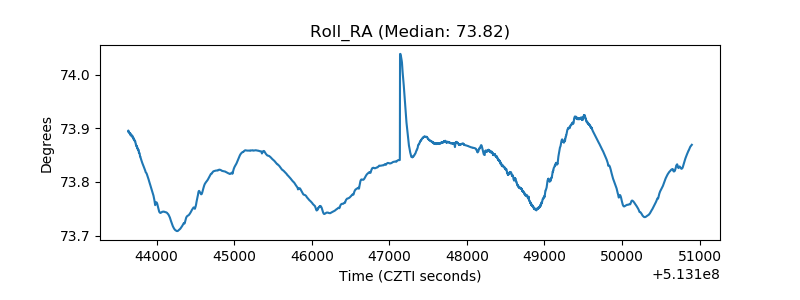 |
| Veto Counter | 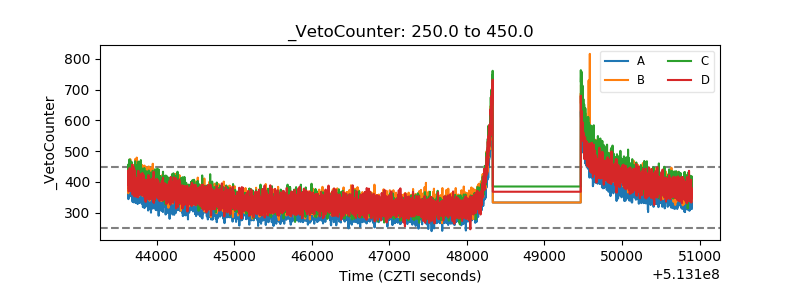 |