| Param | Original file | Final file |
|---|---|---|
| Filename | modeM0/AS1A14_083T14_9000006564_56928cztM0_level2.fits | modeM0/AS1A14_083T14_9000006564_56928cztM0_level2_quad_clean.evt |
| Size (bytes) | 950,440,320 | 63,679,680 |
| Size | 906.4 MB | 60.7 MB |
| Events in quadrant A | 11,336,337 | 319,385 |
| Events in quadrant B | 6,776,202 | 553,264 |
| Events in quadrant C | 3,618,817 | 590,837 |
| Events in quadrant D | 12,975,575 | 35,702 |
| Mode SS | |||
|---|---|---|---|
| Quadrant | BADHDUFLAG | Total packets | Discarded packets |
| A | 0 | 126 | 0 |
| B | 0 | 126 | 0 |
| C | 0 | 126 | 0 |
| D | 0 | 126 | 0 |
| Mode M9 | |||
|---|---|---|---|
| Quadrant | BADHDUFLAG | Total packets | Discarded packets |
| A | 0 | 12 | 0 |
| B | 0 | 12 | 0 |
| C | 0 | 12 | 0 |
| D | 0 | 12 | 0 |
| Mode M0 | |||
|---|---|---|---|
| Quadrant | BADHDUFLAG | Total packets | Discarded packets |
| A | 0 | 37888 | 1 |
| B | 0 | 24320 | 1 |
| C | 0 | 15039 | 1 |
| D | 0 | 42751 | 4 |
| Quadrant | Total seconds | Saturated seconds | Saturation percentage |
|---|---|---|---|
| A | 6135 | 3295 | 53.708231% |
| B | 6135 | 1274 | 20.766096% |
| C | 6136 | 173 | 2.819426% |
| D | 6135 | 5852 | 95.387123% |
Noise dominated data is calculated using 1-second bins in cleaned event files. If a bin has >2000 counts, and if more than 50% of those come from <1% of pixels, then it is considered to be noise-dominated and hence unusable.
| Quadrant | # 1 sec bins | Bins with >0 counts | Bins with >2000 counts | High rate bins dominated by noise | Noise dominated (total time) | Noise dominated (detector-on time) | Marked lightcurve |
|---|---|---|---|---|---|---|---|
| A | 7350 | 6135 | 3164 | 3164 | 43.05% | 51.57% | 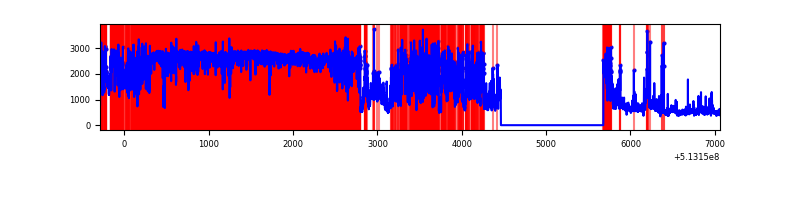 |
| B | 7350 | 6136 | 1004 | 1004 | 13.66% | 16.36% | 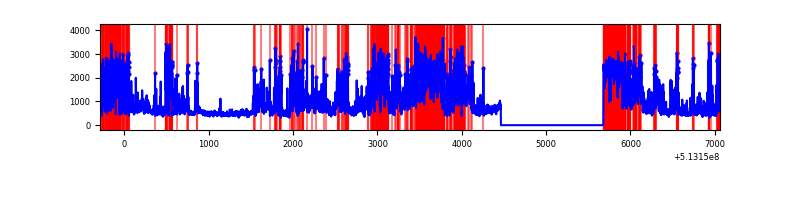 |
| C | 7351 | 6137 | 144 | 144 | 1.96% | 2.35% | 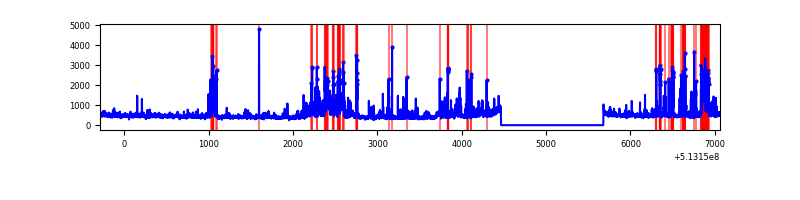 |
| D | 7349 | 6134 | 4057 | 4057 | 55.20% | 66.14% | 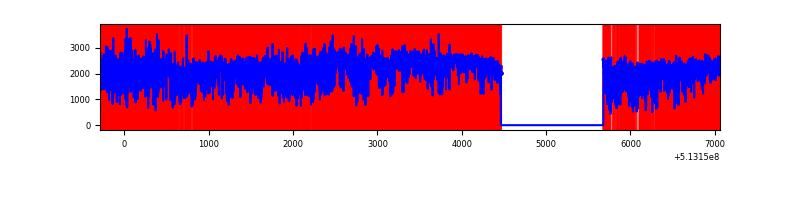 |
Top three noisy pixels from each quadrant. If the there are fewer than three noisy pixels in the level2.evt file, extra rows are filled as -1
| Pixel properties | Quadrant properties | ||||||
|---|---|---|---|---|---|---|---|
| Quadrant | DetID | PixID | Counts | Sigma | Mean | Median | Sigma |
| A | 7 | 64 | 9379280 | 79529.29 | 468 | 456 | 117.9 |
| A | 10 | 251 | 49736 | 417.88 | 468 | 456 | 117.9 |
| A | 3 | 79 | 31040 | 259.34 | 468 | 456 | 117.9 |
| B | 5 | 172 | 2782399 | 21948.13 | 598 | 576 | 126.7 |
| B | 10 | 16 | 1059884 | 8357.77 | 598 | 576 | 126.7 |
| B | 5 | 185 | 230836 | 1816.71 | 598 | 576 | 126.7 |
| C | 13 | 3 | 766421 | 4289.29 | 652 | 645 | 178.5 |
| C | 14 | 254 | 85219 | 473.72 | 652 | 645 | 178.5 |
| C | 15 | 198 | 60554 | 335.56 | 652 | 645 | 178.5 |
| D | 12 | 33 | 10632964 | 140571.89 | 262 | 250 | 75.6 |
| D | 8 | 160 | 482919 | 6381.22 | 262 | 250 | 75.6 |
| D | 2 | 249 | 309213 | 4084.71 | 262 | 250 | 75.6 |
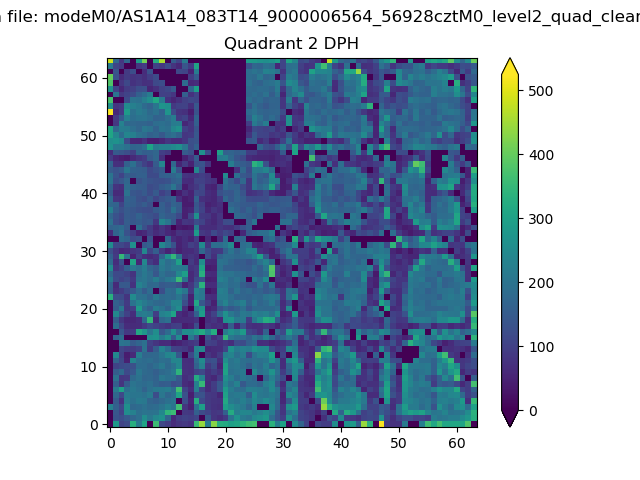
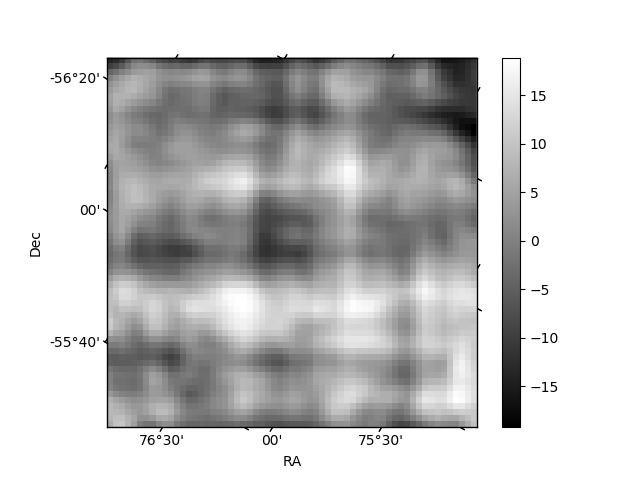
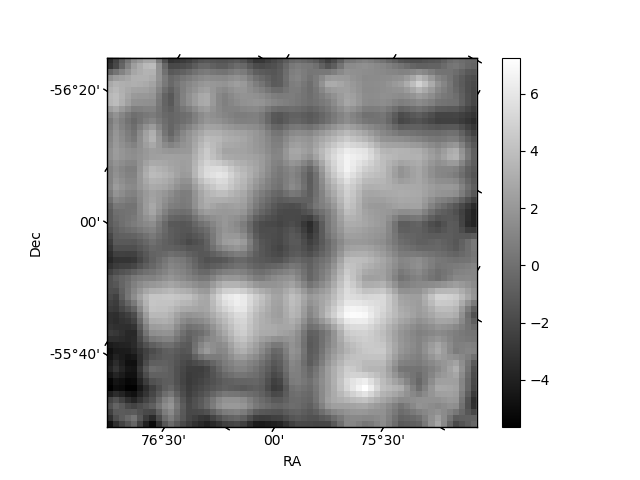
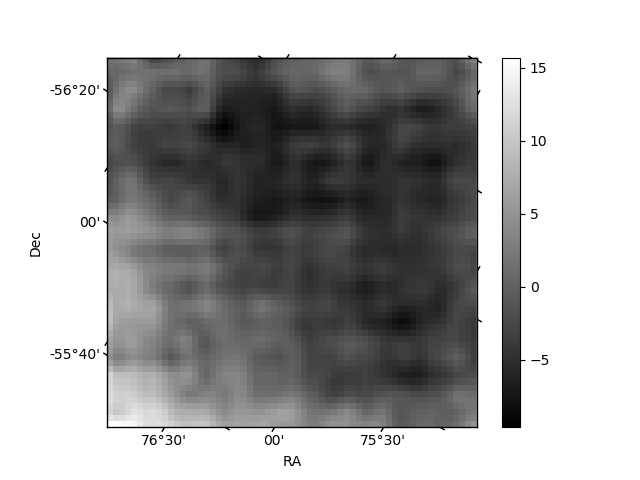
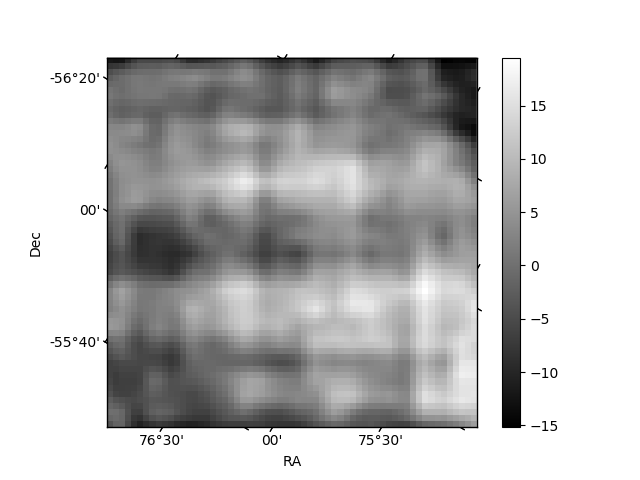
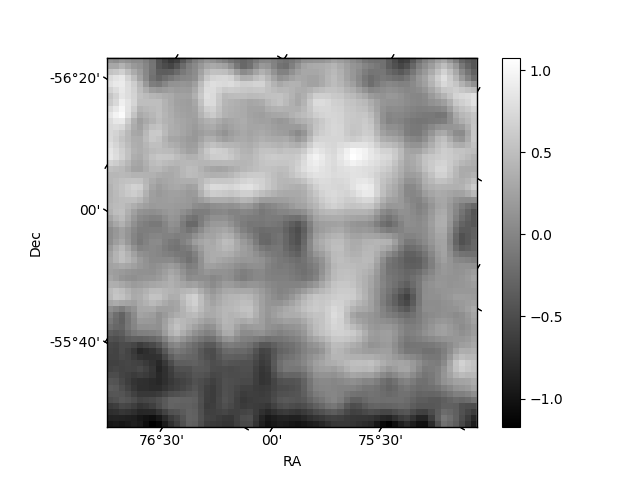
Histogram calculated using DETX and DETY for each event in the final _common_clean file
| Quadrant A | 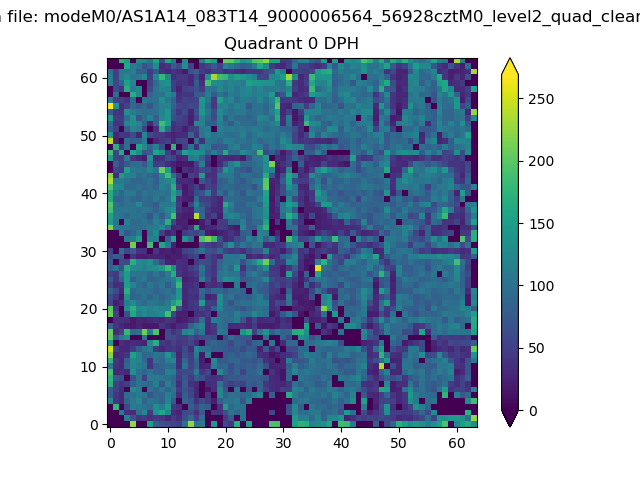 |
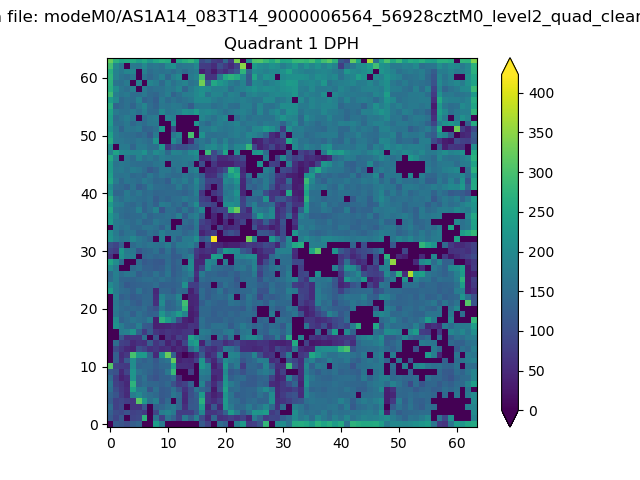 |
Quadrant B |
|---|---|---|---|
| Quadrant D | 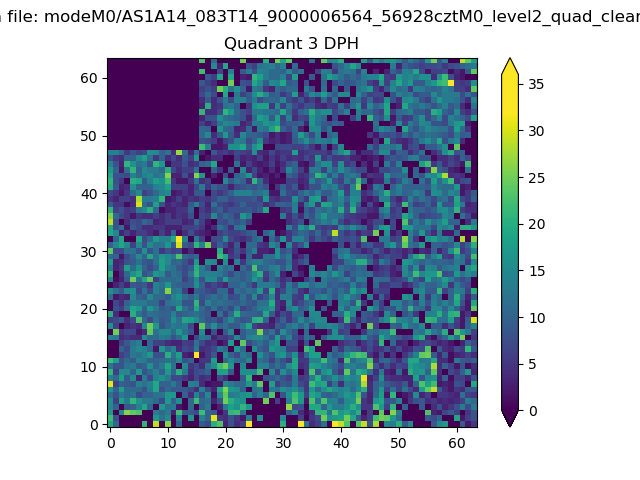 |
 |
Quadrant C |
| Plot type | Count rate plots | Images |
|---|---|---|
| Comparison with Poisson distribution Blue bars denote a histogram of data divided into 1 sec bins. Red curve is a Poisson curve with rate = median count rate of data. |
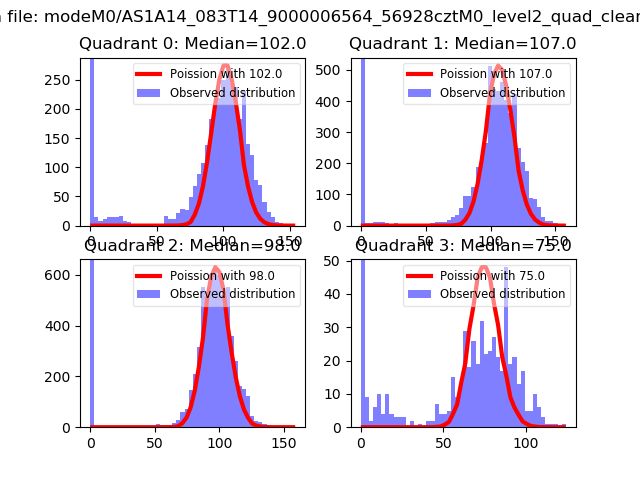 |
 |
| Quadrant-wise count rates Data is divided into 100 sec bins |
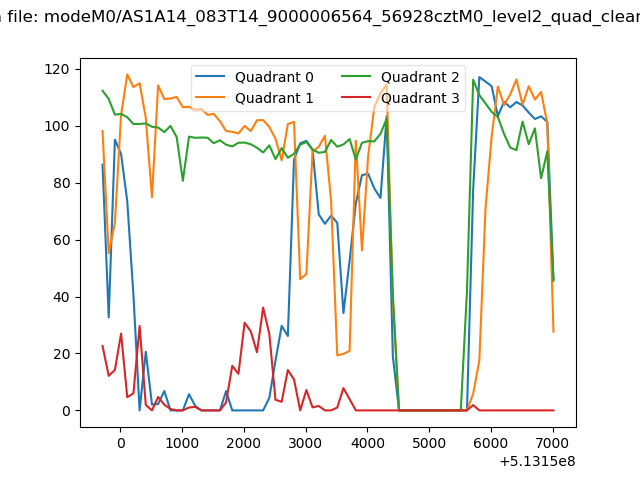 |
|
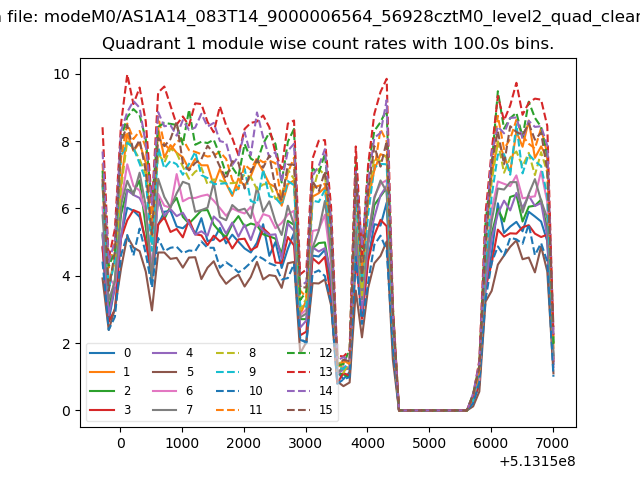
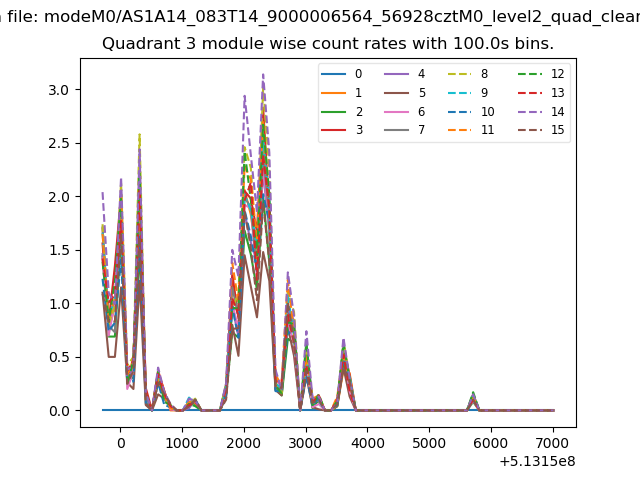
| Module-wise count rates for Quadrant A Data is divided into 100 sec bins |
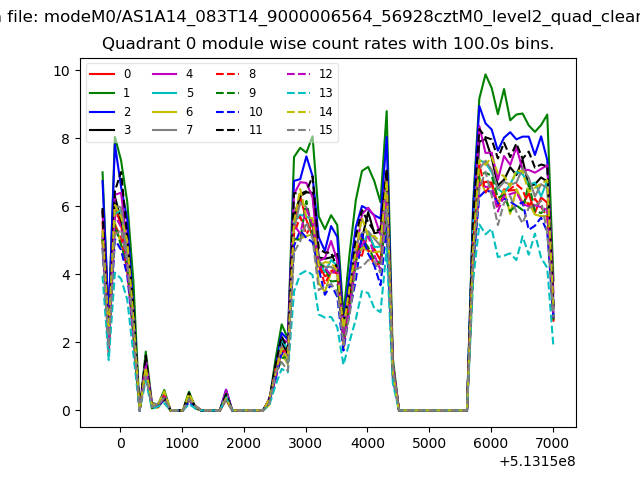 |
 |
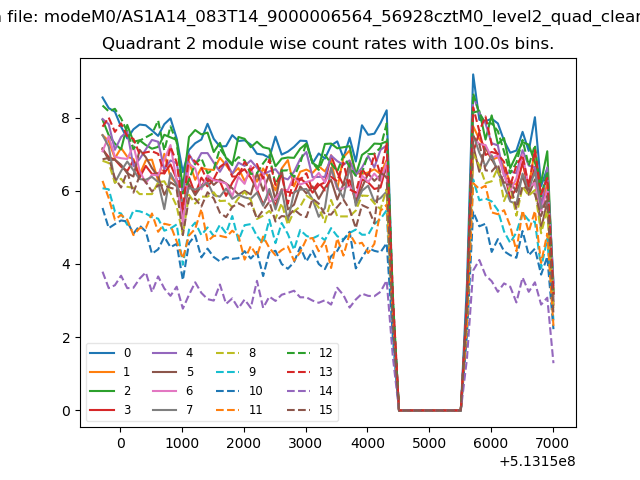
| Module-wise count rates for Quadrant B Data is divided into 100 sec bins |
 |
 |
| Module-wise count rates for Quadrant C Data is divided into 100 sec bins |
 |
 |
| Module-wise count rates for Quadrant D Data is divided into 100 sec bins |
 |
 |
| Parameter | Plot |
|---|---|
| CZT HV Monitor | 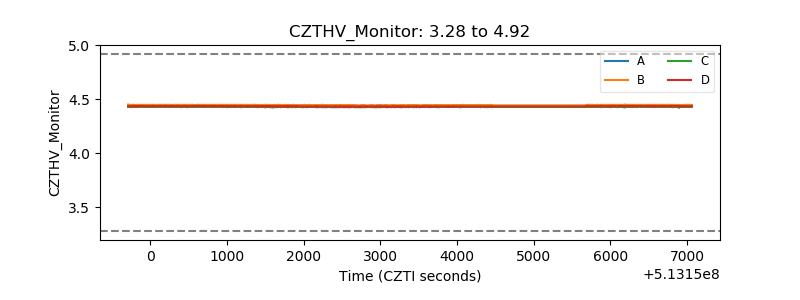 |
| D_VDD | 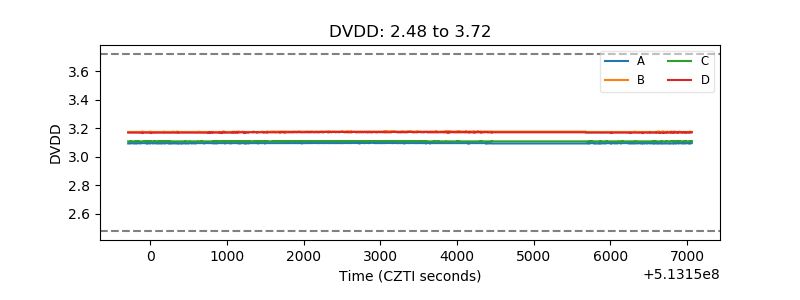 |
| Temperature 1 | 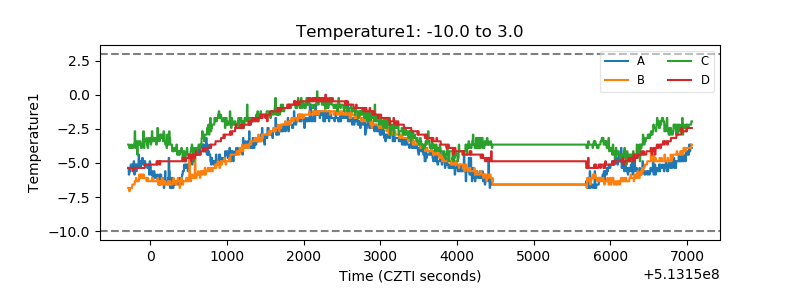 |
| Veto HV Monitor | 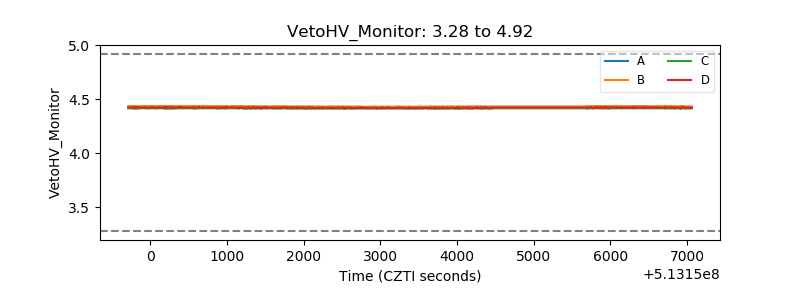 |
| Veto LLD | 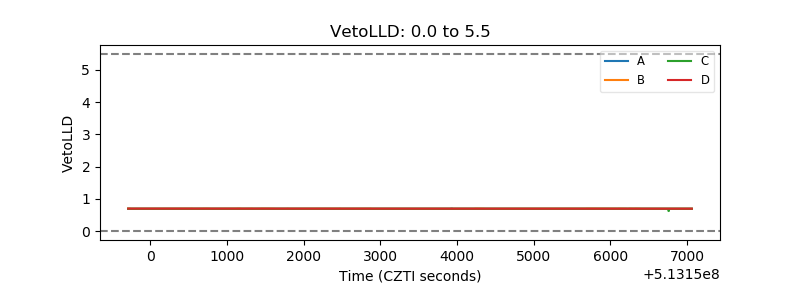 |
| Alpha Counter | 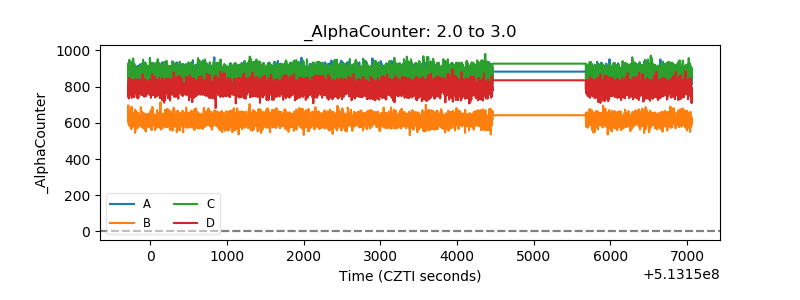 |
| _CPM_Rate | 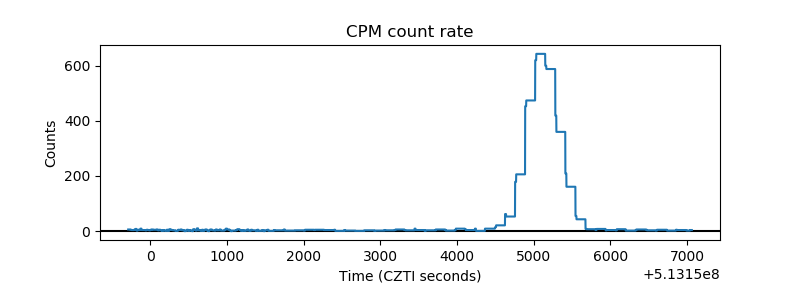 |
| CZT Counter | 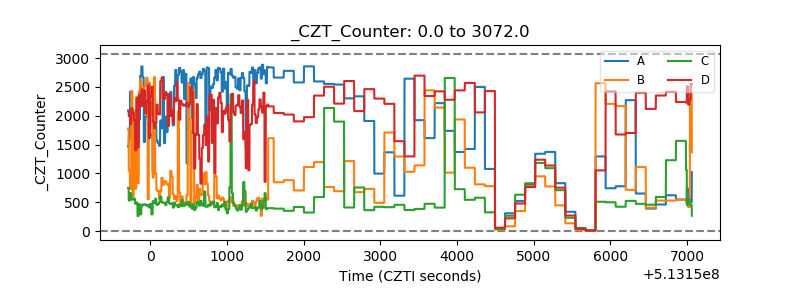 |
| +2.5 Volts monitor |  |
| +5 Volts monitor | 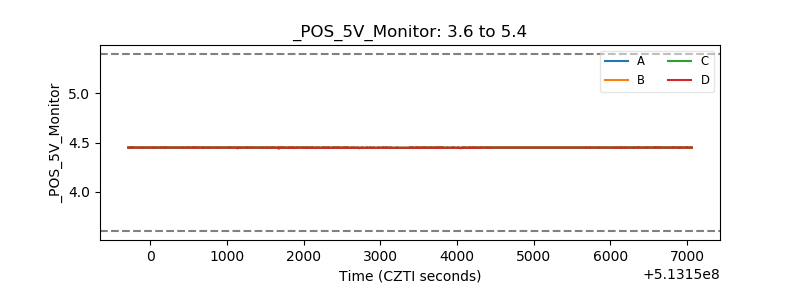 |
| _ROLL_ROT | 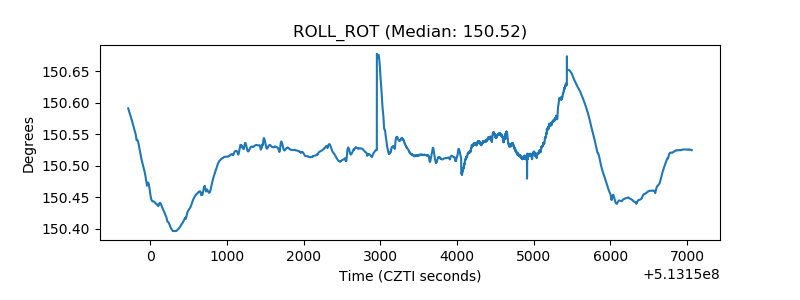 |
| _Roll_DEC | 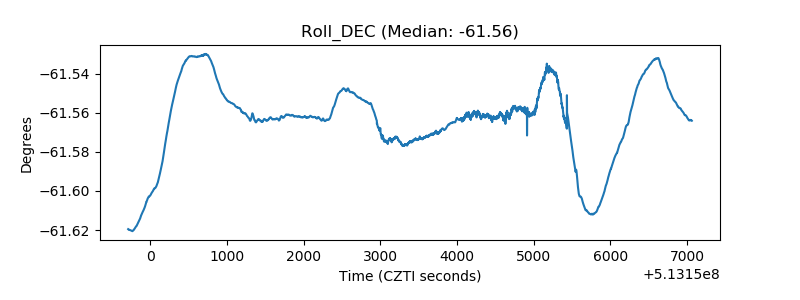 |
| _Roll_RA | 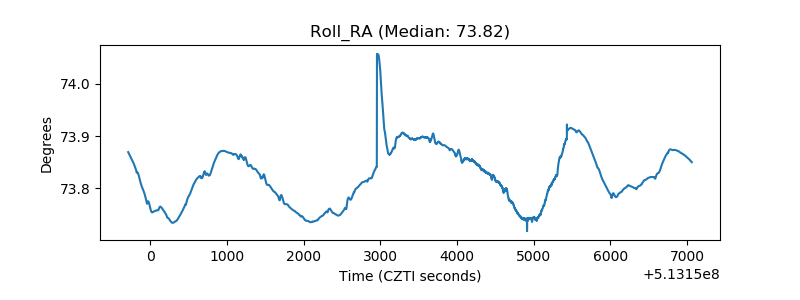 |
| Veto Counter | 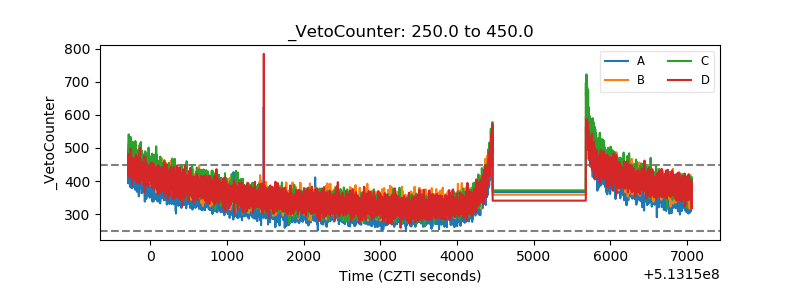 |