| Param | Original file | Final file |
|---|---|---|
| Filename | modeM0/AS1A14_083T14_9000006564_56929cztM0_level2.fits | modeM0/AS1A14_083T14_9000006564_56929cztM0_level2_quad_clean.evt |
| Size (bytes) | 838,385,280 | 66,680,640 |
| Size | 799.5 MB | 63.6 MB |
| Events in quadrant A | 9,276,828 | 379,172 |
| Events in quadrant B | 4,524,283 | 622,494 |
| Events in quadrant C | 3,422,961 | 581,557 |
| Events in quadrant D | 13,330,195 | 5,168 |
| Mode SS | |||
|---|---|---|---|
| Quadrant | BADHDUFLAG | Total packets | Discarded packets |
| A | 0 | 124 | 0 |
| B | 0 | 124 | 0 |
| C | 0 | 124 | 0 |
| D | 0 | 124 | 0 |
| Mode M9 | |||
|---|---|---|---|
| Quadrant | BADHDUFLAG | Total packets | Discarded packets |
| A | 0 | 12 | 0 |
| B | 0 | 12 | 0 |
| C | 0 | 12 | 0 |
| D | 0 | 12 | 0 |
| Mode M0 | |||
|---|---|---|---|
| Quadrant | BADHDUFLAG | Total packets | Discarded packets |
| A | 0 | 31883 | 1 |
| B | 0 | 17653 | 1 |
| C | 0 | 14638 | 1 |
| D | 0 | 43836 | 1 |
| Quadrant | Total seconds | Saturated seconds | Saturation percentage |
|---|---|---|---|
| A | 6172 | 2590 | 41.963707% |
| B | 6173 | 532 | 8.618176% |
| C | 6173 | 186 | 3.013122% |
| D | 6173 | 6132 | 99.335817% |
Noise dominated data is calculated using 1-second bins in cleaned event files. If a bin has >2000 counts, and if more than 50% of those come from <1% of pixels, then it is considered to be noise-dominated and hence unusable.
| Quadrant | # 1 sec bins | Bins with >0 counts | Bins with >2000 counts | High rate bins dominated by noise | Noise dominated (total time) | Noise dominated (detector-on time) | Marked lightcurve |
|---|---|---|---|---|---|---|---|
| A | 7292 | 6172 | 2458 | 2458 | 33.71% | 39.83% | 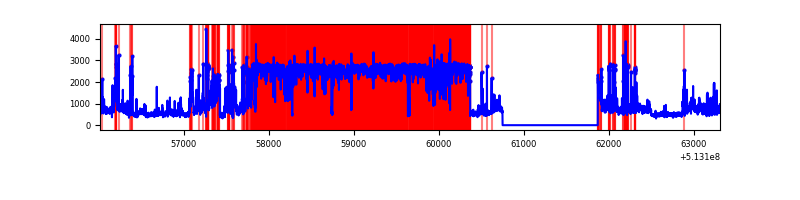 |
| B | 7293 | 6174 | 312 | 312 | 4.28% | 5.05% | 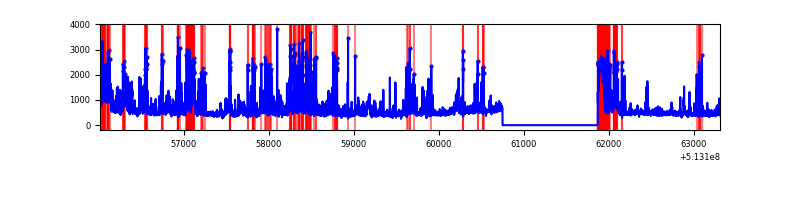 |
| C | 7293 | 6173 | 127 | 127 | 1.74% | 2.06% | 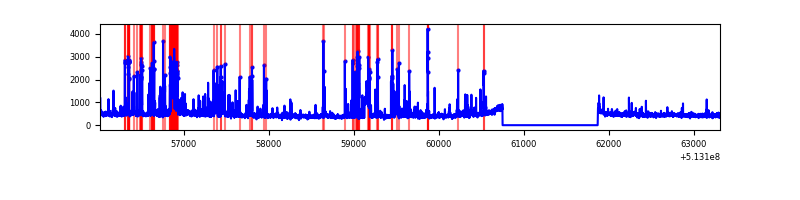 |
| D | 7292 | 6172 | 4334 | 4334 | 59.43% | 70.22% | 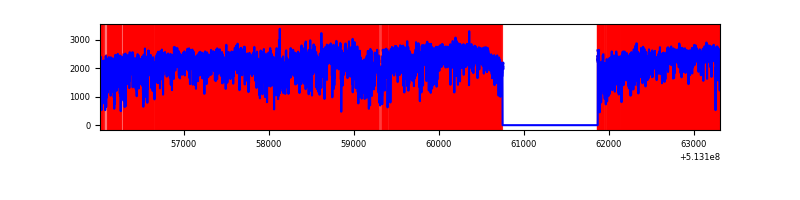 |
Top three noisy pixels from each quadrant. If the there are fewer than three noisy pixels in the level2.evt file, extra rows are filled as -1
| Pixel properties | Quadrant properties | ||||||
|---|---|---|---|---|---|---|---|
| Quadrant | DetID | PixID | Counts | Sigma | Mean | Median | Sigma |
| A | 7 | 64 | 7137306 | 55967.26 | 511 | 497 | 127.5 |
| A | 10 | 251 | 77594 | 604.6 | 511 | 497 | 127.5 |
| A | 3 | 14 | 20690 | 158.35 | 511 | 497 | 127.5 |
| B | 5 | 172 | 1081144 | 7959.26 | 642 | 620 | 135.8 |
| B | 5 | 185 | 360759 | 2652.82 | 642 | 620 | 135.8 |
| B | 10 | 16 | 346197 | 2545.56 | 642 | 620 | 135.8 |
| C | 13 | 3 | 674685 | 3778.23 | 651 | 642 | 178.4 |
| C | 14 | 254 | 64011 | 355.2 | 651 | 642 | 178.4 |
| C | 6 | 223 | 42257 | 233.27 | 651 | 642 | 178.4 |
| D | 12 | 33 | 11556721 | 197777.11 | 199 | 190 | 58.4 |
| D | 2 | 249 | 368659 | 6305.94 | 199 | 190 | 58.4 |
| D | 15 | 142 | 140175 | 2395.69 | 199 | 190 | 58.4 |
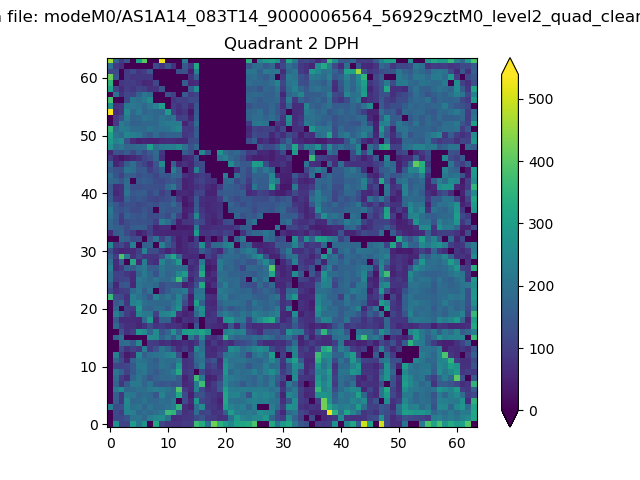
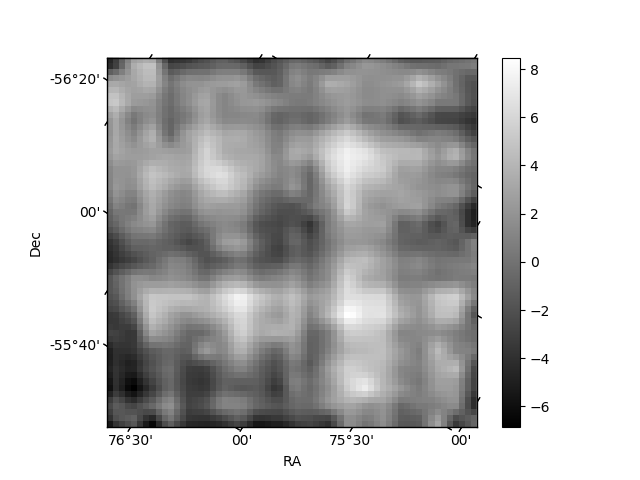
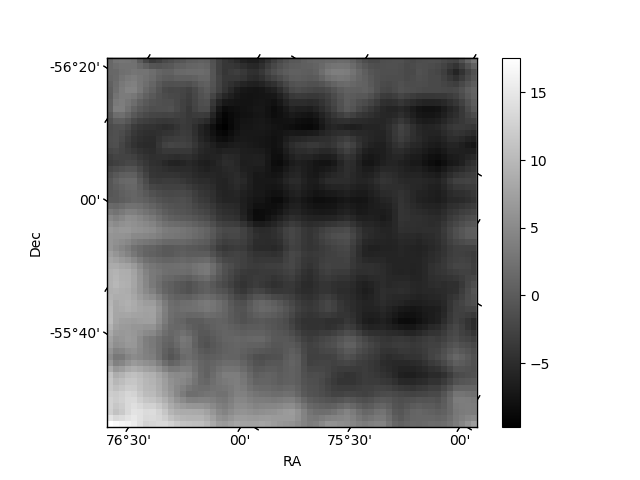
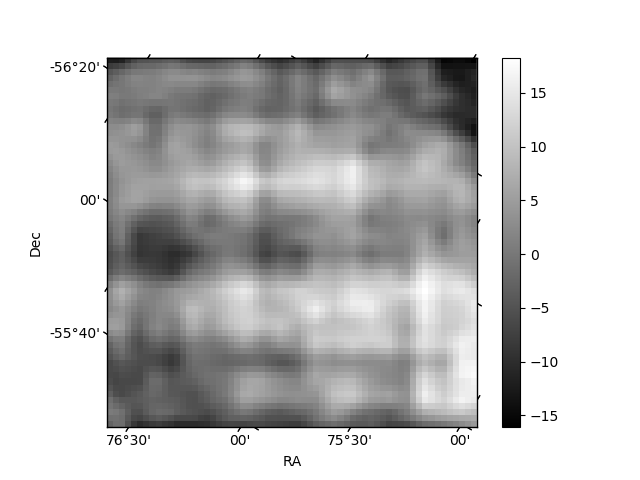
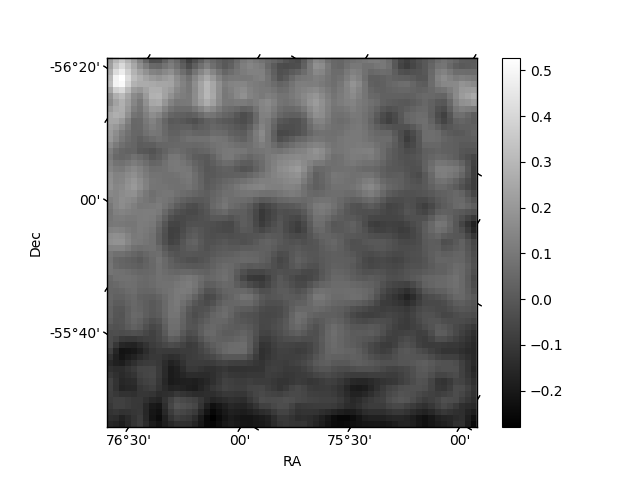
Histogram calculated using DETX and DETY for each event in the final _common_clean file
| Quadrant A | 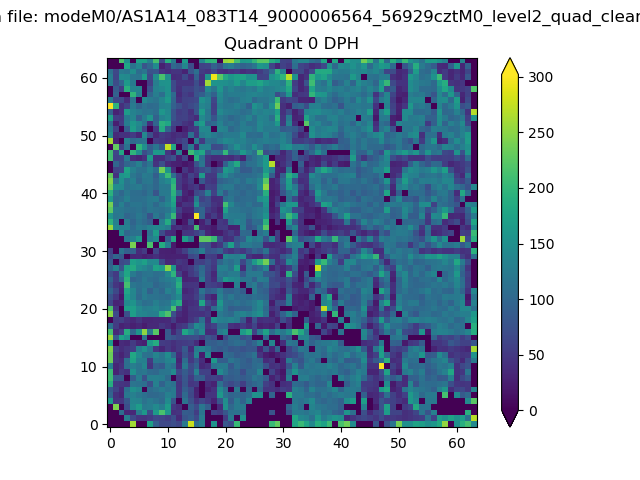 |
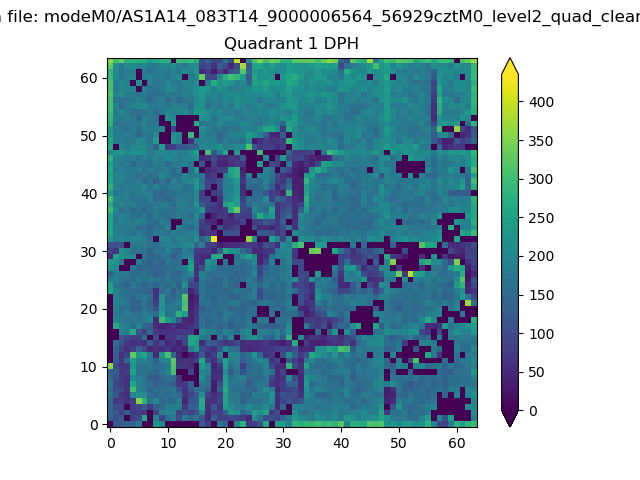 |
Quadrant B |
|---|---|---|---|
| Quadrant D | 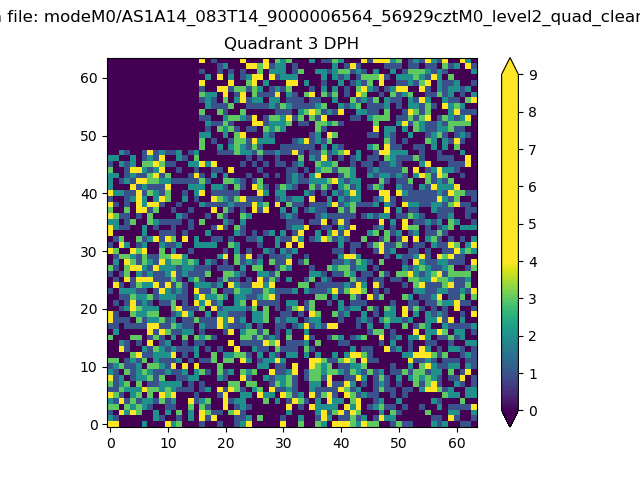 |
 |
Quadrant C |
| Plot type | Count rate plots | Images |
|---|---|---|
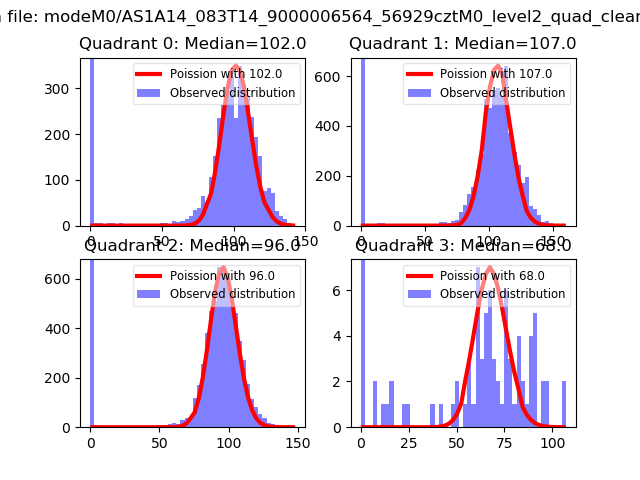
| Comparison with Poisson distribution Blue bars denote a histogram of data divided into 1 sec bins. Red curve is a Poisson curve with rate = median count rate of data. |
 |
 |
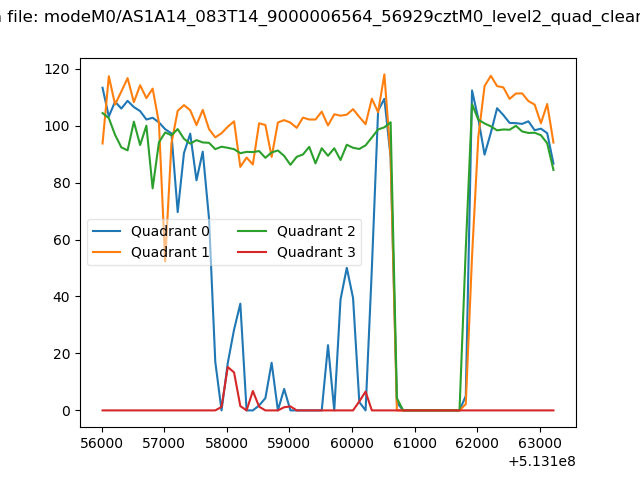
| Quadrant-wise count rates Data is divided into 100 sec bins |
 |
|
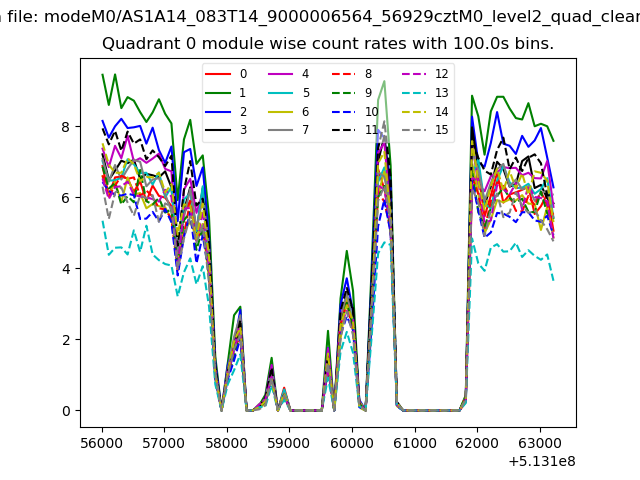
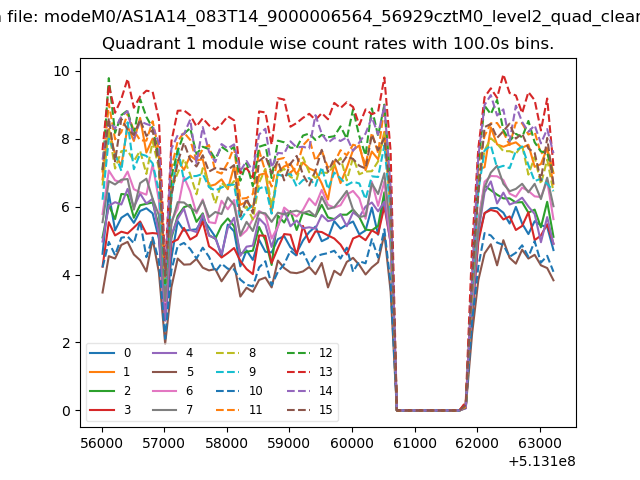
| Module-wise count rates for Quadrant A Data is divided into 100 sec bins |
 |
 |
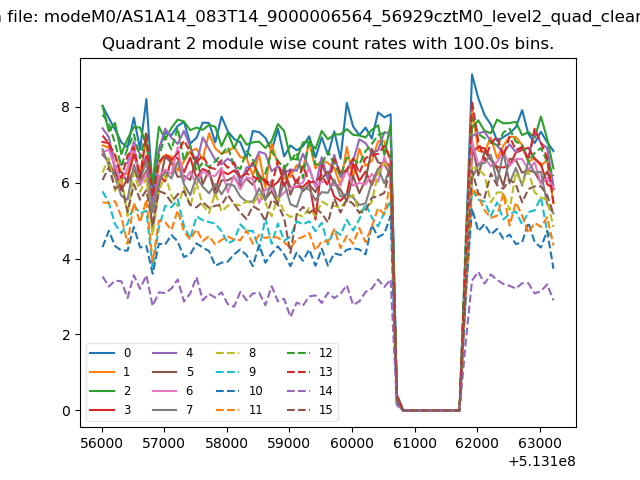
| Module-wise count rates for Quadrant B Data is divided into 100 sec bins |
 |
 |
| Module-wise count rates for Quadrant C Data is divided into 100 sec bins |
 |
 |
| Module-wise count rates for Quadrant D Data is divided into 100 sec bins |
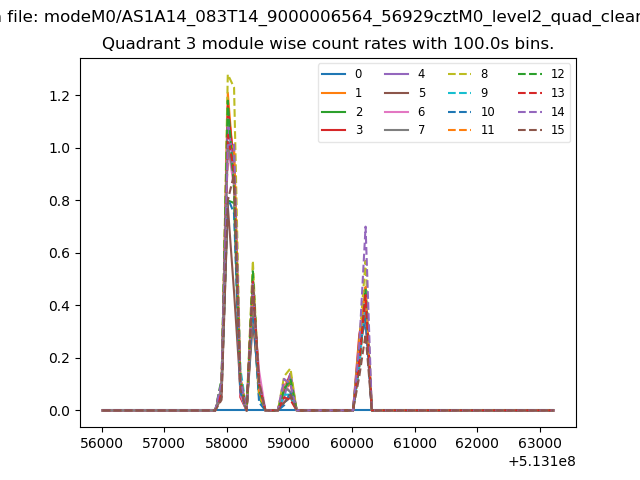 |
 |
| Parameter | Plot |
|---|---|
| CZT HV Monitor | 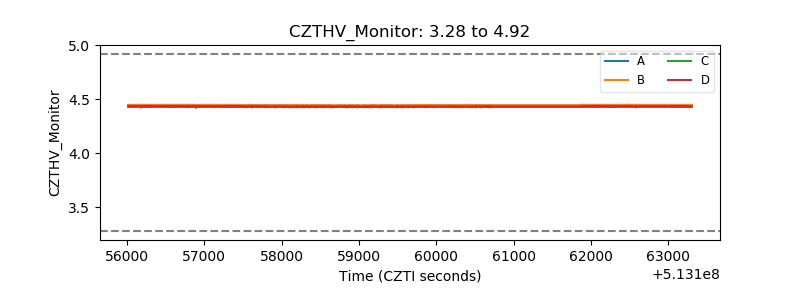 |
| D_VDD | 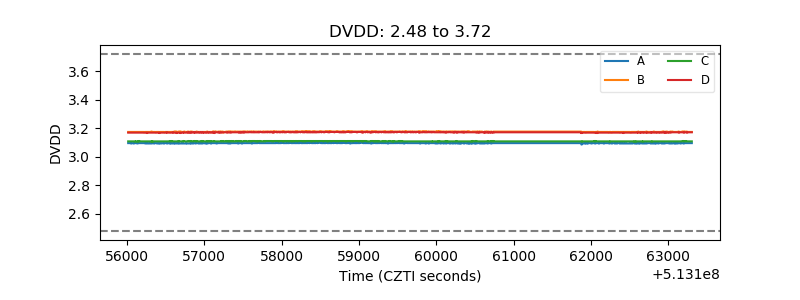 |
| Temperature 1 | 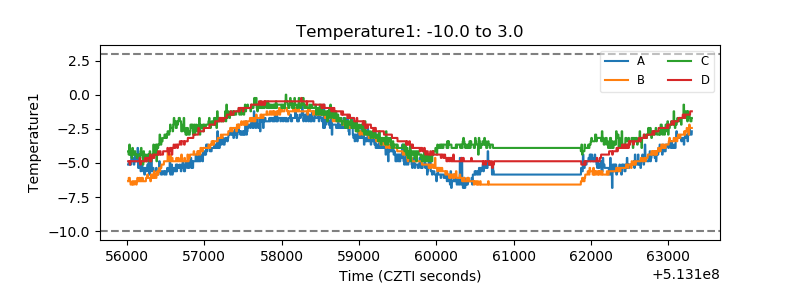 |
| Veto HV Monitor | 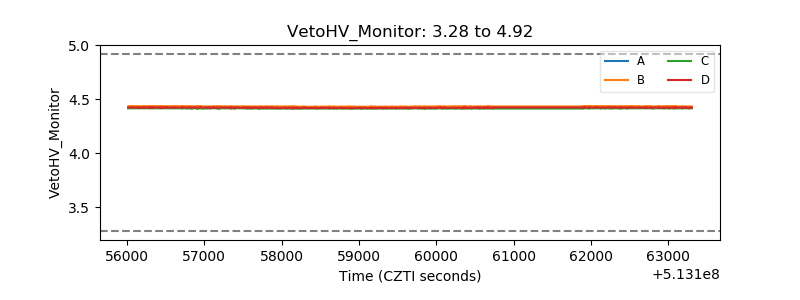 |
| Veto LLD | 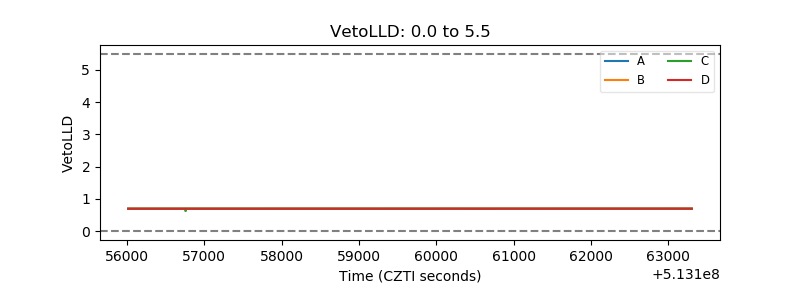 |
| Alpha Counter | 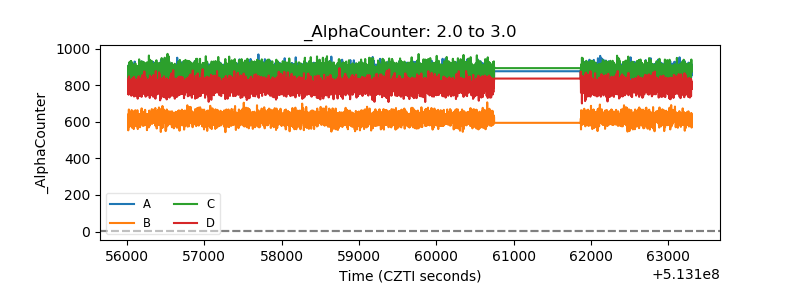 |
| _CPM_Rate | 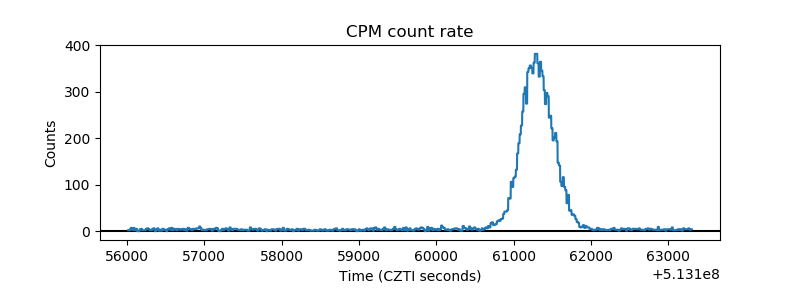 |
| CZT Counter | 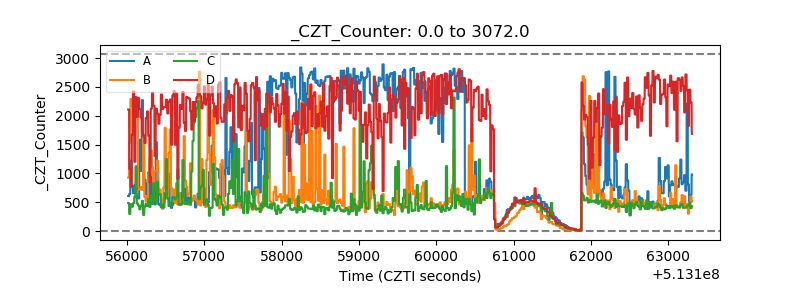 |
| +2.5 Volts monitor |  |
| +5 Volts monitor | 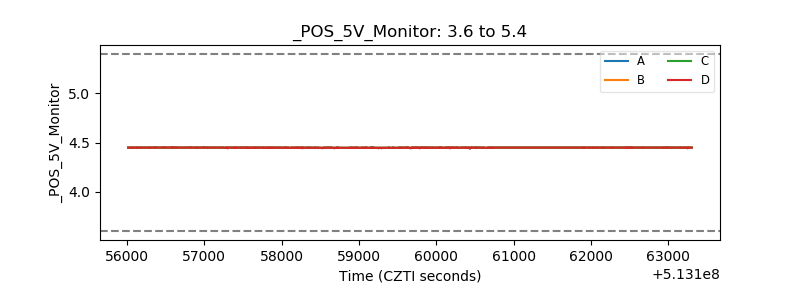 |
| _ROLL_ROT | 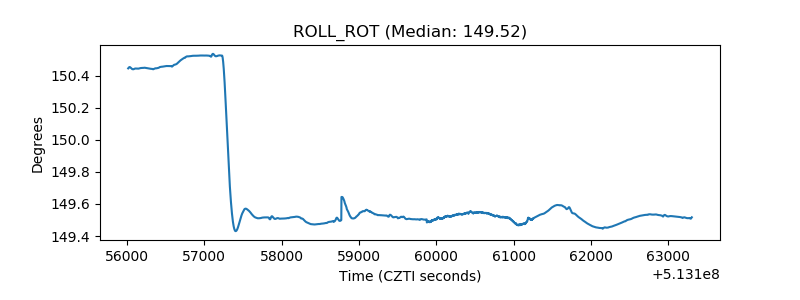 |
| _Roll_DEC | 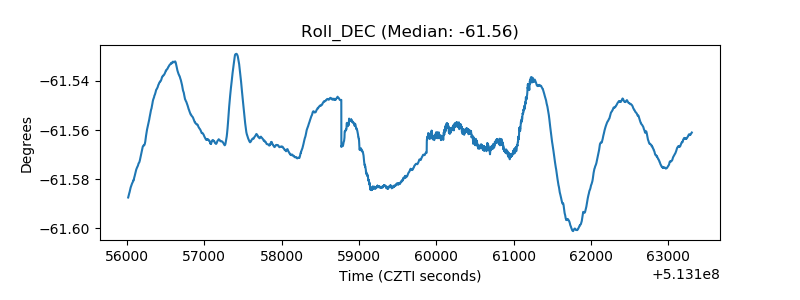 |
| _Roll_RA | 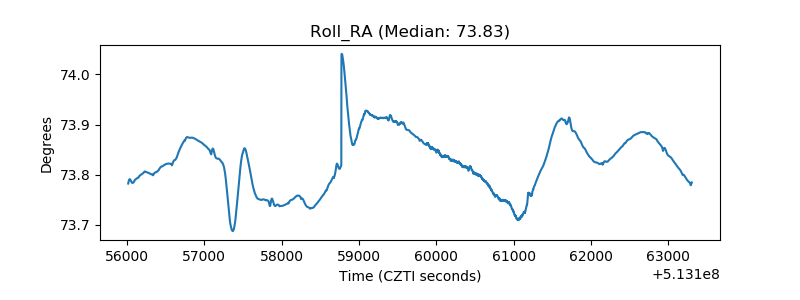 |
| Veto Counter | 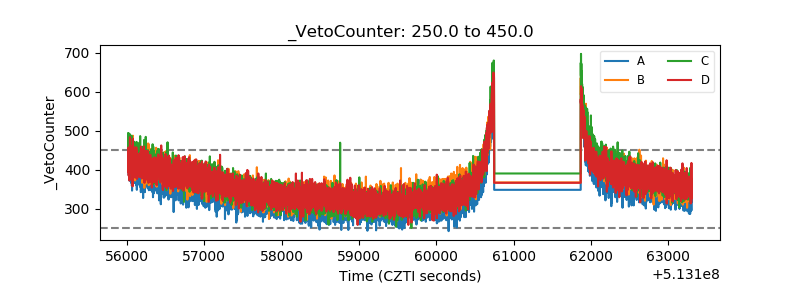 |