| Param | Original file | Final file |
|---|---|---|
| Filename | modeM0/AS1A14_083T14_9000006564_56931cztM0_level2.fits | modeM0/AS1A14_083T14_9000006564_56931cztM0_level2_quad_clean.evt |
| Size (bytes) | 850,294,080 | 75,718,080 |
| Size | 810.9 MB | 72.2 MB |
| Events in quadrant A | 6,179,030 | 547,530 |
| Events in quadrant B | 5,702,293 | 603,359 |
| Events in quadrant C | 4,703,372 | 525,355 |
| Events in quadrant D | 14,384,301 | 160,614 |
| Mode SS | |||
|---|---|---|---|
| Quadrant | BADHDUFLAG | Total packets | Discarded packets |
| A | 0 | 132 | 0 |
| B | 0 | 132 | 0 |
| C | 0 | 132 | 0 |
| D | 0 | 132 | 0 |
| Mode M9 | |||
|---|---|---|---|
| Quadrant | BADHDUFLAG | Total packets | Discarded packets |
| A | 0 | 6 | 0 |
| B | 0 | 6 | 0 |
| C | 0 | 6 | 0 |
| D | 0 | 6 | 0 |
| Mode M0 | |||
|---|---|---|---|
| Quadrant | BADHDUFLAG | Total packets | Discarded packets |
| A | 0 | 22931 | 1 |
| B | 0 | 21508 | 1 |
| C | 0 | 19163 | 1 |
| D | 0 | 47160 | 7 |
| Quadrant | Total seconds | Saturated seconds | Saturation percentage |
|---|---|---|---|
| A | 6533 | 873 | 13.362927% |
| B | 6533 | 746 | 11.418950% |
| C | 6533 | 863 | 13.209858% |
| D | 6533 | 5025 | 76.917190% |
Noise dominated data is calculated using 1-second bins in cleaned event files. If a bin has >2000 counts, and if more than 50% of those come from <1% of pixels, then it is considered to be noise-dominated and hence unusable.
| Quadrant | # 1 sec bins | Bins with >0 counts | Bins with >2000 counts | High rate bins dominated by noise | Noise dominated (total time) | Noise dominated (detector-on time) | Marked lightcurve |
|---|---|---|---|---|---|---|---|
| A | 7123 | 6533 | 700 | 700 | 9.83% | 10.71% | 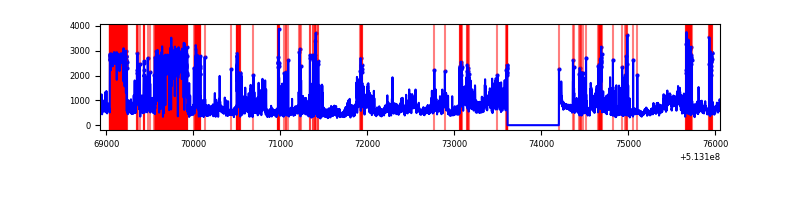 |
| B | 7123 | 6534 | 510 | 510 | 7.16% | 7.81% | 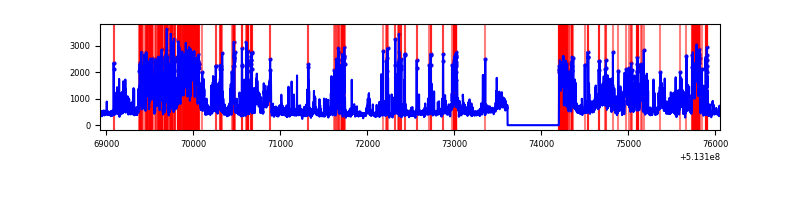 |
| C | 7123 | 6534 | 800 | 800 | 11.23% | 12.24% | 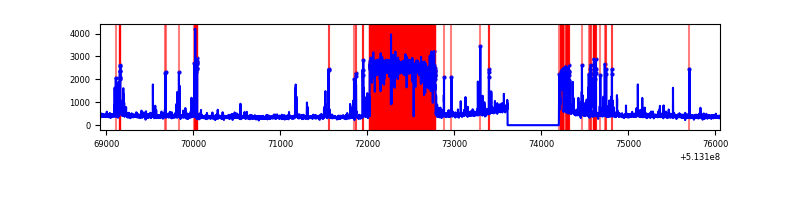 |
| D | 7122 | 6532 | 4815 | 4815 | 67.61% | 73.71% | 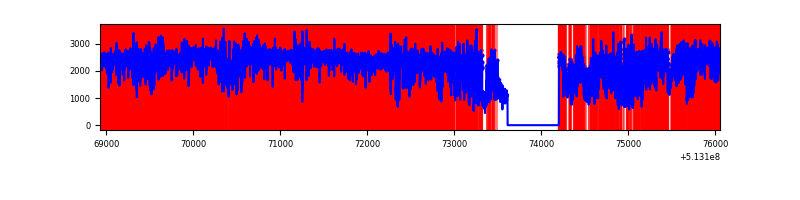 |
Top three noisy pixels from each quadrant. If the there are fewer than three noisy pixels in the level2.evt file, extra rows are filled as -1
| Pixel properties | Quadrant properties | ||||||
|---|---|---|---|---|---|---|---|
| Quadrant | DetID | PixID | Counts | Sigma | Mean | Median | Sigma |
| A | 7 | 64 | 3523299 | 21761.18 | 647 | 630 | 161.9 |
| A | 3 | 245 | 61995 | 379.08 | 647 | 630 | 161.9 |
| A | 3 | 14 | 35995 | 218.47 | 647 | 630 | 161.9 |
| B | 5 | 172 | 1471153 | 10575.15 | 649 | 627 | 139.1 |
| B | 5 | 185 | 1261620 | 9068.32 | 649 | 627 | 139.1 |
| B | 10 | 16 | 214001 | 1534.46 | 649 | 627 | 139.1 |
| C | 13 | 3 | 2065300 | 11842.02 | 631 | 623 | 174.4 |
| C | 1 | 12 | 61930 | 351.63 | 631 | 623 | 174.4 |
| C | 14 | 254 | 50685 | 287.13 | 631 | 623 | 174.4 |
| D | 12 | 33 | 9853312 | 78254.76 | 443 | 422 | 125.9 |
| D | 2 | 249 | 1404998 | 11155.59 | 443 | 422 | 125.9 |
| D | 15 | 142 | 918296 | 7290.04 | 443 | 422 | 125.9 |
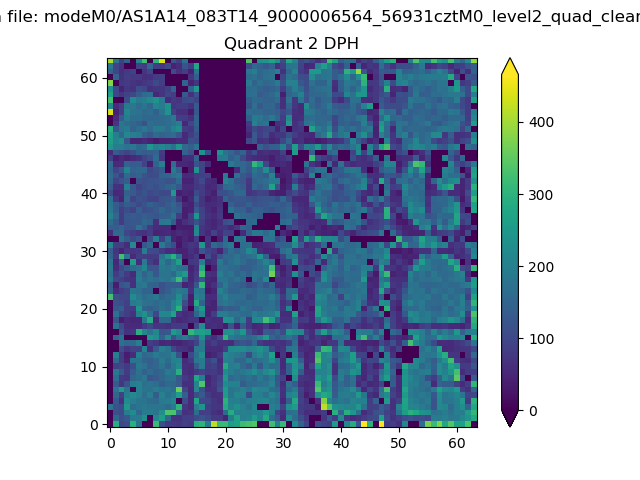
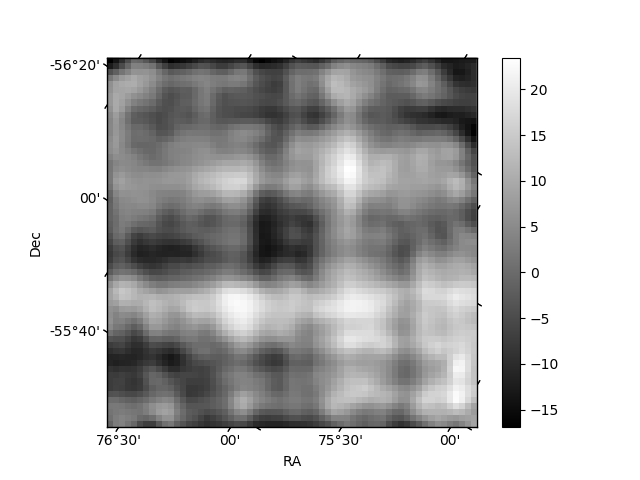
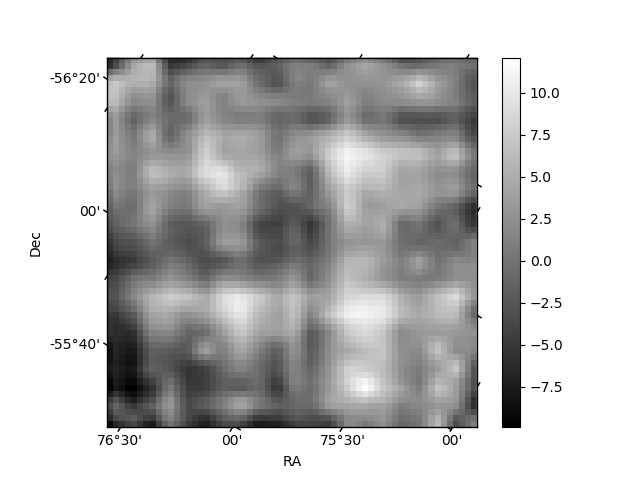
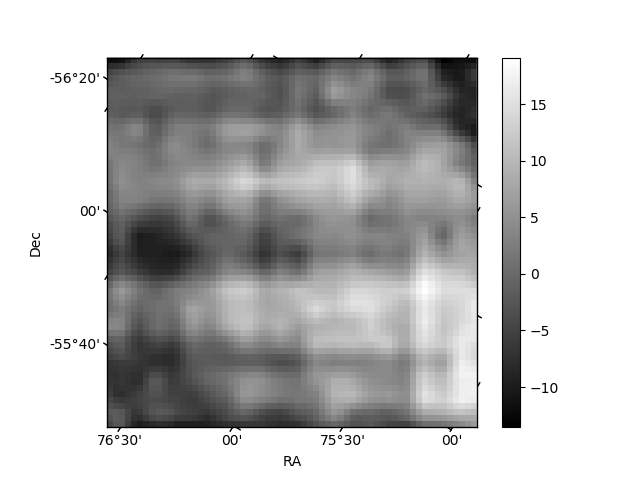
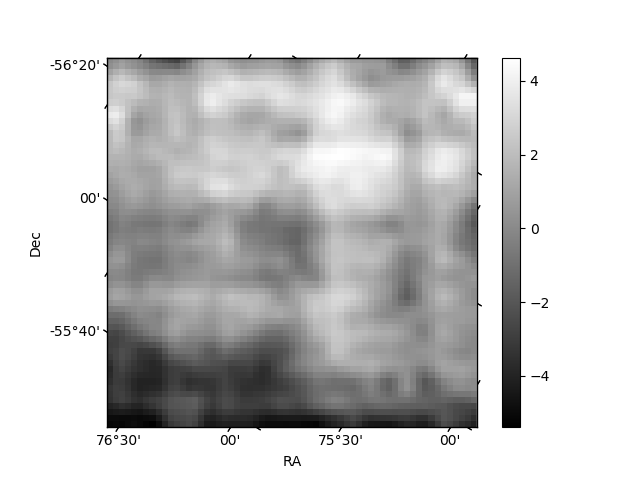
Histogram calculated using DETX and DETY for each event in the final _common_clean file
| Quadrant A | 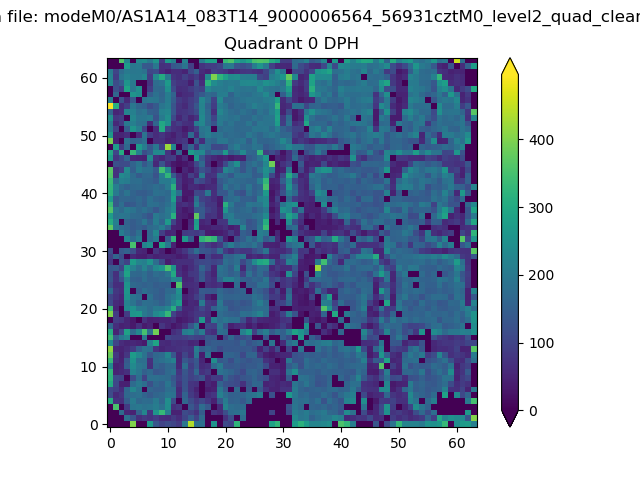 |
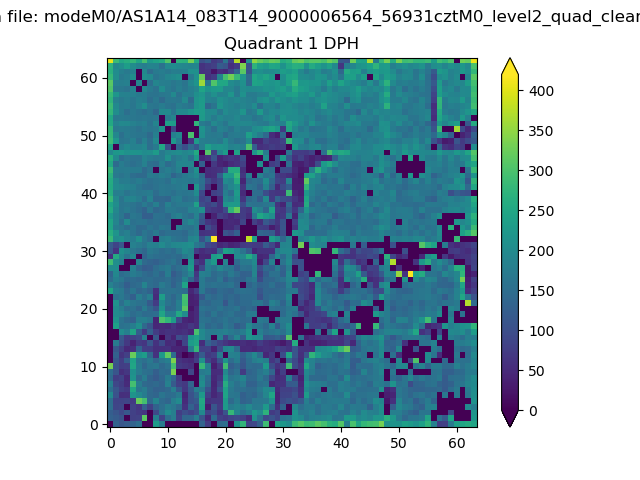 |
Quadrant B |
|---|---|---|---|
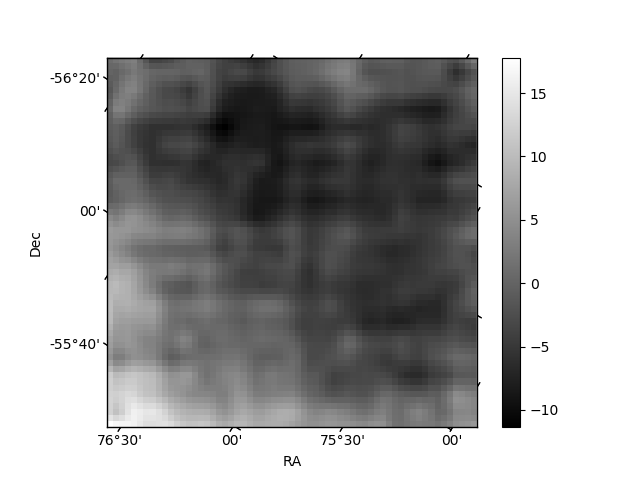
| Quadrant D | 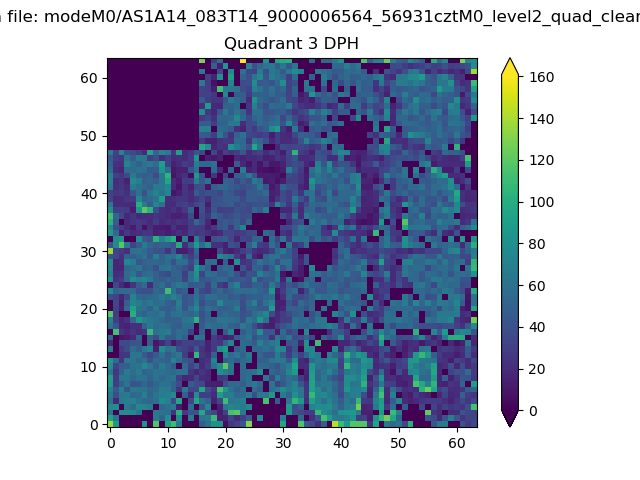 |
 |
Quadrant C |
| Plot type | Count rate plots | Images |
|---|---|---|
| Comparison with Poisson distribution Blue bars denote a histogram of data divided into 1 sec bins. Red curve is a Poisson curve with rate = median count rate of data. |
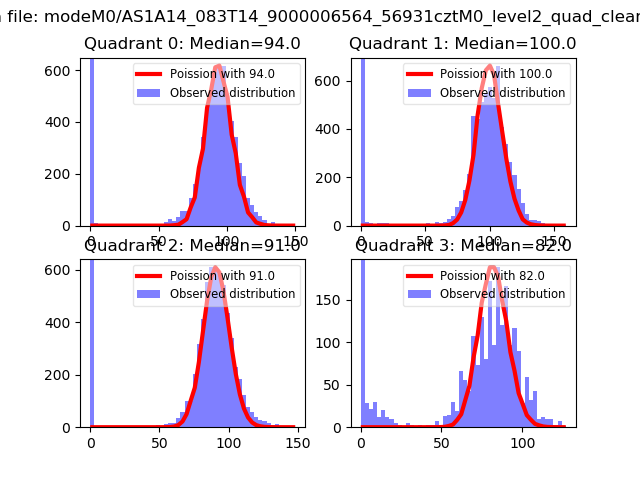 |
 |
| Quadrant-wise count rates Data is divided into 100 sec bins |
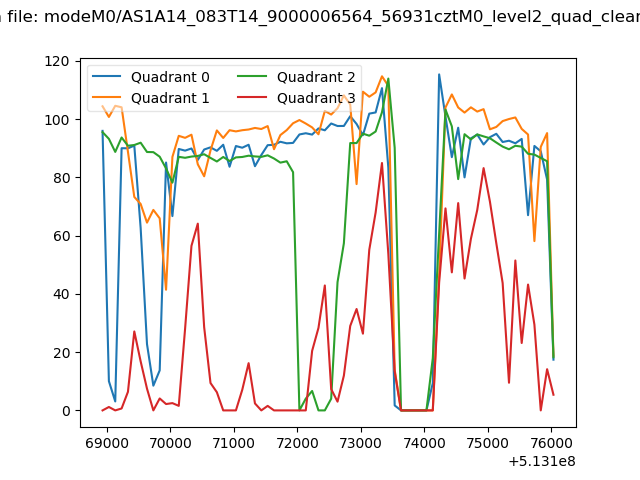 |
|
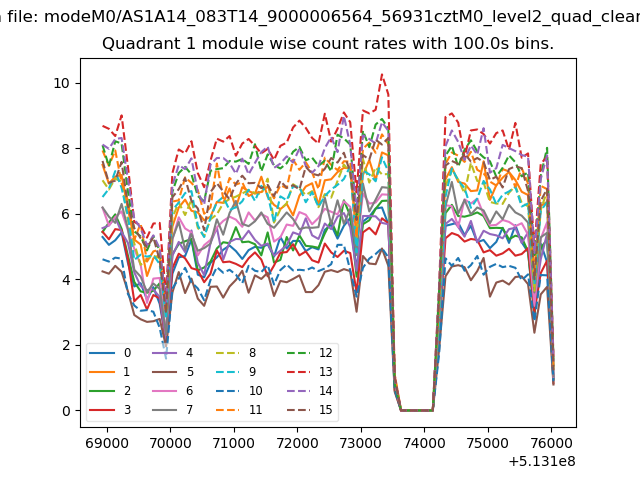
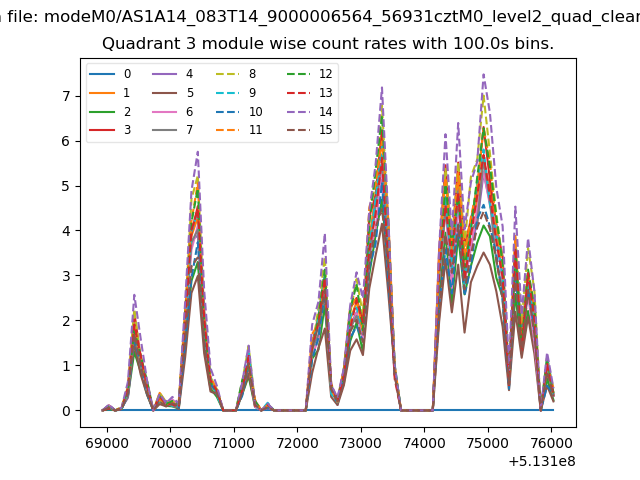
| Module-wise count rates for Quadrant A Data is divided into 100 sec bins |
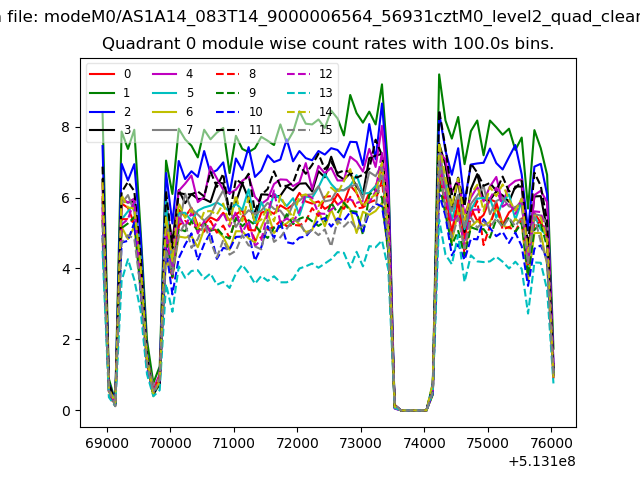 |
 |
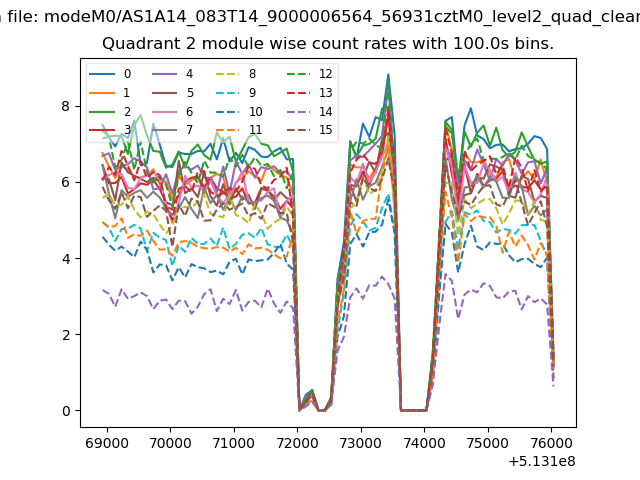
| Module-wise count rates for Quadrant B Data is divided into 100 sec bins |
 |
 |
| Module-wise count rates for Quadrant C Data is divided into 100 sec bins |
 |
 |
| Module-wise count rates for Quadrant D Data is divided into 100 sec bins |
 |
 |
| Parameter | Plot |
|---|---|
| CZT HV Monitor | 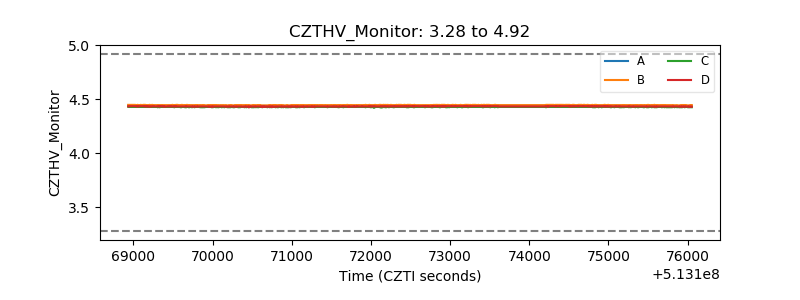 |
| D_VDD | 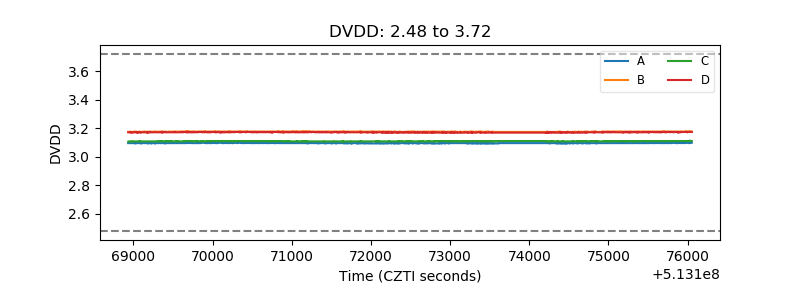 |
| Temperature 1 | 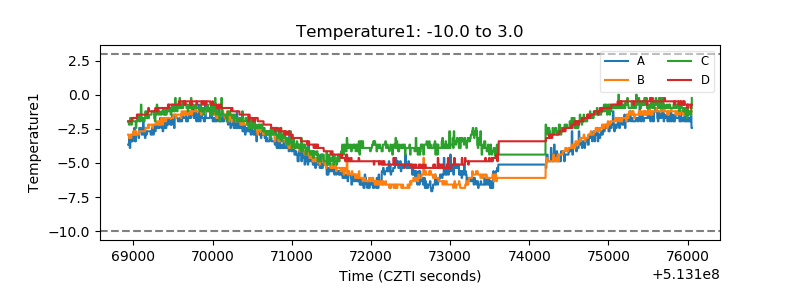 |
| Veto HV Monitor | 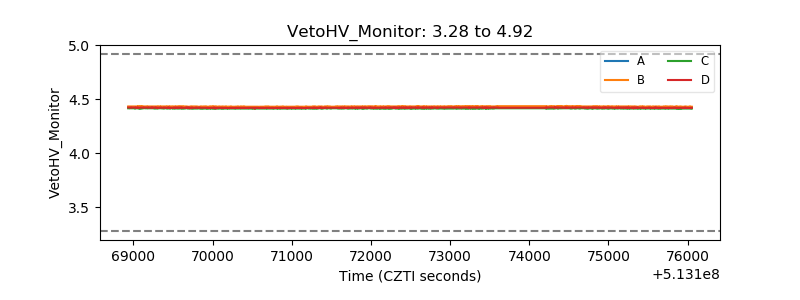 |
| Veto LLD | 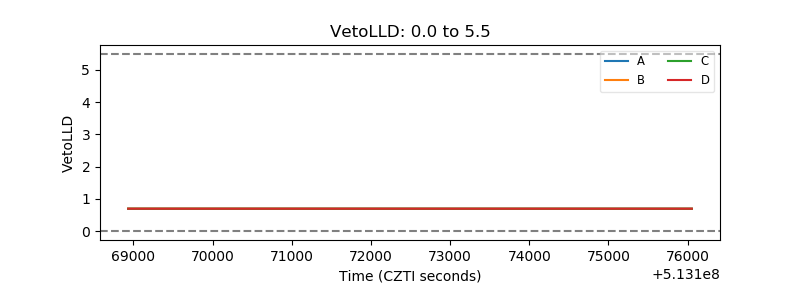 |
| Alpha Counter | 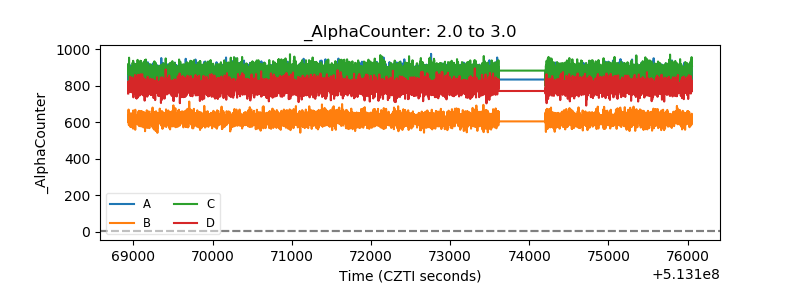 |
| _CPM_Rate | 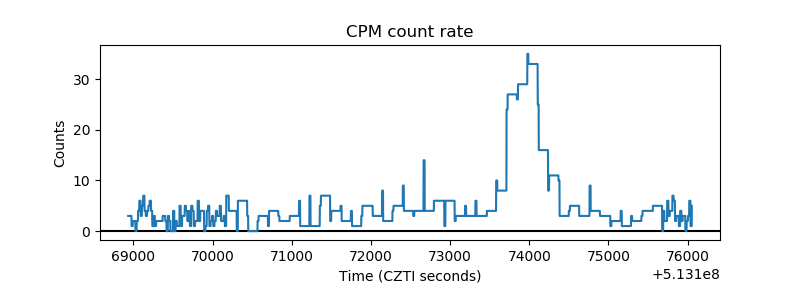 |
| CZT Counter | 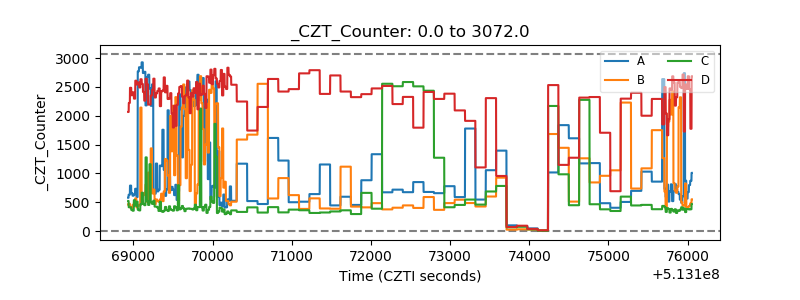 |
| +2.5 Volts monitor |  |
| +5 Volts monitor |  |
| _ROLL_ROT | 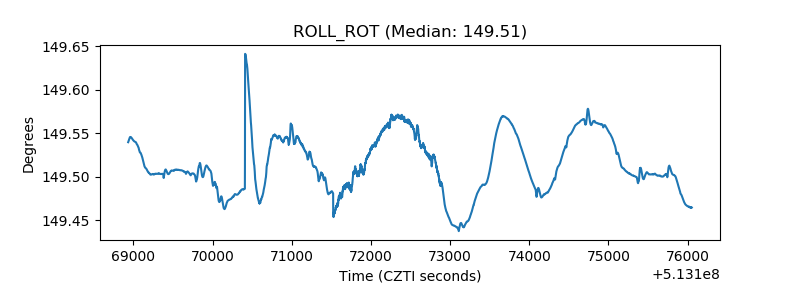 |
| _Roll_DEC | 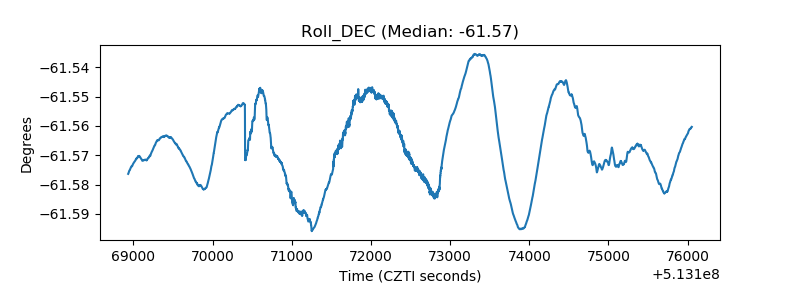 |
| _Roll_RA | 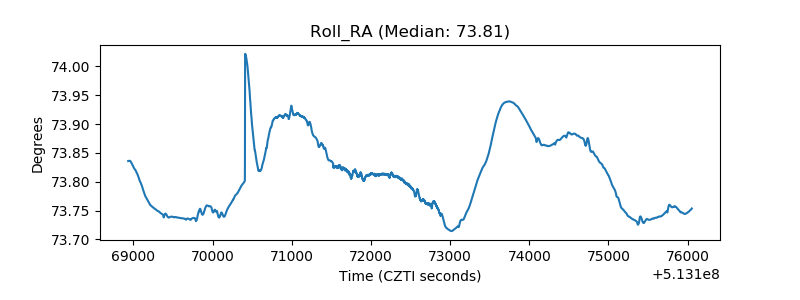 |
| Veto Counter | 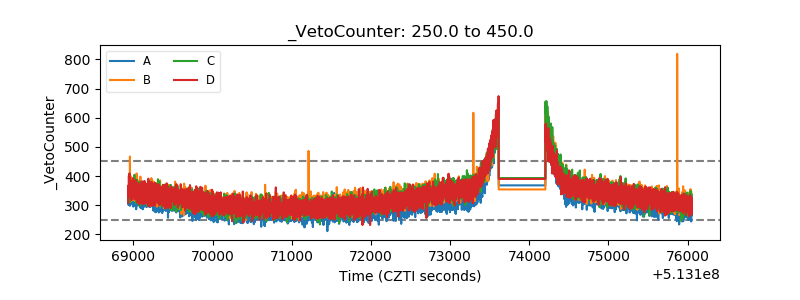 |