| Param | Original file | Final file |
|---|---|---|
| Filename | modeM0/AS1A14_083T14_9000006564_56932cztM0_level2.fits | modeM0/AS1A14_083T14_9000006564_56932cztM0_level2_quad_clean.evt |
| Size (bytes) | 903,199,680 | 89,265,600 |
| Size | 861.4 MB | 85.1 MB |
| Events in quadrant A | 5,078,900 | 676,885 |
| Events in quadrant B | 7,427,784 | 689,543 |
| Events in quadrant C | 3,828,269 | 661,129 |
| Events in quadrant D | 16,528,065 | 162,025 |
| Mode SS | |||
|---|---|---|---|
| Quadrant | BADHDUFLAG | Total packets | Discarded packets |
| A | 0 | 148 | 0 |
| B | 0 | 148 | 0 |
| C | 0 | 148 | 0 |
| D | 0 | 148 | 0 |
| Mode M0 | |||
|---|---|---|---|
| Quadrant | BADHDUFLAG | Total packets | Discarded packets |
| A | 0 | 20074 | 1 |
| B | 0 | 27283 | 1 |
| C | 0 | 17046 | 1 |
| D | 0 | 54085 | 8 |
| Quadrant | Total seconds | Saturated seconds | Saturation percentage |
|---|---|---|---|
| A | 7367 | 277 | 3.760011% |
| B | 7367 | 827 | 11.225736% |
| C | 7368 | 66 | 0.895765% |
| D | 7367 | 5852 | 79.435320% |
Noise dominated data is calculated using 1-second bins in cleaned event files. If a bin has >2000 counts, and if more than 50% of those come from <1% of pixels, then it is considered to be noise-dominated and hence unusable.
| Quadrant | # 1 sec bins | Bins with >0 counts | Bins with >2000 counts | High rate bins dominated by noise | Noise dominated (total time) | Noise dominated (detector-on time) | Marked lightcurve |
|---|---|---|---|---|---|---|---|
| A | 7392 | 7368 | 253 | 253 | 3.42% | 3.43% | 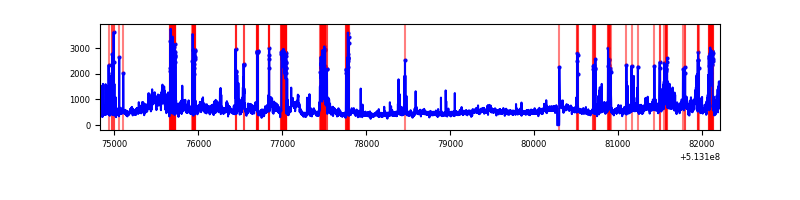 |
| B | 7392 | 7368 | 743 | 743 | 10.05% | 10.08% | 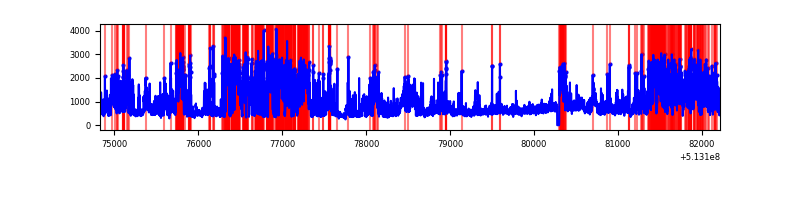 |
| C | 7393 | 7369 | 66 | 66 | 0.89% | 0.90% | 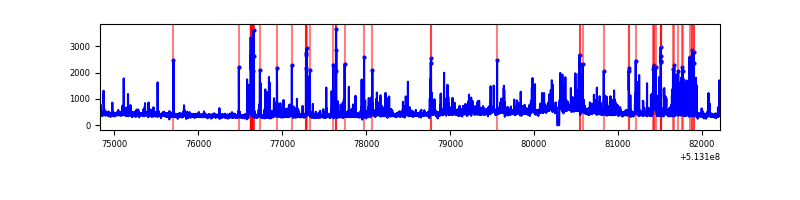 |
| D | 7391 | 7367 | 5630 | 5630 | 76.17% | 76.42% | 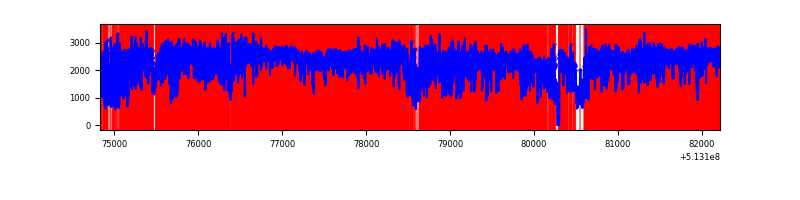 |
Top three noisy pixels from each quadrant. If the there are fewer than three noisy pixels in the level2.evt file, extra rows are filled as -1
| Pixel properties | Quadrant properties | ||||||
|---|---|---|---|---|---|---|---|
| Quadrant | DetID | PixID | Counts | Sigma | Mean | Median | Sigma |
| A | 7 | 64 | 1462141 | 7776.86 | 765 | 747 | 187.9 |
| A | 10 | 251 | 412700 | 2192.22 | 765 | 747 | 187.9 |
| A | 3 | 11 | 106468 | 562.6 | 765 | 747 | 187.9 |
| B | 5 | 185 | 3423903 | 21659.45 | 741 | 714 | 158.0 |
| B | 5 | 172 | 694593 | 4390.36 | 741 | 714 | 158.0 |
| B | 10 | 16 | 134232 | 844.8 | 741 | 714 | 158.0 |
| C | 13 | 3 | 569202 | 2743.53 | 749 | 740 | 207.2 |
| C | 1 | 12 | 131275 | 629.99 | 749 | 740 | 207.2 |
| C | 14 | 246 | 96811 | 463.66 | 749 | 740 | 207.2 |
| D | 12 | 33 | 12388481 | 86839.89 | 495 | 471 | 142.7 |
| D | 2 | 249 | 879481 | 6161.86 | 495 | 471 | 142.7 |
| D | 15 | 142 | 668715 | 4684.39 | 495 | 471 | 142.7 |
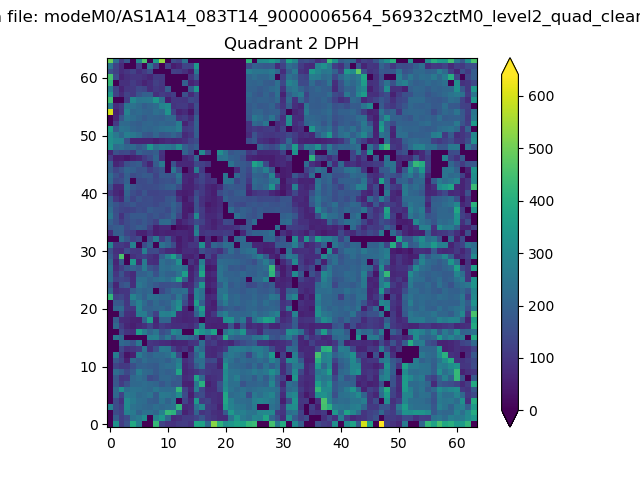
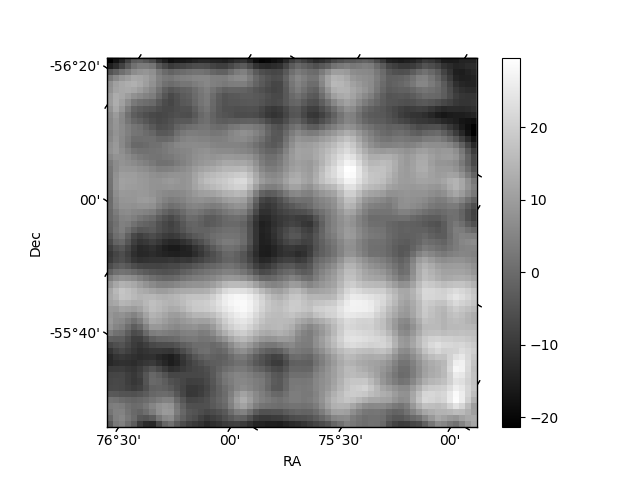
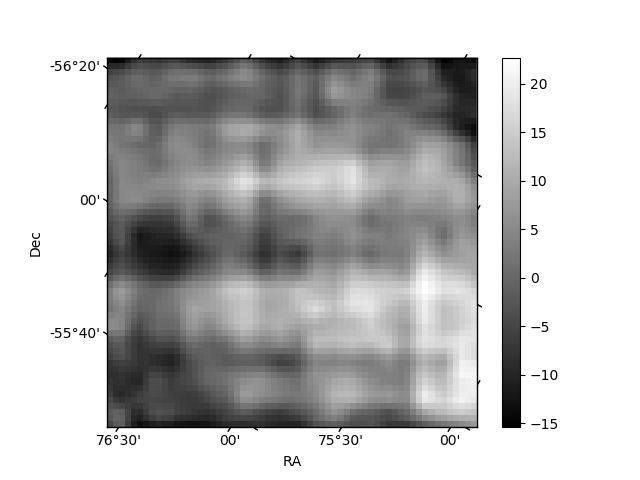
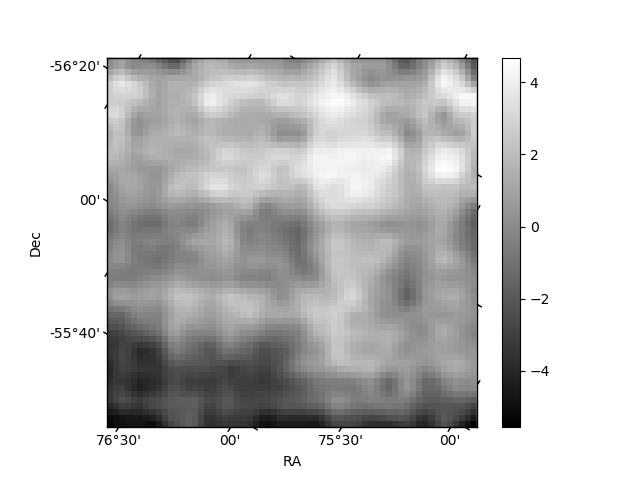
Histogram calculated using DETX and DETY for each event in the final _common_clean file
| Quadrant A | 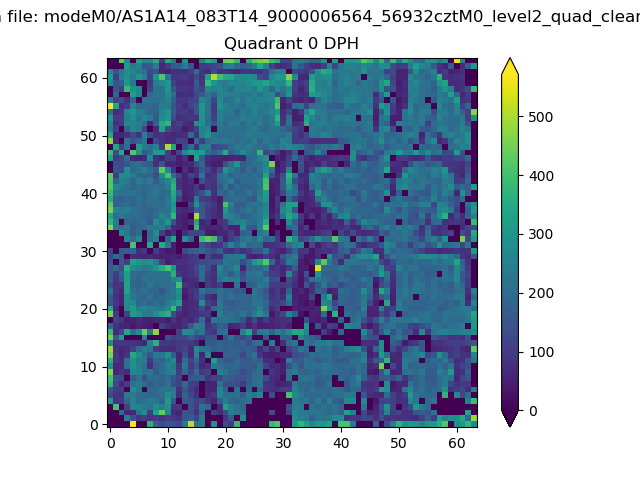 |
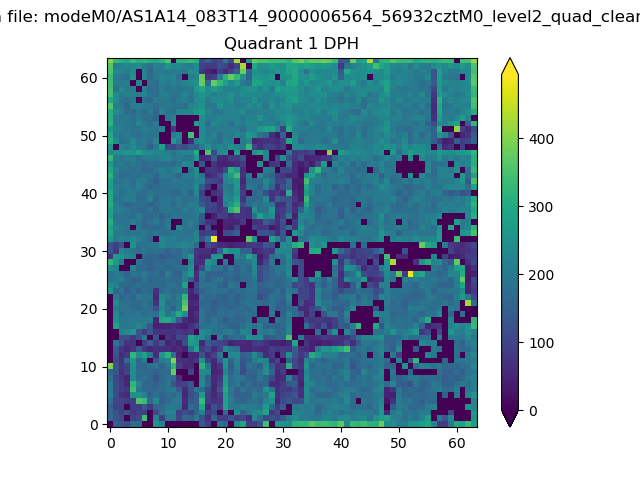 |
Quadrant B |
|---|---|---|---|
| Quadrant D | 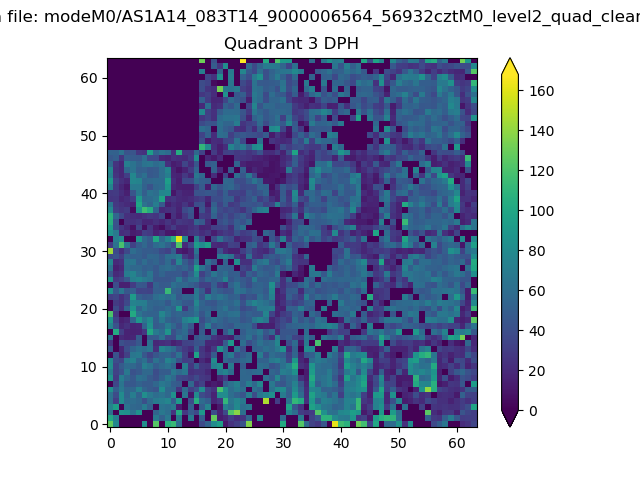 |
 |
Quadrant C |
| Plot type | Count rate plots | Images |
|---|---|---|
| Comparison with Poisson distribution Blue bars denote a histogram of data divided into 1 sec bins. Red curve is a Poisson curve with rate = median count rate of data. |
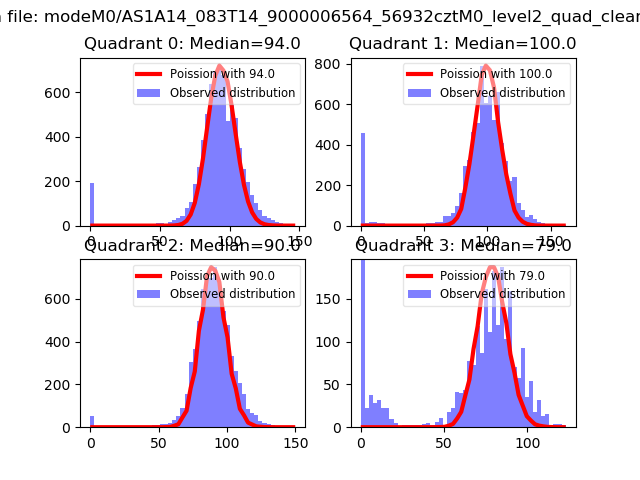 |
 |
| Quadrant-wise count rates Data is divided into 100 sec bins |
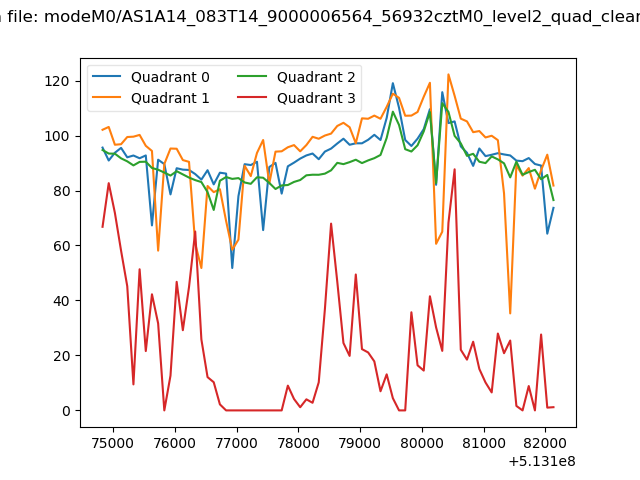 |
|
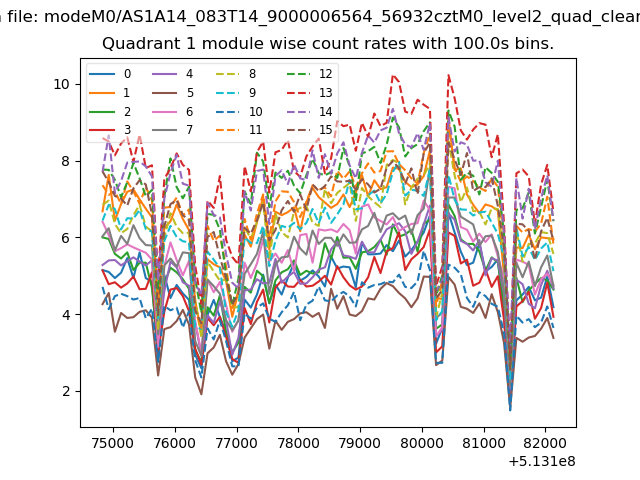
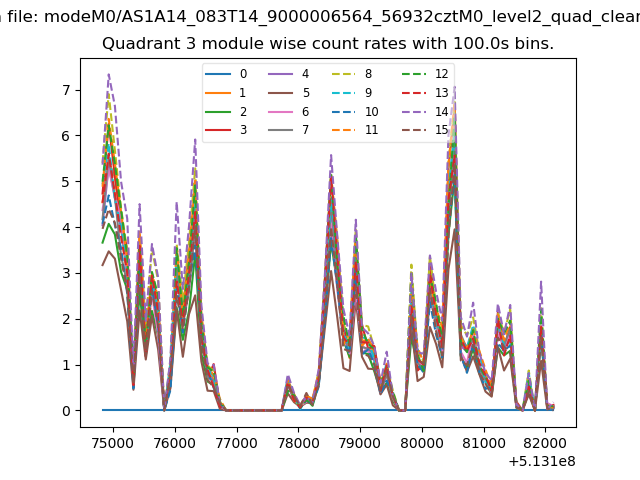
| Module-wise count rates for Quadrant A Data is divided into 100 sec bins |
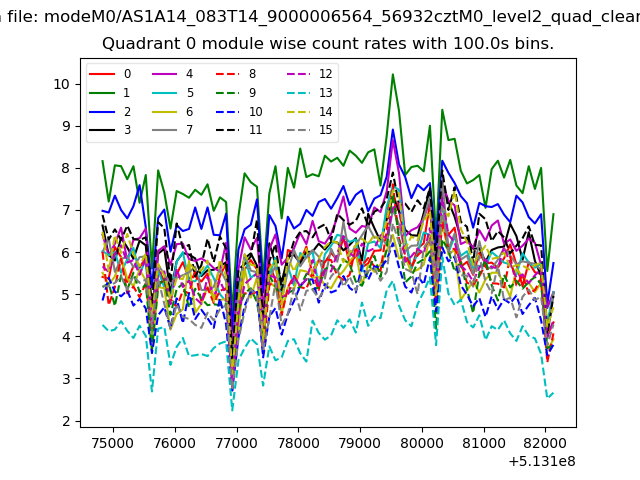 |
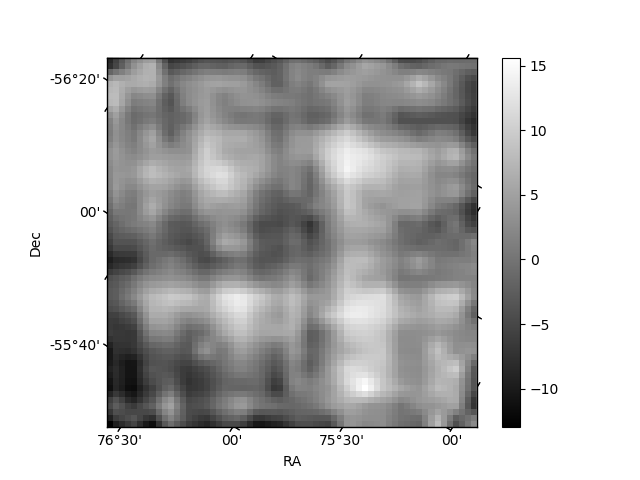 |
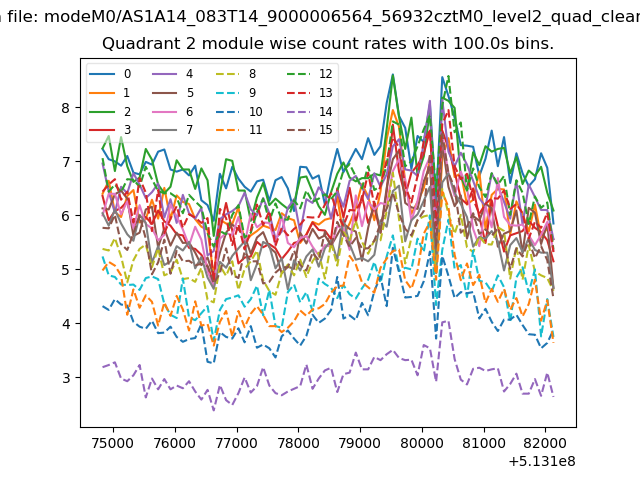
| Module-wise count rates for Quadrant B Data is divided into 100 sec bins |
 |
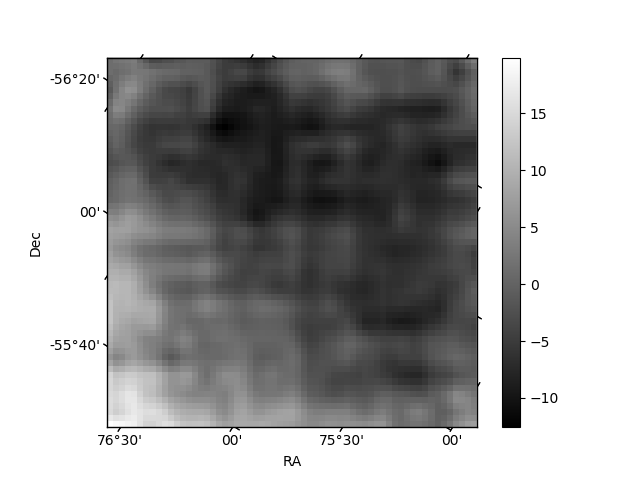 |
| Module-wise count rates for Quadrant C Data is divided into 100 sec bins |
 |
 |
| Module-wise count rates for Quadrant D Data is divided into 100 sec bins |
 |
 |
| Parameter | Plot |
|---|---|
| CZT HV Monitor | 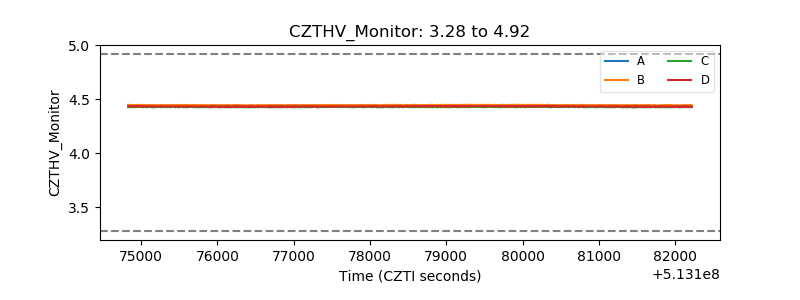 |
| D_VDD | 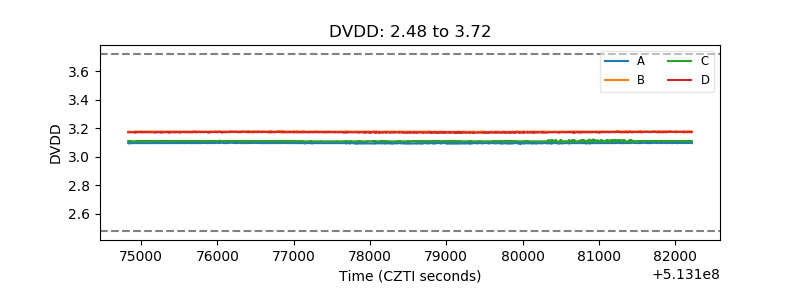 |
| Temperature 1 | 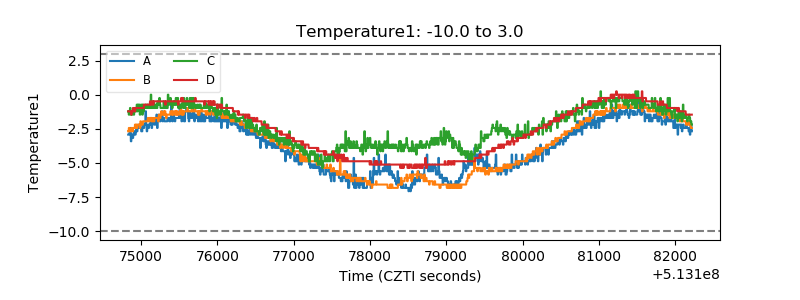 |
| Veto HV Monitor | 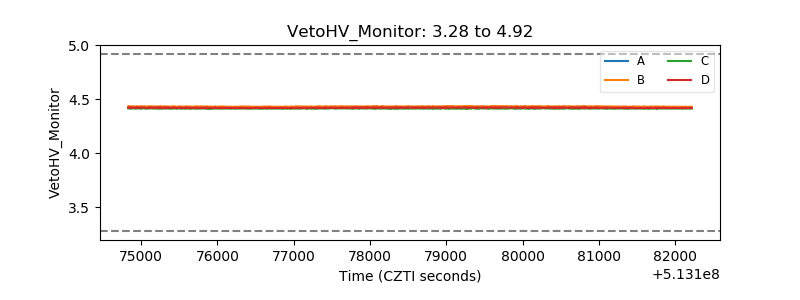 |
| Veto LLD | 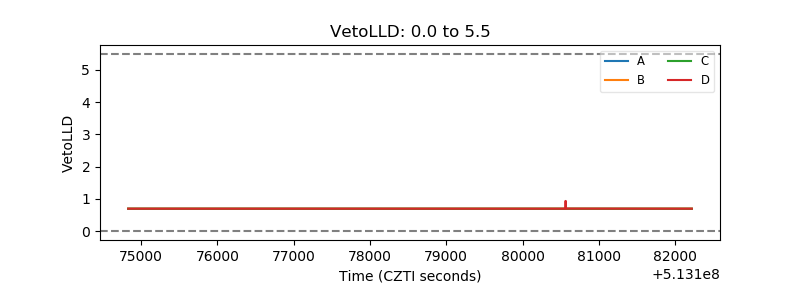 |
| Alpha Counter | 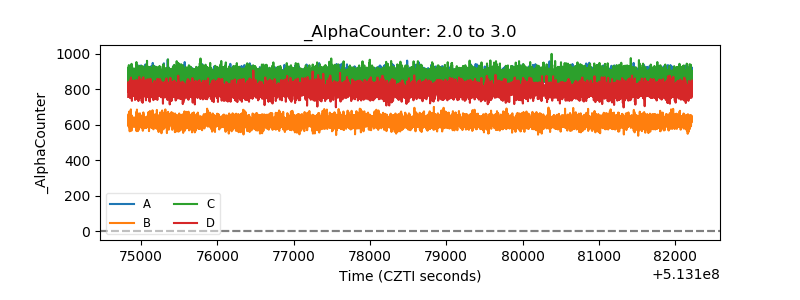 |
| _CPM_Rate | 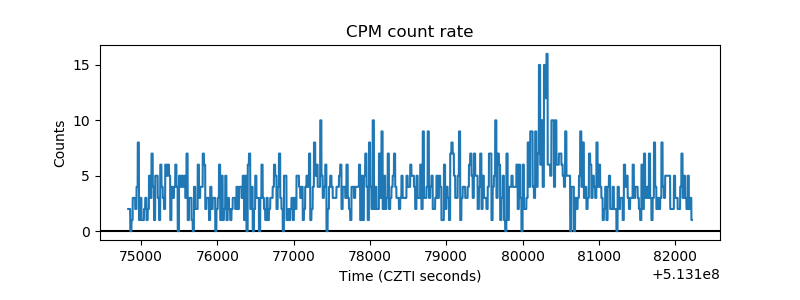 |
| CZT Counter | 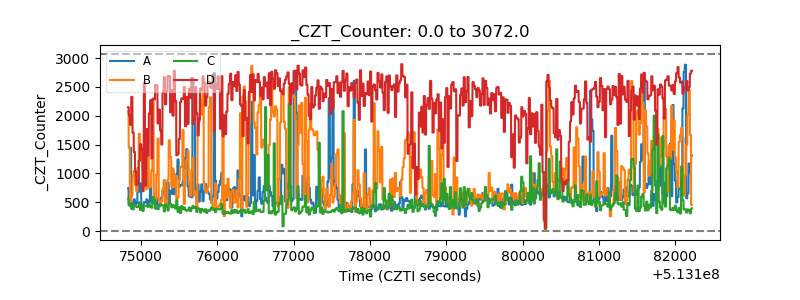 |
| +2.5 Volts monitor | 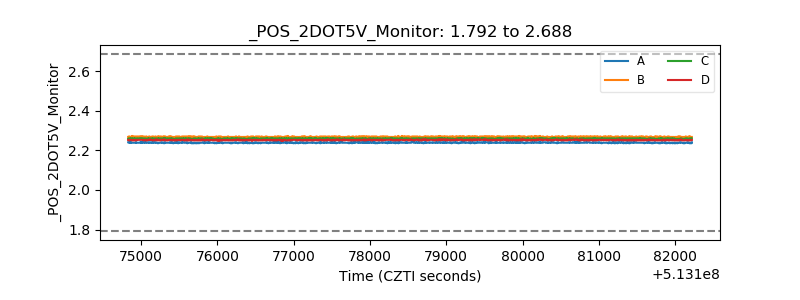 |
| +5 Volts monitor |  |
| _ROLL_ROT | 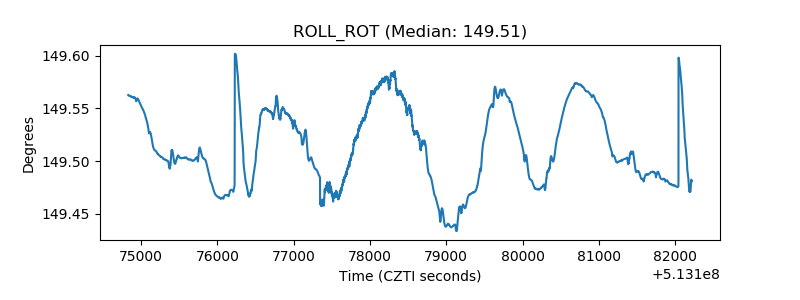 |
| _Roll_DEC | 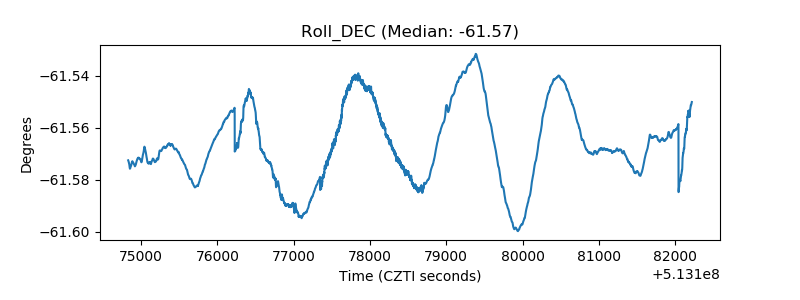 |
| _Roll_RA | 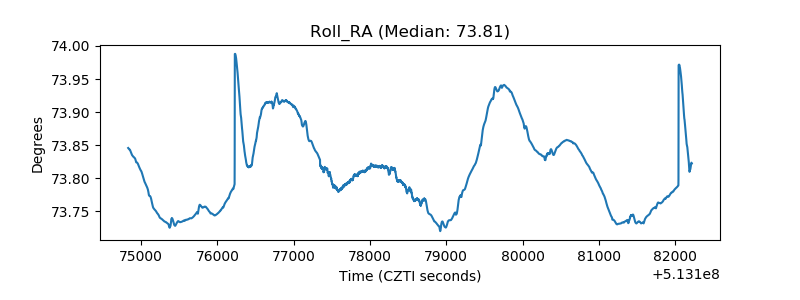 |
| Veto Counter | 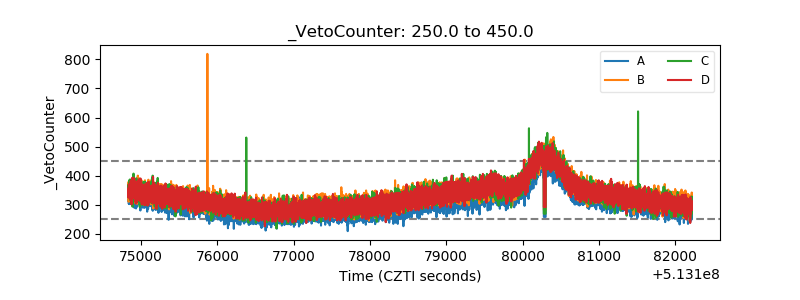 |