| Param | Original file | Final file |
|---|---|---|
| Filename | modeM0/AS1A14_083T14_9000006564_56933cztM0_level2.fits | modeM0/AS1A14_083T14_9000006564_56933cztM0_level2_quad_clean.evt |
| Size (bytes) | 834,500,160 | 80,691,840 |
| Size | 795.8 MB | 77.0 MB |
| Events in quadrant A | 4,817,417 | 618,940 |
| Events in quadrant B | 6,011,923 | 645,343 |
| Events in quadrant C | 4,071,233 | 581,507 |
| Events in quadrant D | 15,465,183 | 124,879 |
| Mode SS | |||
|---|---|---|---|
| Quadrant | BADHDUFLAG | Total packets | Discarded packets |
| A | 0 | 138 | 0 |
| B | 0 | 138 | 2 |
| C | 0 | 138 | 2 |
| D | 0 | 138 | 0 |
| Mode M0 | |||
|---|---|---|---|
| Quadrant | BADHDUFLAG | Total packets | Discarded packets |
| A | 0 | 19195 | 302 |
| B | 0 | 23301 | 729 |
| C | 0 | 17628 | 313 |
| D | 0 | 51557 | 1021 |
| Quadrant | Total seconds | Saturated seconds | Saturation percentage |
|---|---|---|---|
| A | 6785 | 237 | 3.492999% |
| B | 6768 | 506 | 7.476359% |
| C | 6785 | 254 | 3.743552% |
| D | 6747 | 5526 | 81.903068% |
Noise dominated data is calculated using 1-second bins in cleaned event files. If a bin has >2000 counts, and if more than 50% of those come from <1% of pixels, then it is considered to be noise-dominated and hence unusable.
| Quadrant | # 1 sec bins | Bins with >0 counts | Bins with >2000 counts | High rate bins dominated by noise | Noise dominated (total time) | Noise dominated (detector-on time) | Marked lightcurve |
|---|---|---|---|---|---|---|---|
| A | 6866 | 6816 | 210 | 210 | 3.06% | 3.08% | 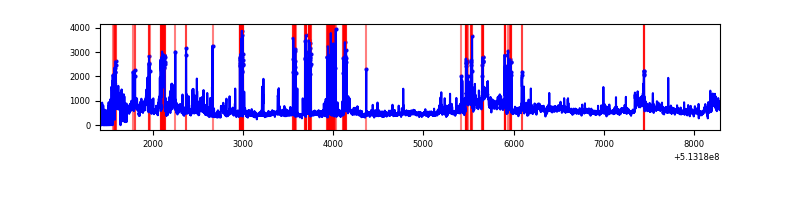 |
| B | 6855 | 6795 | 401 | 401 | 5.85% | 5.90% | 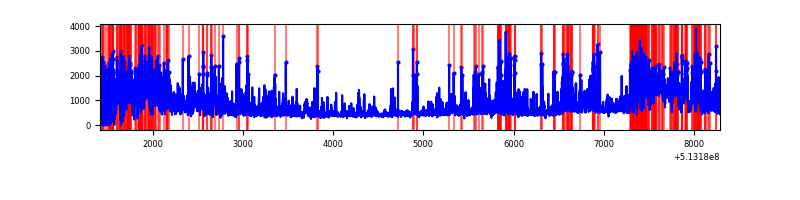 |
| C | 6874 | 6819 | 224 | 224 | 3.26% | 3.28% | 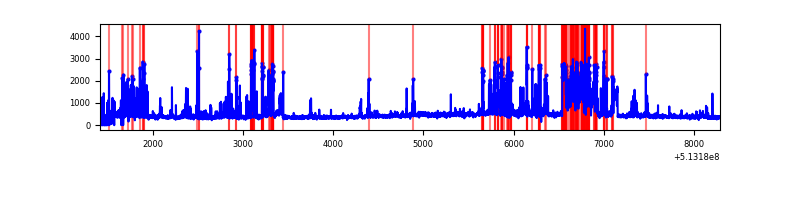 |
| D | 6847 | 6755 | 5374 | 5374 | 78.49% | 79.56% | 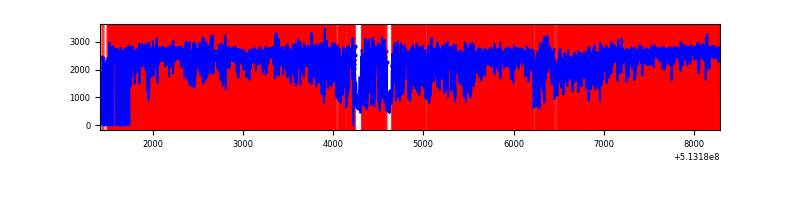 |
Top three noisy pixels from each quadrant. If the there are fewer than three noisy pixels in the level2.evt file, extra rows are filled as -1
| Pixel properties | Quadrant properties | ||||||
|---|---|---|---|---|---|---|---|
| Quadrant | DetID | PixID | Counts | Sigma | Mean | Median | Sigma |
| A | 7 | 64 | 1435077 | 8179.77 | 693 | 673 | 175.4 |
| A | 3 | 79 | 211784 | 1203.87 | 693 | 673 | 175.4 |
| A | 10 | 251 | 192939 | 1096.41 | 693 | 673 | 175.4 |
| B | 5 | 185 | 2857308 | 19910.61 | 678 | 655 | 143.5 |
| B | 5 | 172 | 226242 | 1572.32 | 678 | 655 | 143.5 |
| B | 0 | 245 | 52071 | 358.36 | 678 | 655 | 143.5 |
| C | 13 | 3 | 1109834 | 6030.68 | 668 | 663 | 183.9 |
| C | 0 | 129 | 117766 | 636.7 | 668 | 663 | 183.9 |
| C | 14 | 254 | 67561 | 363.73 | 668 | 663 | 183.9 |
| D | 12 | 33 | 12262441 | 98188.07 | 430 | 410 | 124.9 |
| D | 2 | 249 | 769603 | 6159.3 | 430 | 410 | 124.9 |
| D | 8 | 240 | 328514 | 2627.29 | 430 | 410 | 124.9 |
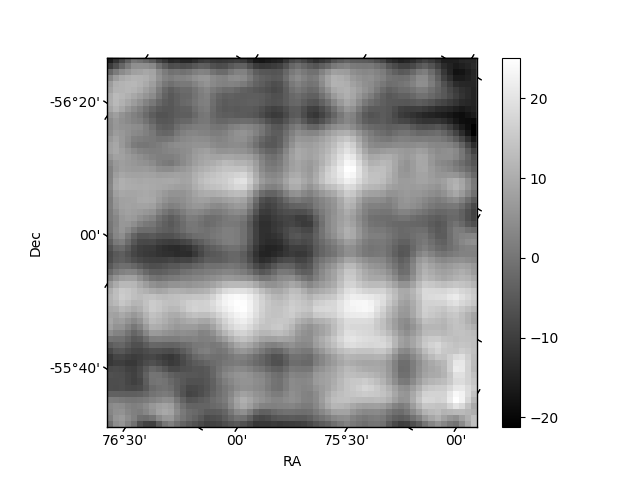
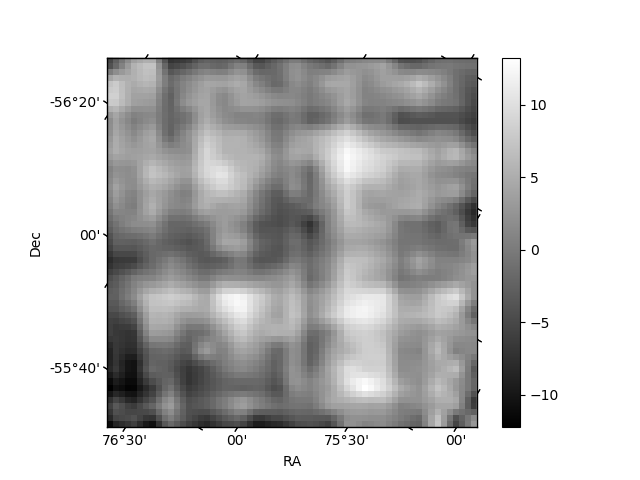
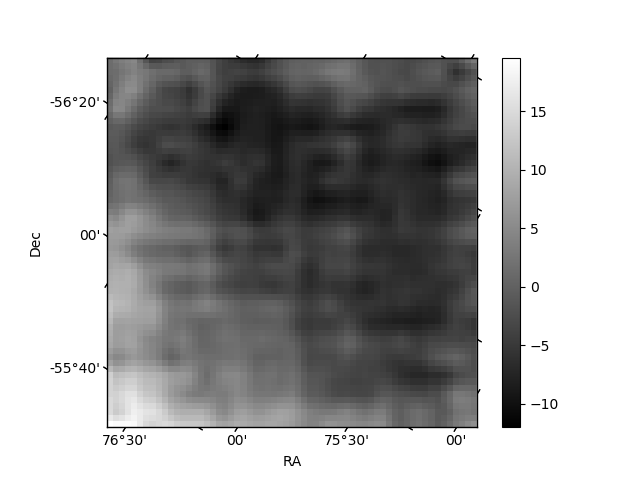
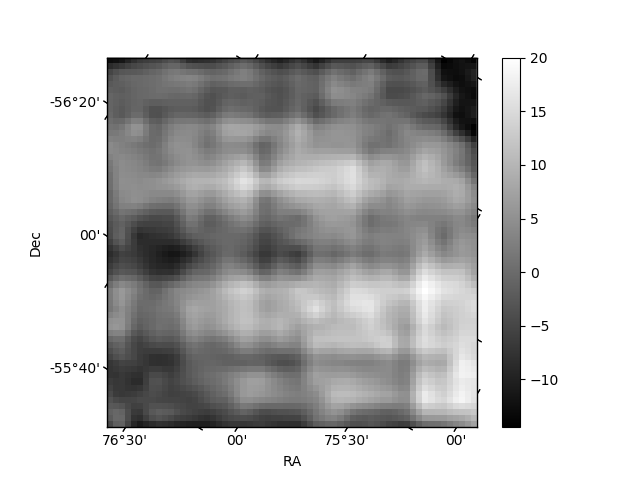
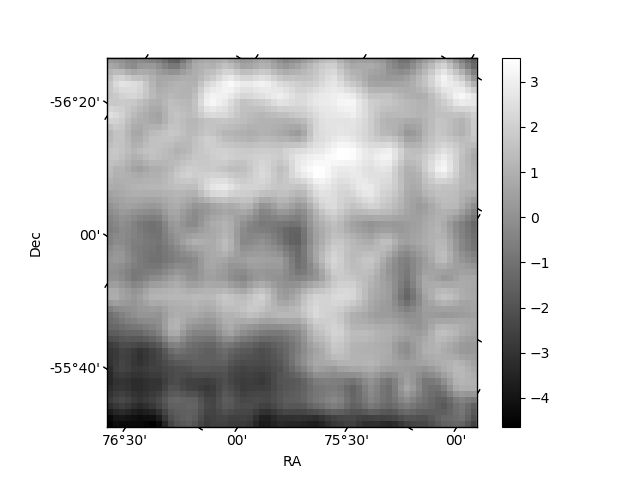
Histogram calculated using DETX and DETY for each event in the final _common_clean file
| Quadrant A | 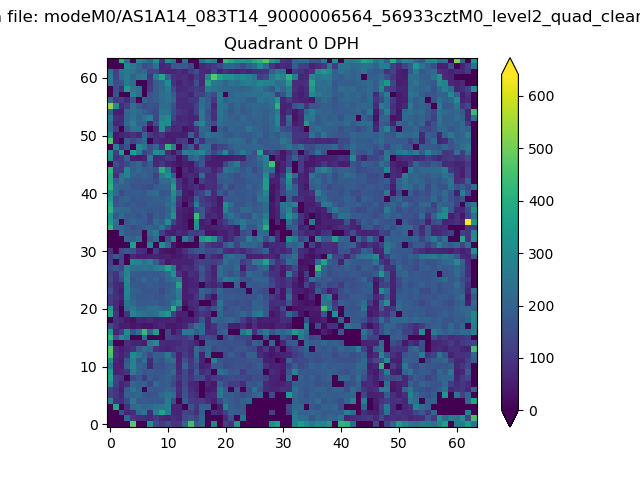 |
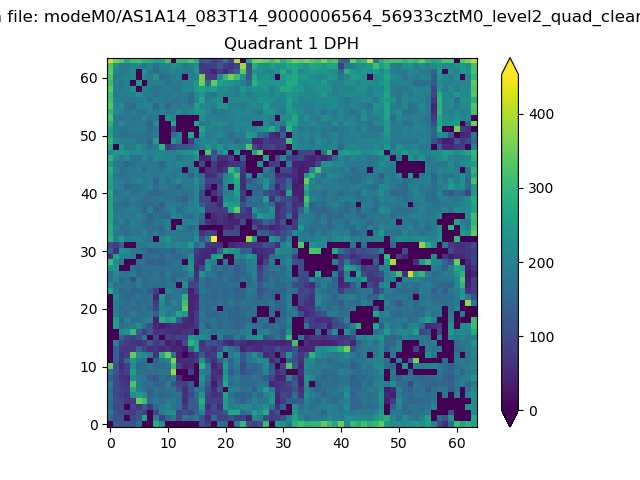 |
Quadrant B |
|---|---|---|---|
| Quadrant D | 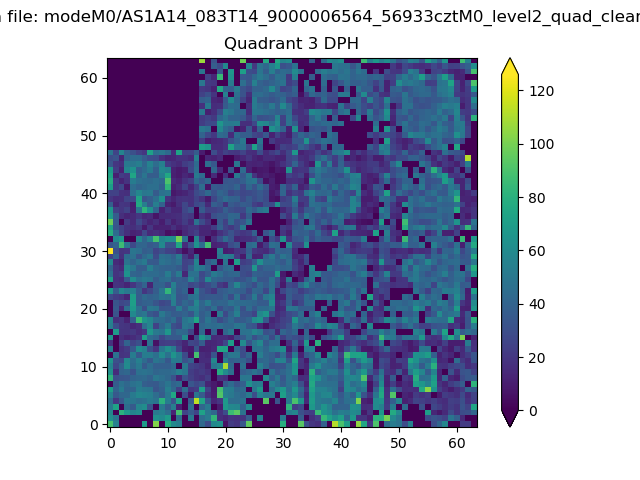 |
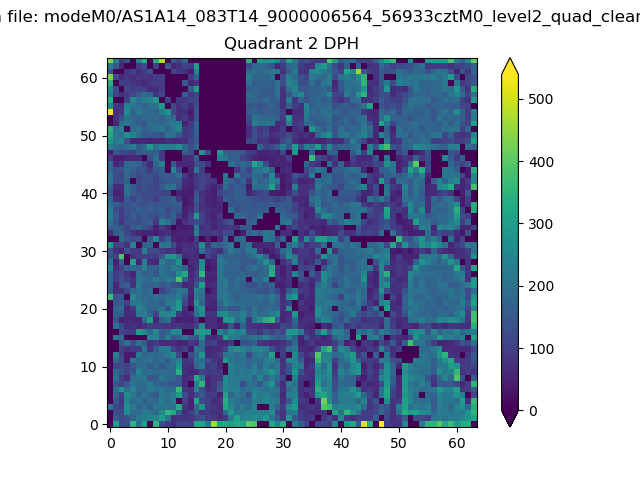 |
Quadrant C |
| Plot type | Count rate plots | Images |
|---|---|---|
| Comparison with Poisson distribution Blue bars denote a histogram of data divided into 1 sec bins. Red curve is a Poisson curve with rate = median count rate of data. |
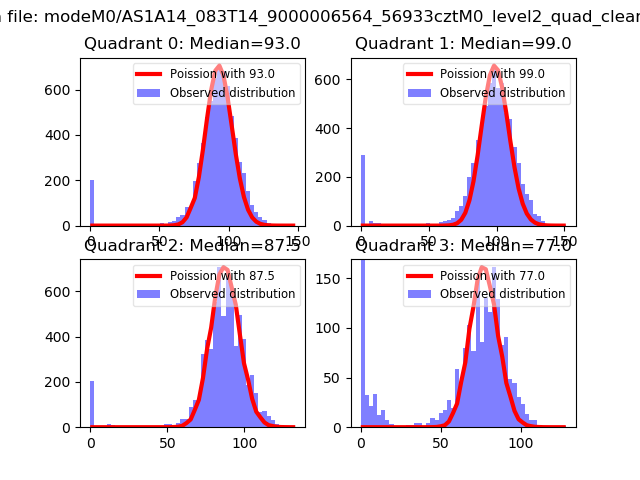 |
 |
| Quadrant-wise count rates Data is divided into 100 sec bins |
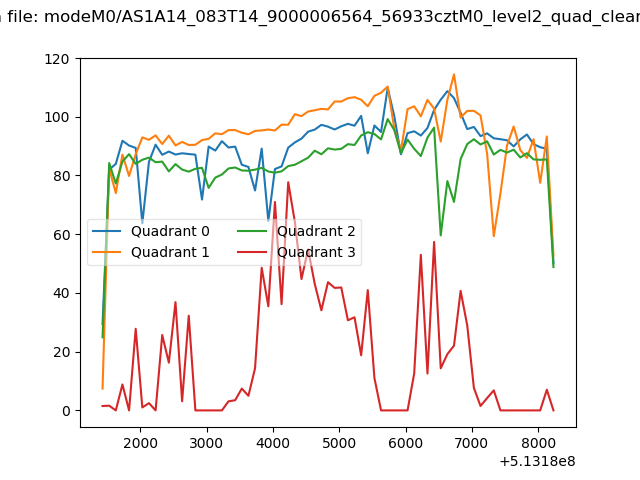 |
|
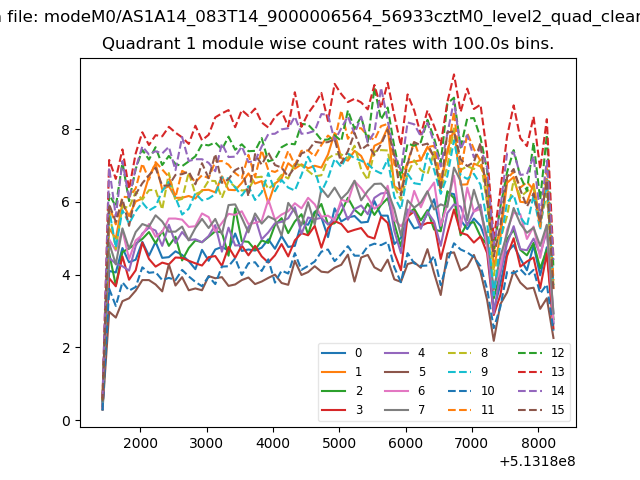
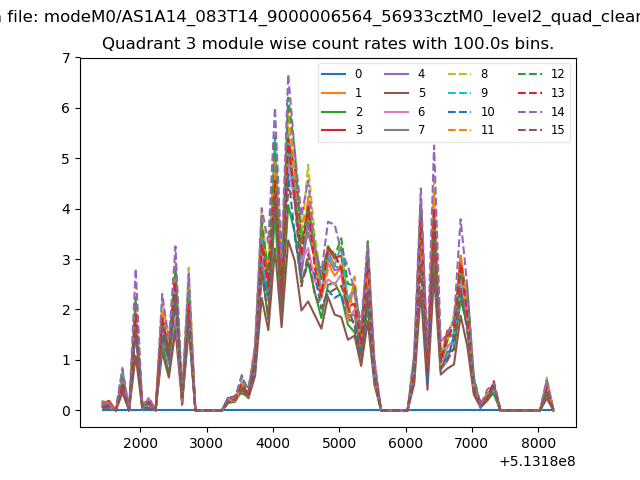
| Module-wise count rates for Quadrant A Data is divided into 100 sec bins |
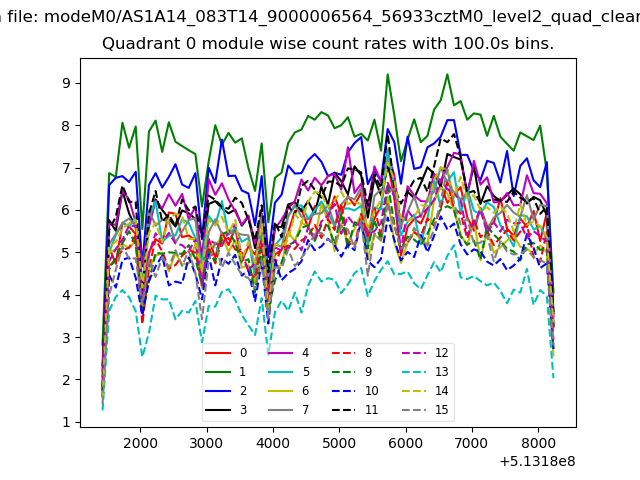 |
 |
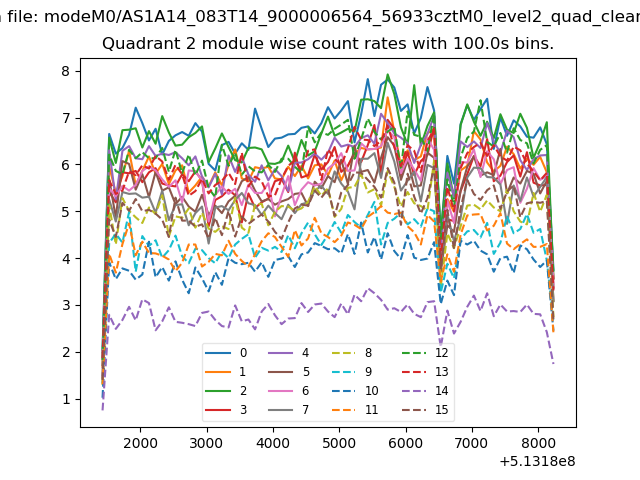
| Module-wise count rates for Quadrant B Data is divided into 100 sec bins |
 |
 |
| Module-wise count rates for Quadrant C Data is divided into 100 sec bins |
 |
 |
| Module-wise count rates for Quadrant D Data is divided into 100 sec bins |
 |
 |
| Parameter | Plot |
|---|---|
| CZT HV Monitor | 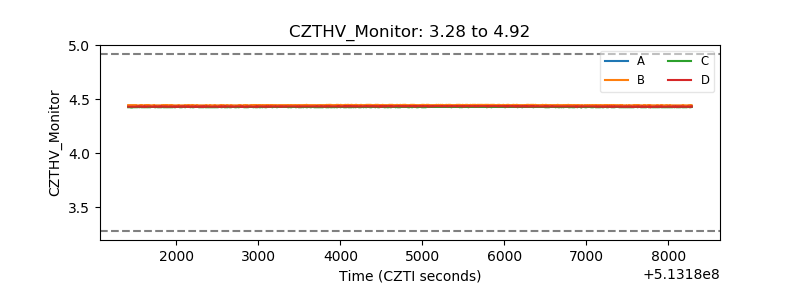 |
| D_VDD | 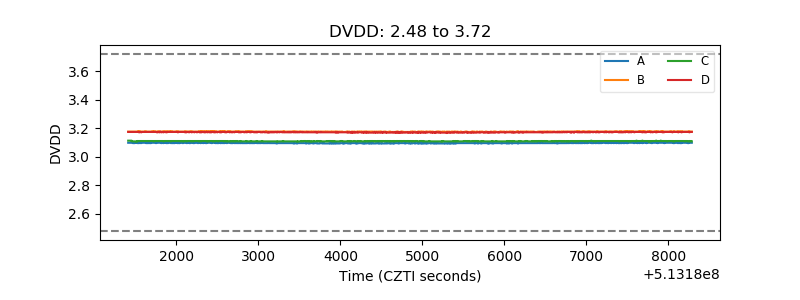 |
| Temperature 1 | 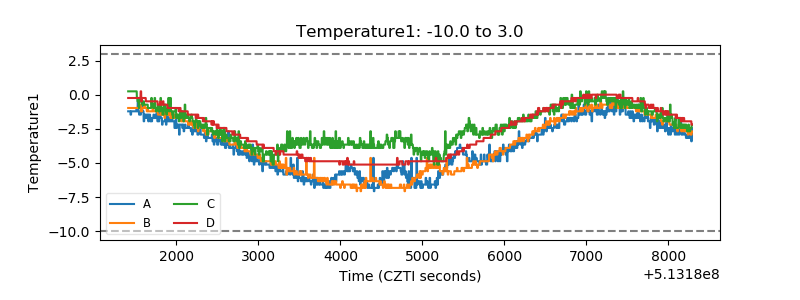 |
| Veto HV Monitor | 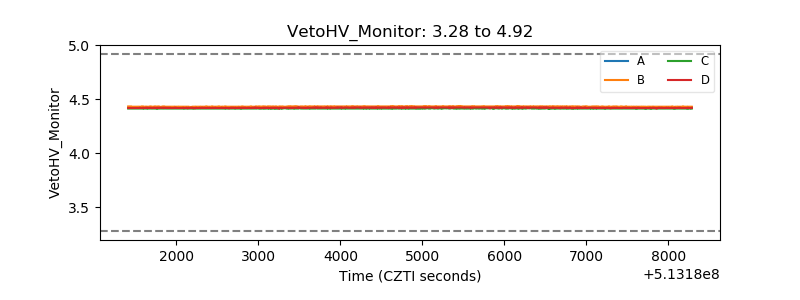 |
| Veto LLD | 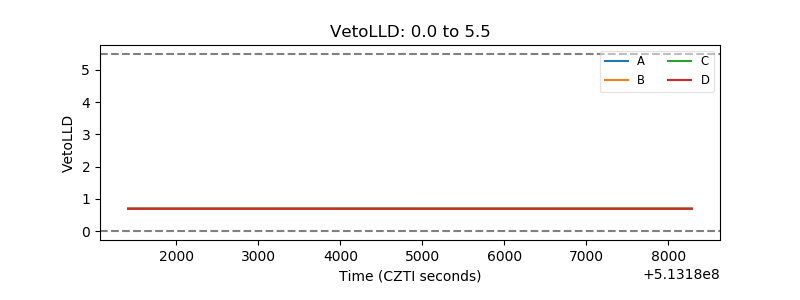 |
| Alpha Counter | 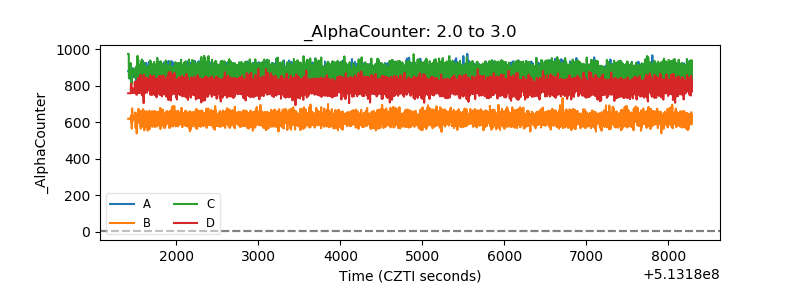 |
| _CPM_Rate | 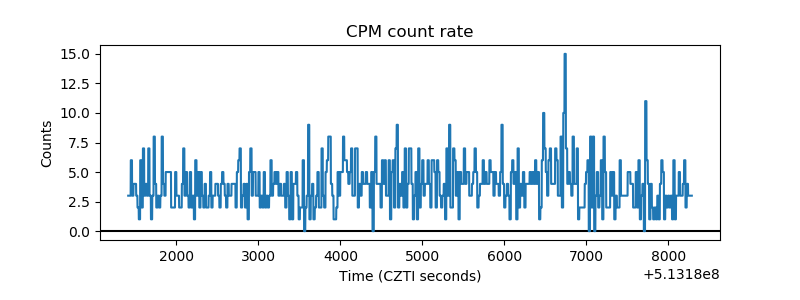 |
| CZT Counter | 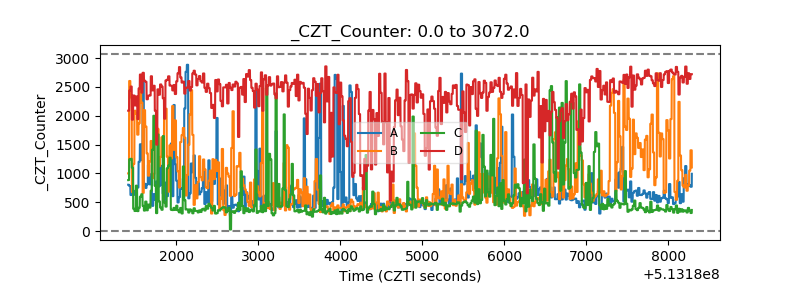 |
| +2.5 Volts monitor | 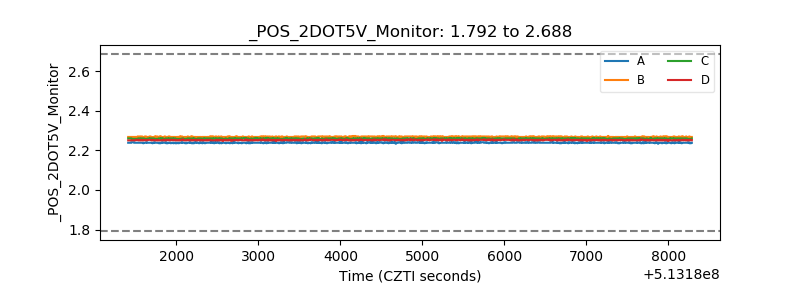 |
| +5 Volts monitor |  |
| _ROLL_ROT | 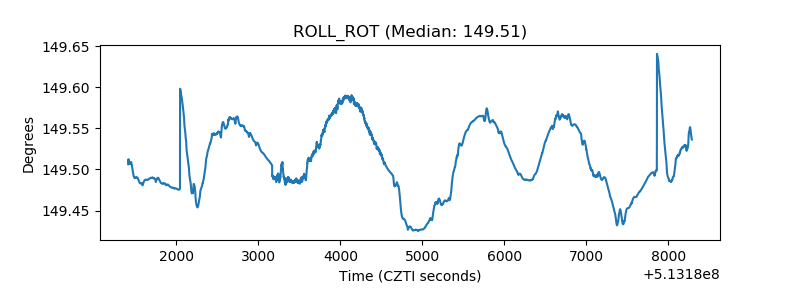 |
| _Roll_DEC | 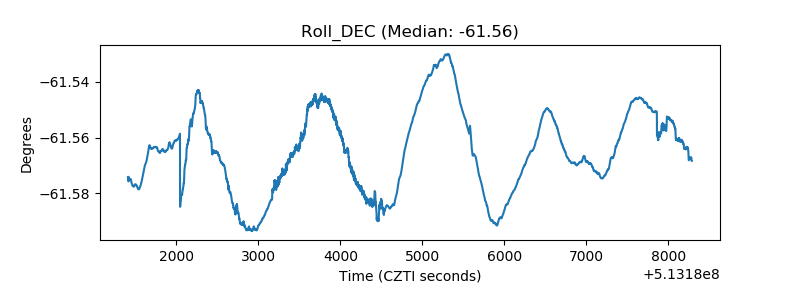 |
| _Roll_RA | 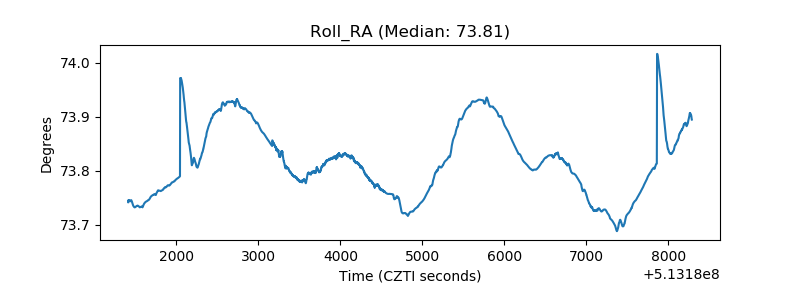 |
| Veto Counter | 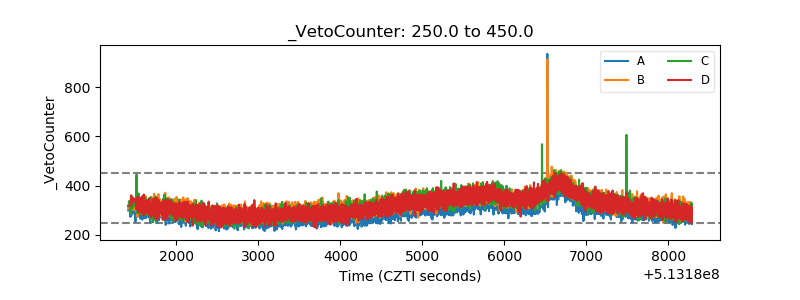 |