| Param | Original file | Final file |
|---|---|---|
| Filename | modeM0/AS1A14_083T14_9000006564_56934cztM0_level2.fits | modeM0/AS1A14_083T14_9000006564_56934cztM0_level2_quad_clean.evt |
| Size (bytes) | 968,325,120 | 82,172,160 |
| Size | 923.5 MB | 78.4 MB |
| Events in quadrant A | 5,065,320 | 648,444 |
| Events in quadrant B | 6,989,905 | 629,845 |
| Events in quadrant C | 5,181,850 | 605,247 |
| Events in quadrant D | 18,032,952 | 88,475 |
| Mode SS | |||
|---|---|---|---|
| Quadrant | BADHDUFLAG | Total packets | Discarded packets |
| A | 0 | 148 | 0 |
| B | 0 | 148 | 0 |
| C | 0 | 148 | 0 |
| D | 0 | 148 | 0 |
| Mode M0 | |||
|---|---|---|---|
| Quadrant | BADHDUFLAG | Total packets | Discarded packets |
| A | 0 | 20321 | 0 |
| B | 0 | 26188 | 0 |
| C | 0 | 21080 | 0 |
| D | 0 | 58662 | 2 |
| Quadrant | Total seconds | Saturated seconds | Saturation percentage |
|---|---|---|---|
| A | 7408 | 513 | 6.924946% |
| B | 7408 | 1217 | 16.428186% |
| C | 7409 | 653 | 8.813605% |
| D | 7408 | 6550 | 88.417927% |
Noise dominated data is calculated using 1-second bins in cleaned event files. If a bin has >2000 counts, and if more than 50% of those come from <1% of pixels, then it is considered to be noise-dominated and hence unusable.
| Quadrant | # 1 sec bins | Bins with >0 counts | Bins with >2000 counts | High rate bins dominated by noise | Noise dominated (total time) | Noise dominated (detector-on time) | Marked lightcurve |
|---|---|---|---|---|---|---|---|
| A | 7408 | 7408 | 449 | 449 | 6.06% | 6.06% | 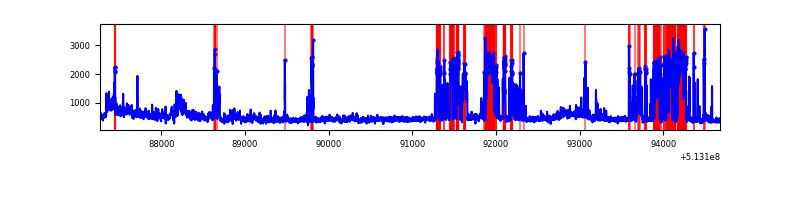 |
| B | 7408 | 7408 | 1007 | 1007 | 13.59% | 13.59% | 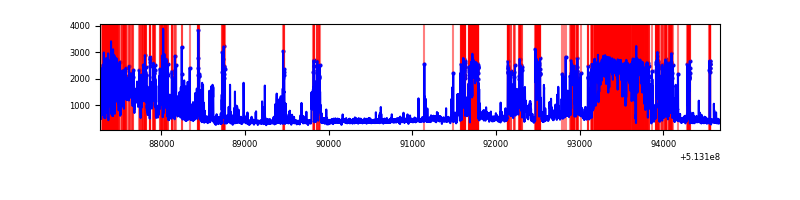 |
| C | 7409 | 7409 | 570 | 570 | 7.69% | 7.69% | 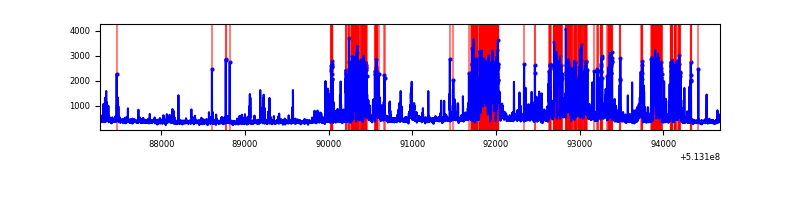 |
| D | 7407 | 7407 | 6454 | 6454 | 87.13% | 87.13% | 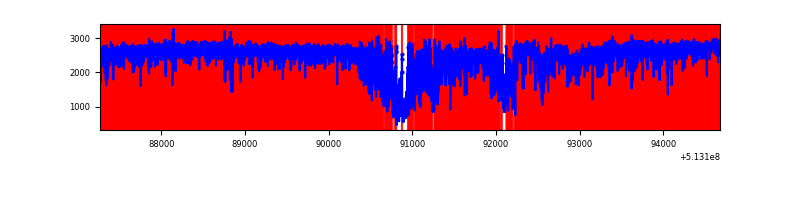 |
Top three noisy pixels from each quadrant. If the there are fewer than three noisy pixels in the level2.evt file, extra rows are filled as -1
| Pixel properties | Quadrant properties | ||||||
|---|---|---|---|---|---|---|---|
| Quadrant | DetID | PixID | Counts | Sigma | Mean | Median | Sigma |
| A | 7 | 64 | 1158558 | 6276.69 | 748 | 729 | 184.5 |
| A | 8 | 206 | 715265 | 3873.56 | 748 | 729 | 184.5 |
| A | 13 | 248 | 68891 | 369.51 | 748 | 729 | 184.5 |
| B | 5 | 172 | 2769400 | 18167.61 | 709 | 684 | 152.4 |
| B | 5 | 185 | 1132890 | 7429.25 | 709 | 684 | 152.4 |
| B | 0 | 245 | 51768 | 335.2 | 709 | 684 | 152.4 |
| C | 12 | 249 | 1181584 | 6047.52 | 705 | 699 | 195.3 |
| C | 13 | 3 | 942519 | 4823.22 | 705 | 699 | 195.3 |
| C | 14 | 254 | 63299 | 320.59 | 705 | 699 | 195.3 |
| D | 12 | 33 | 15507478 | 133757.08 | 404 | 386 | 115.9 |
| D | 2 | 249 | 231477 | 1993.29 | 404 | 386 | 115.9 |
| D | 8 | 240 | 161932 | 1393.42 | 404 | 386 | 115.9 |
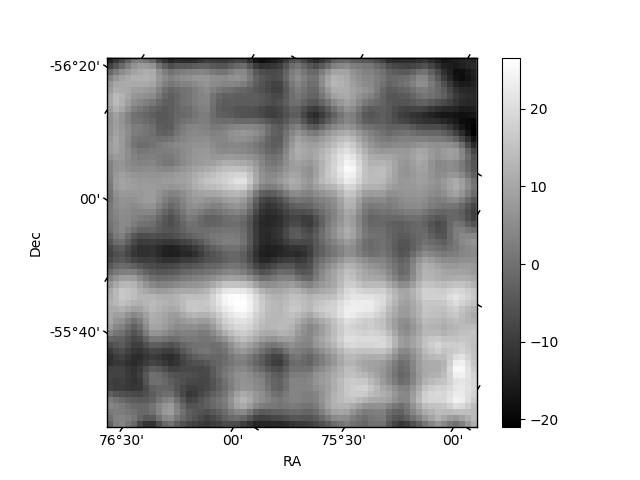
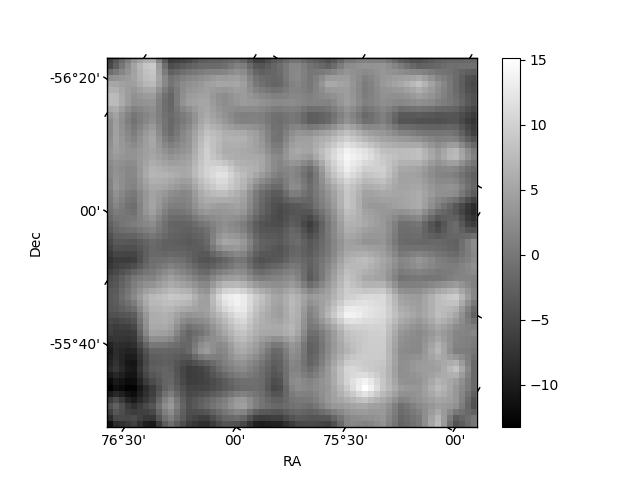
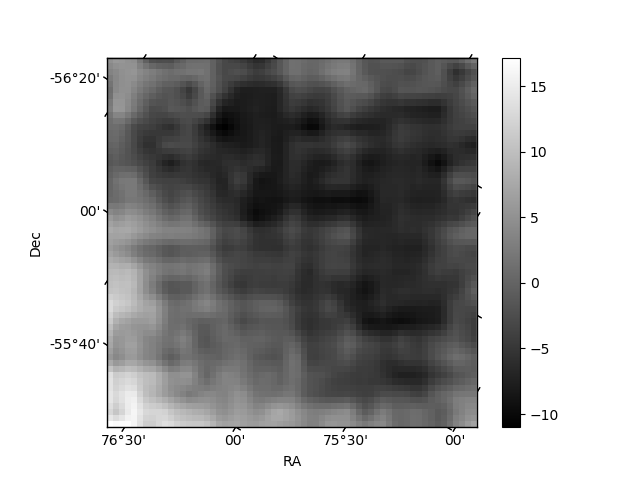
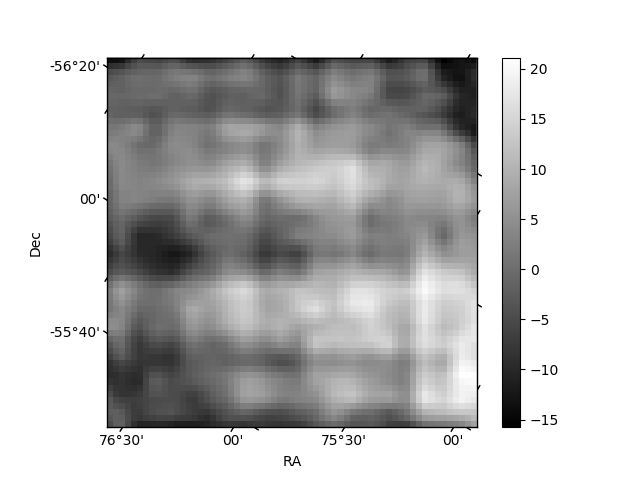
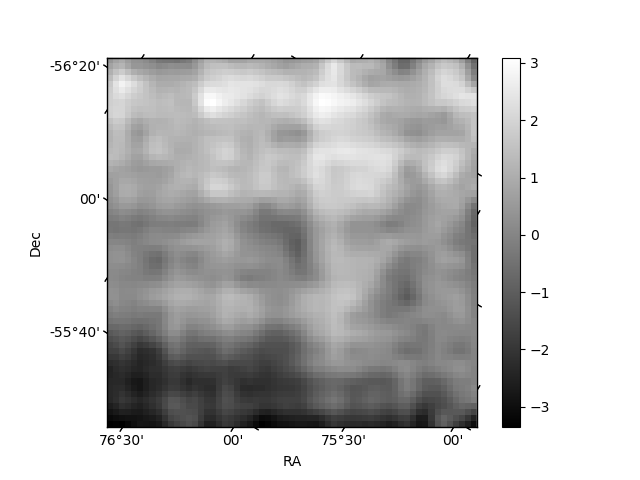
Histogram calculated using DETX and DETY for each event in the final _common_clean file
| Quadrant A | 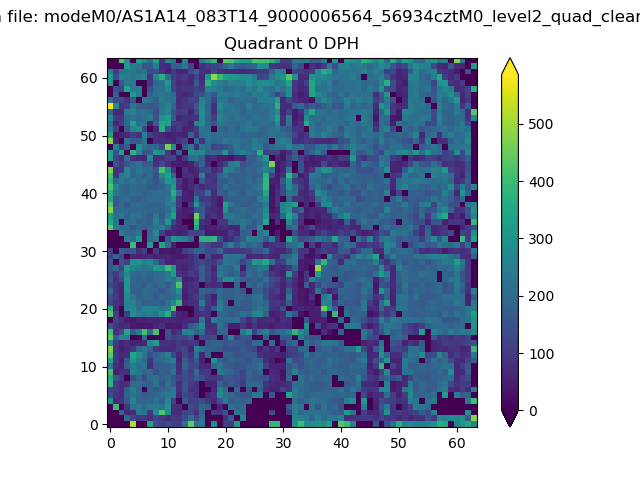 |
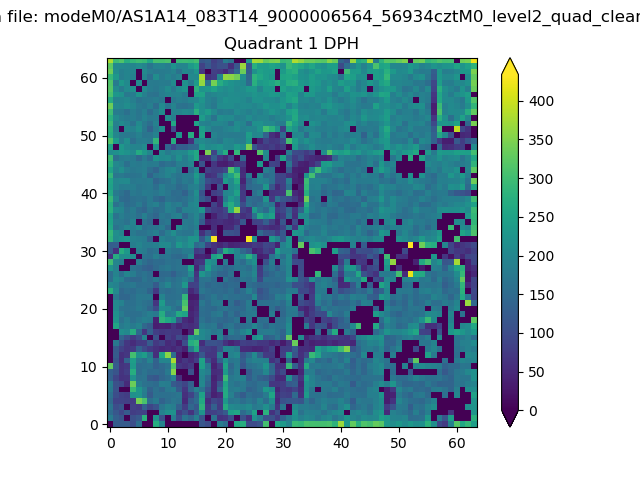 |
Quadrant B |
|---|---|---|---|
| Quadrant D | 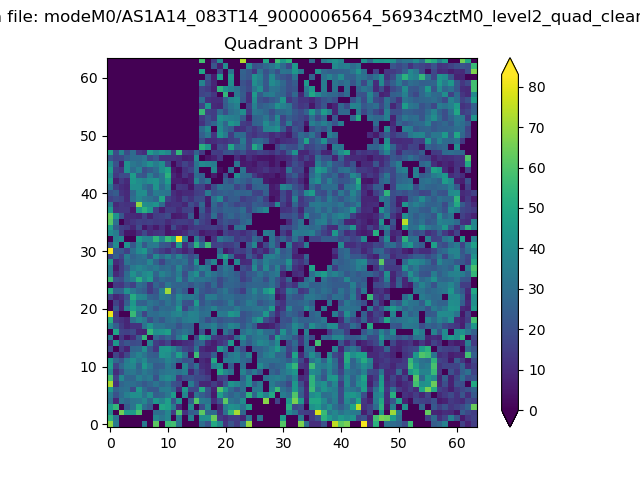 |
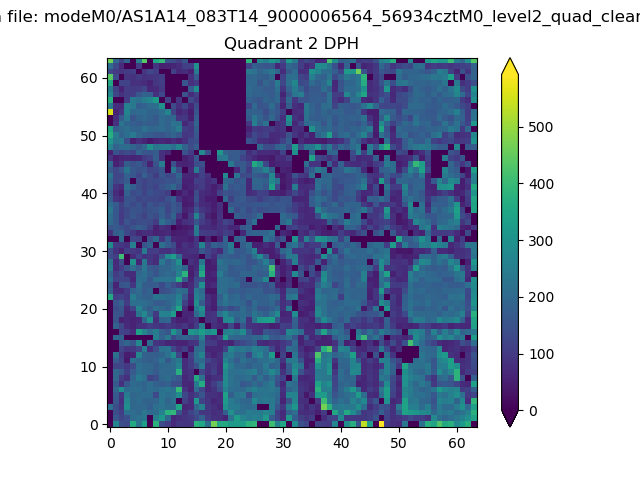 |
Quadrant C |
| Plot type | Count rate plots | Images |
|---|---|---|
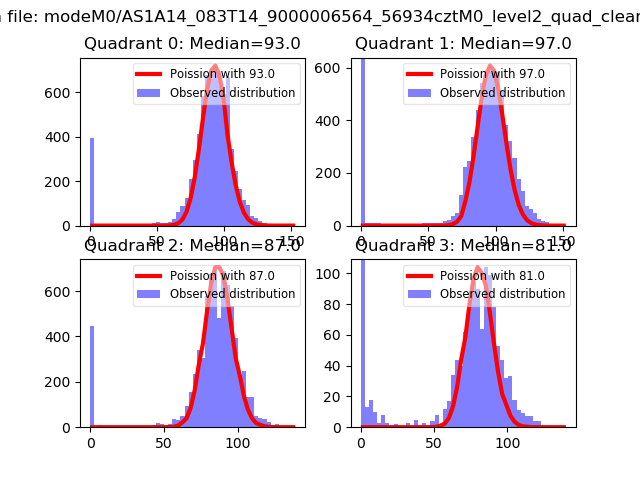
| Comparison with Poisson distribution Blue bars denote a histogram of data divided into 1 sec bins. Red curve is a Poisson curve with rate = median count rate of data. |
 |
 |
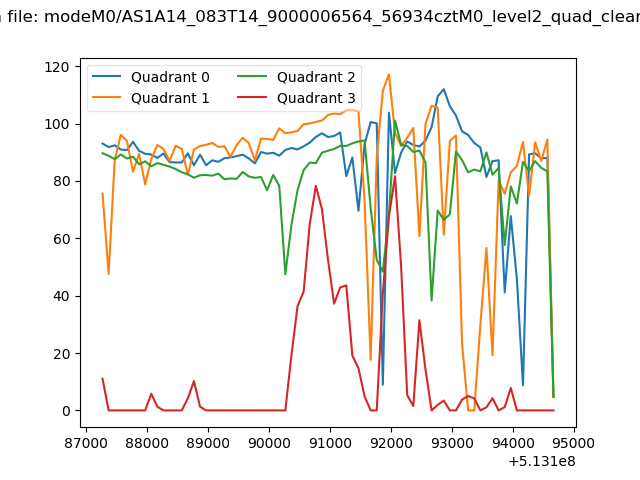
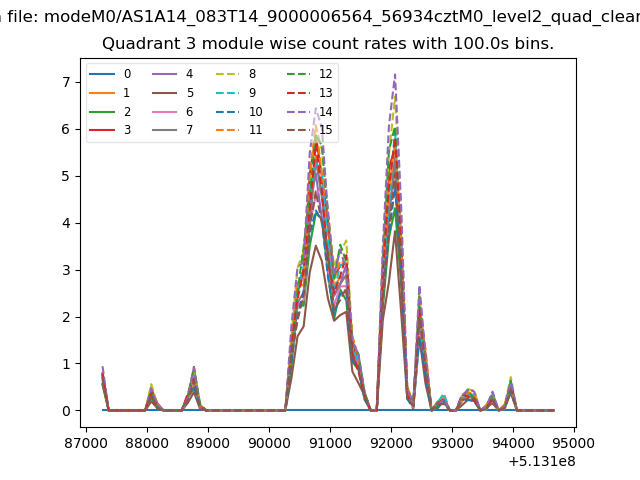
| Quadrant-wise count rates Data is divided into 100 sec bins |
 |
|
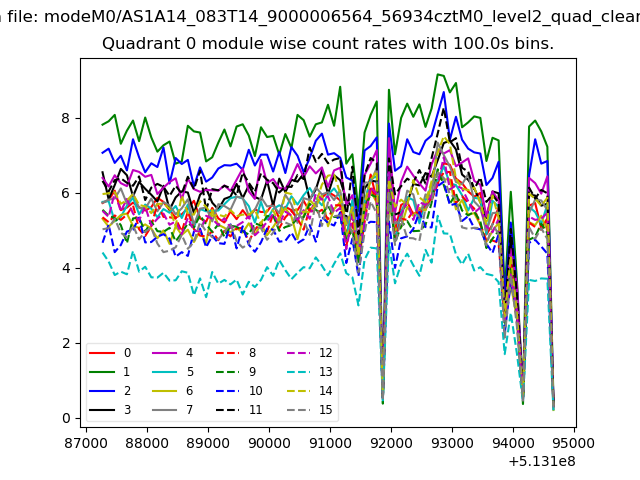
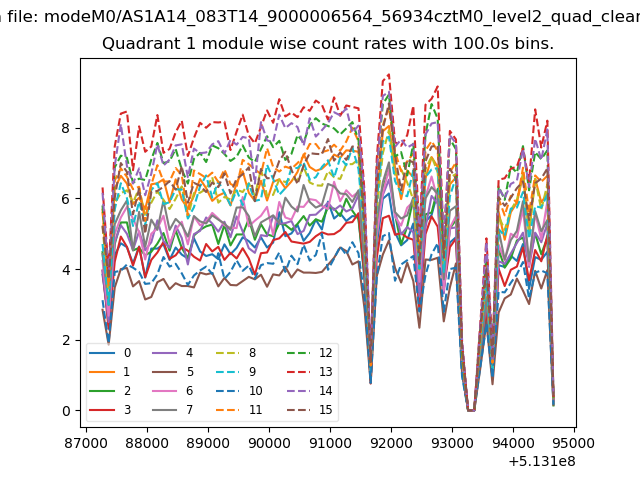
| Module-wise count rates for Quadrant A Data is divided into 100 sec bins |
 |
 |
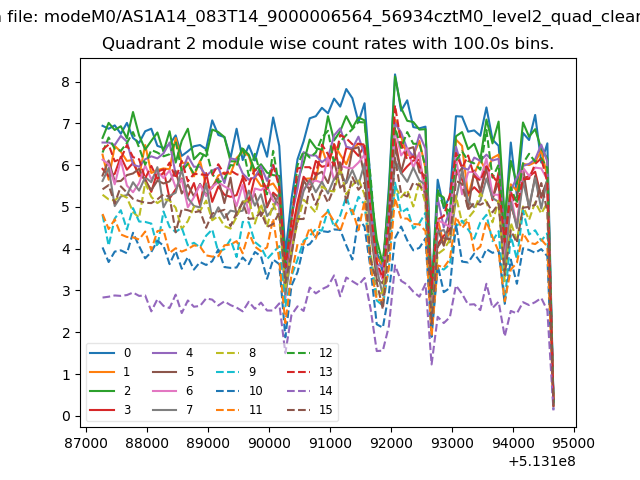
| Module-wise count rates for Quadrant B Data is divided into 100 sec bins |
 |
 |
| Module-wise count rates for Quadrant C Data is divided into 100 sec bins |
 |
 |
| Module-wise count rates for Quadrant D Data is divided into 100 sec bins |
 |
 |
| Parameter | Plot |
|---|---|
| CZT HV Monitor | 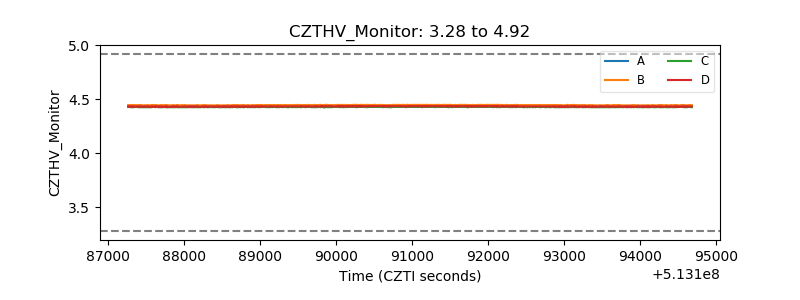 |
| D_VDD | 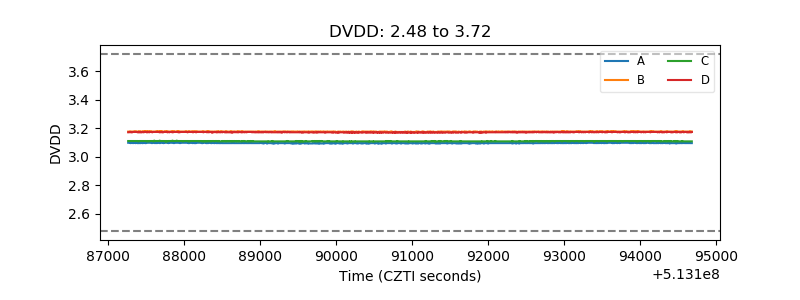 |
| Temperature 1 | 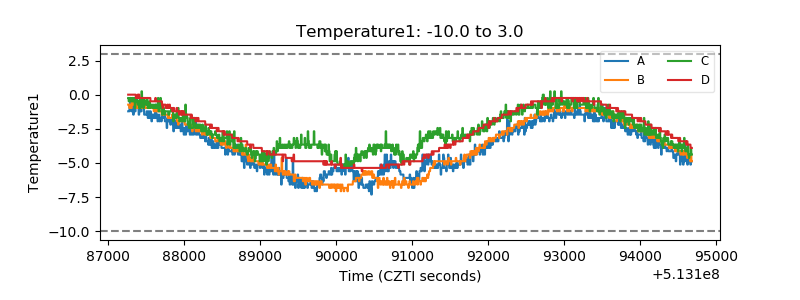 |
| Veto HV Monitor | 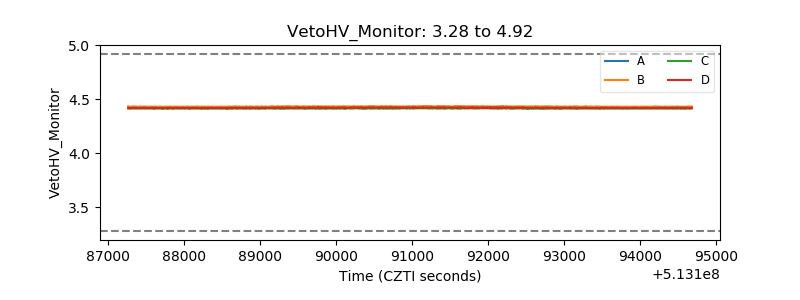 |
| Veto LLD | 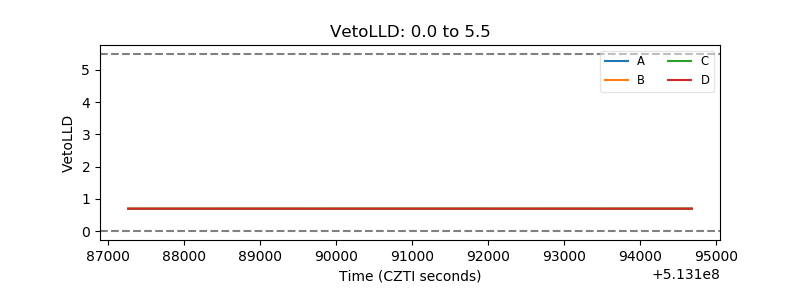 |
| Alpha Counter | 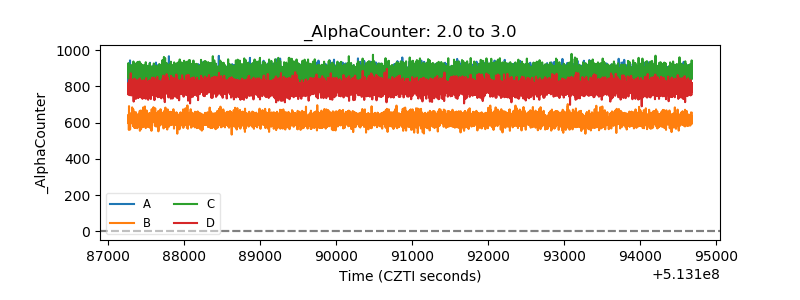 |
| _CPM_Rate | 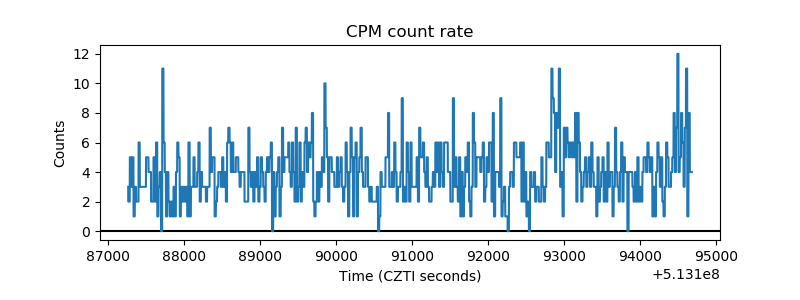 |
| CZT Counter | 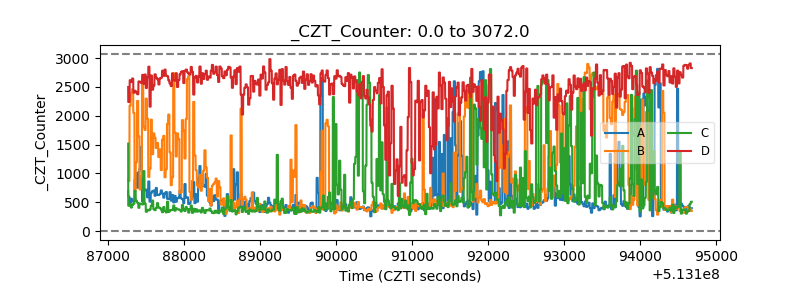 |
| +2.5 Volts monitor |  |
| +5 Volts monitor | 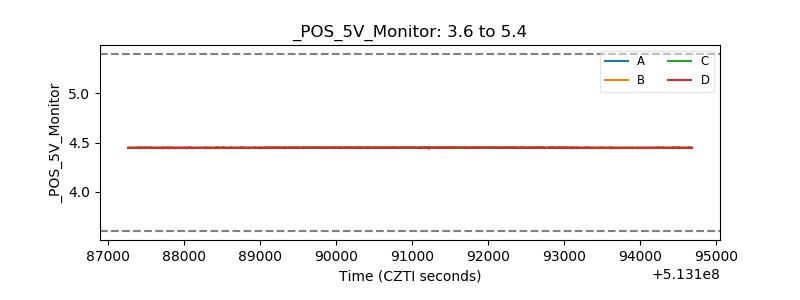 |
| _ROLL_ROT | 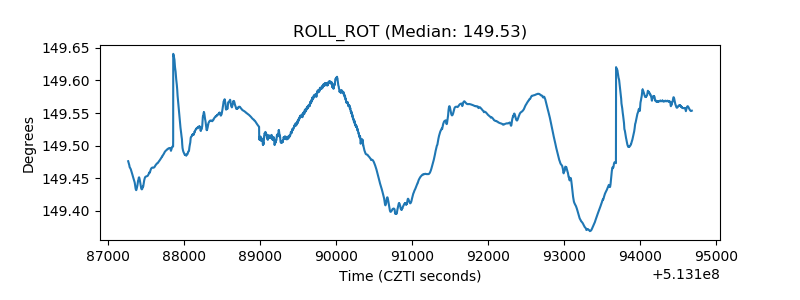 |
| _Roll_DEC | 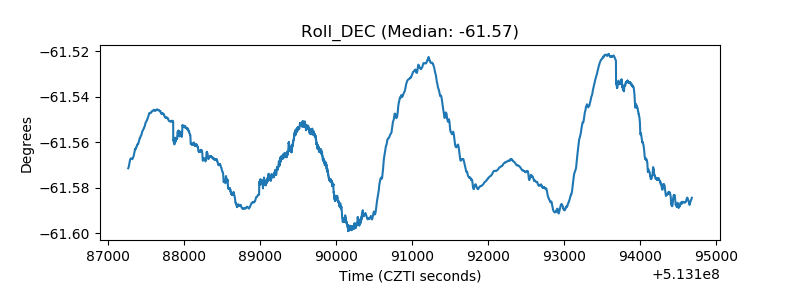 |
| _Roll_RA | 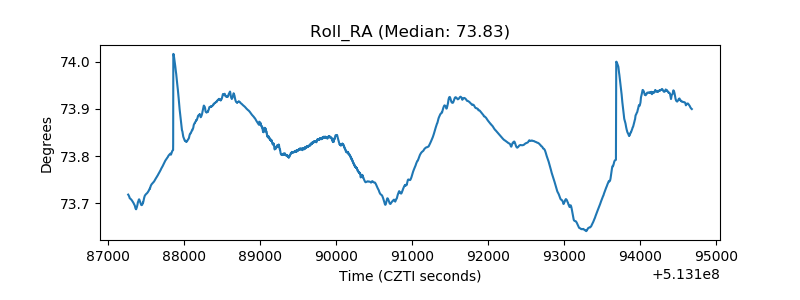 |
| Veto Counter | 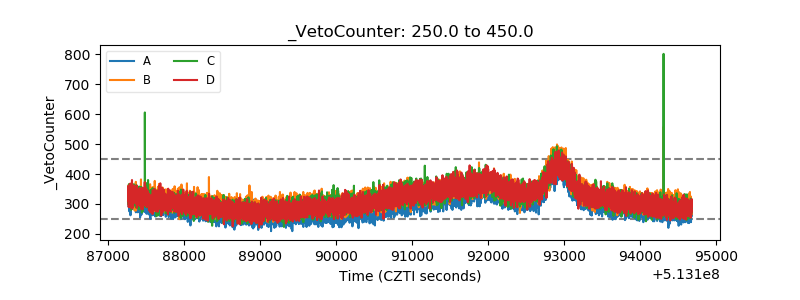 |