| Param | Original file | Final file |
|---|---|---|
| Filename | modeM0/AS1A14_083T14_9000006564_56937cztM0_level2.fits | modeM0/AS1A14_083T14_9000006564_56937cztM0_level2_quad_clean.evt |
| Size (bytes) | 2,295,236,160 | 200,750,400 |
| Size | 2.1 GB | 191.5 MB |
| Events in quadrant A | 9,965,839 | 1,620,860 |
| Events in quadrant B | 19,281,826 | 1,444,191 |
| Events in quadrant C | 10,173,965 | 1,552,710 |
| Events in quadrant D | 44,134,553 | 204,568 |
| Mode SS | |||
|---|---|---|---|
| Quadrant | BADHDUFLAG | Total packets | Discarded packets |
| A | 0 | 372 | 0 |
| B | 0 | 372 | 0 |
| C | 0 | 372 | 0 |
| D | 0 | 372 | 0 |
| Mode M9 | |||
|---|---|---|---|
| Quadrant | BADHDUFLAG | Total packets | Discarded packets |
| A | 0 | 14 | 0 |
| B | 0 | 14 | 0 |
| C | 0 | 14 | 0 |
| D | 0 | 14 | 0 |
| Mode M0 | |||
|---|---|---|---|
| Quadrant | BADHDUFLAG | Total packets | Discarded packets |
| A | 0 | 42572 | 3 |
| B | 0 | 70116 | 3 |
| C | 0 | 44090 | 3 |
| D | 0 | 143576 | 3 |
| Quadrant | Total seconds | Saturated seconds | Saturation percentage |
|---|---|---|---|
| A | 18197 | 459 | 2.522394% |
| B | 18198 | 3836 | 21.079239% |
| C | 18198 | 570 | 3.132212% |
| D | 18198 | 16246 | 89.273547% |
Noise dominated data is calculated using 1-second bins in cleaned event files. If a bin has >2000 counts, and if more than 50% of those come from <1% of pixels, then it is considered to be noise-dominated and hence unusable.
| Quadrant | # 1 sec bins | Bins with >0 counts | Bins with >2000 counts | High rate bins dominated by noise | Noise dominated (total time) | Noise dominated (detector-on time) | Marked lightcurve |
|---|---|---|---|---|---|---|---|
| A | 19667 | 18200 | 362 | 362 | 1.84% | 1.99% | 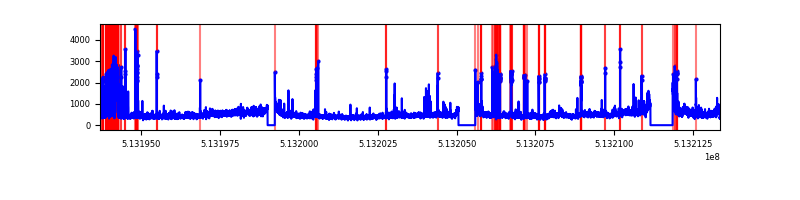 |
| B | 19668 | 18200 | 2956 | 2956 | 15.03% | 16.24% | 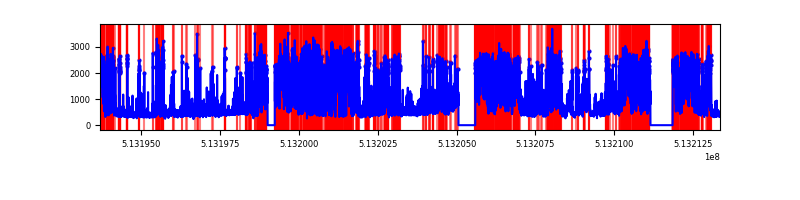 |
| C | 19668 | 18199 | 506 | 506 | 2.57% | 2.78% | 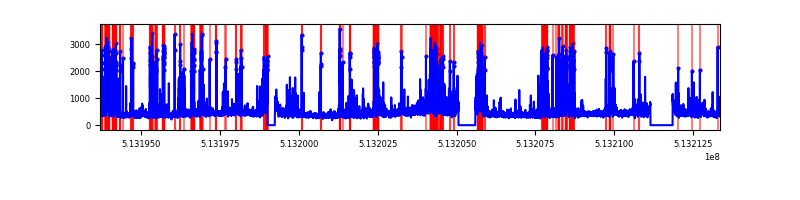 |
| D | 19667 | 18197 | 16217 | 16217 | 82.46% | 89.12% | 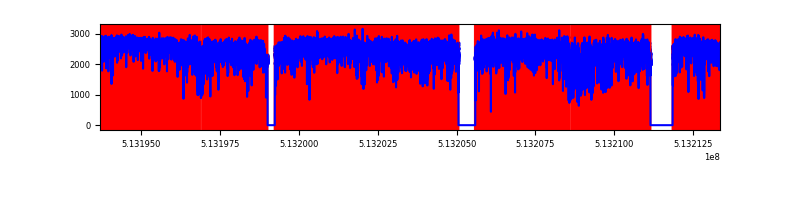 |
Top three noisy pixels from each quadrant. If the there are fewer than three noisy pixels in the level2.evt file, extra rows are filled as -1
| Pixel properties | Quadrant properties | ||||||
|---|---|---|---|---|---|---|---|
| Quadrant | DetID | PixID | Counts | Sigma | Mean | Median | Sigma |
| A | 7 | 64 | 1091012 | 2343.85 | 1878 | 1828 | 464.7 |
| A | 8 | 206 | 676096 | 1450.98 | 1878 | 1828 | 464.7 |
| A | 13 | 153 | 244299 | 521.78 | 1878 | 1828 | 464.7 |
| B | 5 | 185 | 7127901 | 19565.3 | 1701 | 1636 | 364.2 |
| B | 5 | 172 | 3383716 | 9285.57 | 1701 | 1636 | 364.2 |
| B | 10 | 16 | 1445918 | 3965.31 | 1701 | 1636 | 364.2 |
| C | 13 | 3 | 2369543 | 4823.45 | 1805 | 1788 | 490.9 |
| C | 14 | 254 | 204298 | 412.54 | 1805 | 1788 | 490.9 |
| C | 12 | 249 | 73098 | 145.27 | 1805 | 1788 | 490.9 |
| D | 12 | 33 | 36625823 | 119447.0 | 1070 | 1020 | 306.6 |
| D | 2 | 120 | 1048840 | 3417.33 | 1070 | 1020 | 306.6 |
| D | 11 | 129 | 487167 | 1585.5 | 1070 | 1020 | 306.6 |
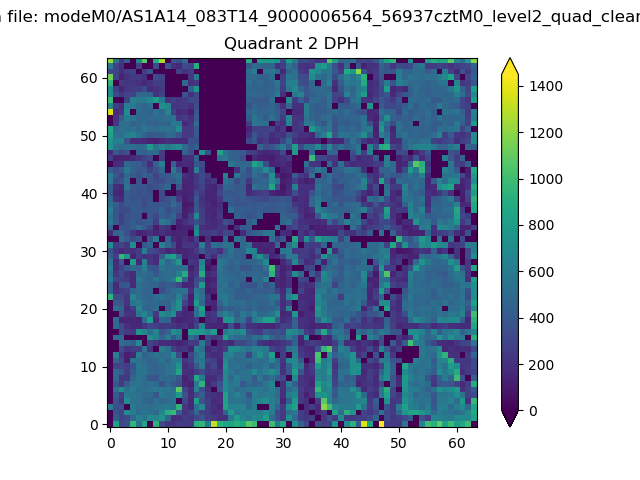
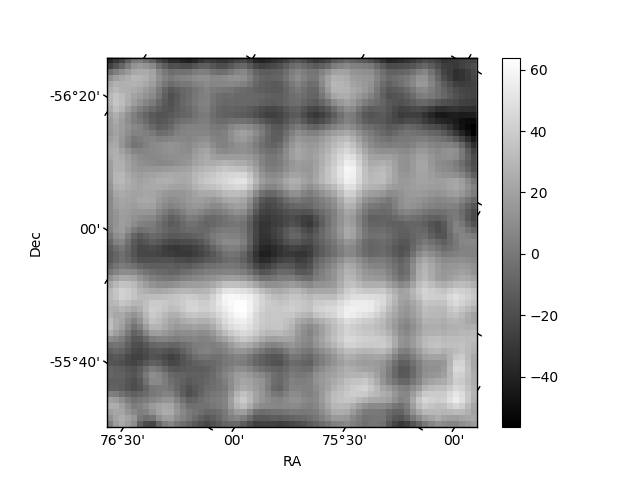
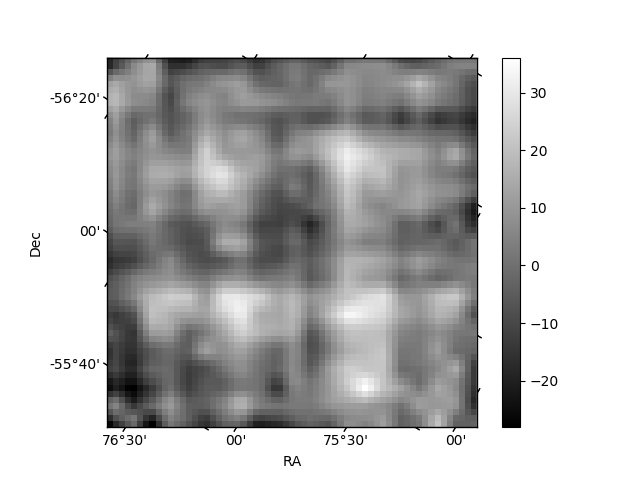
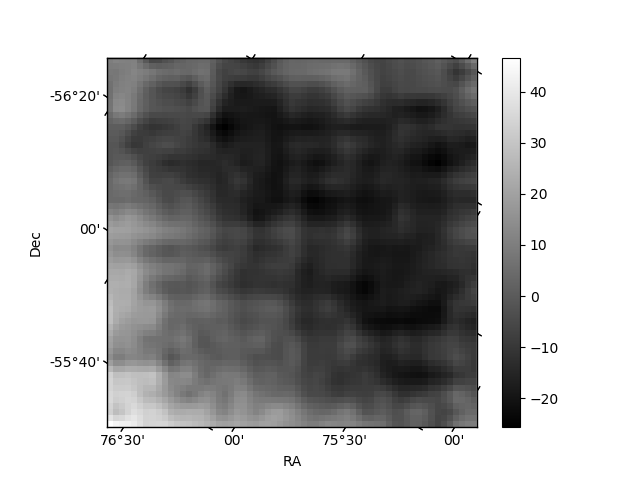
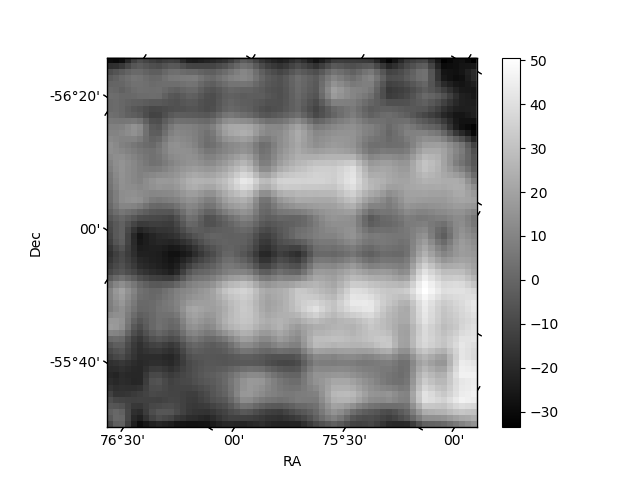
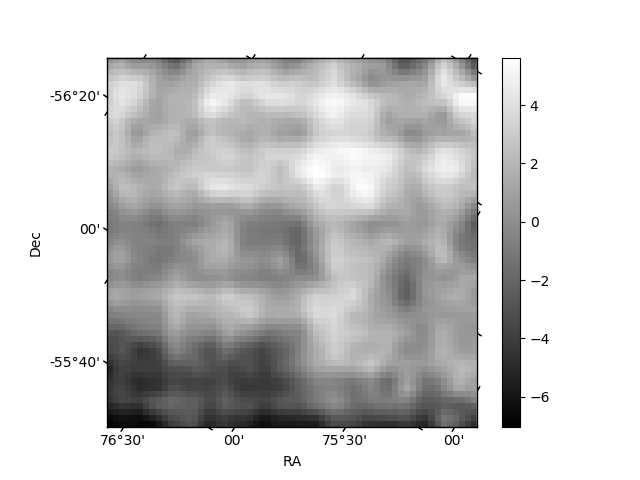
Histogram calculated using DETX and DETY for each event in the final _common_clean file
| Quadrant A | 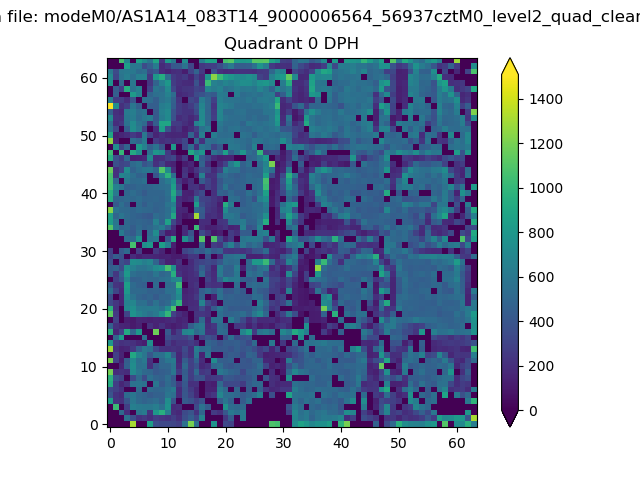 |
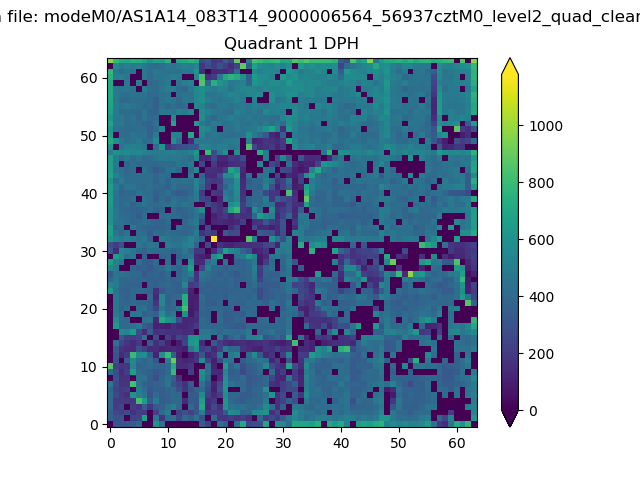 |
Quadrant B |
|---|---|---|---|
| Quadrant D | 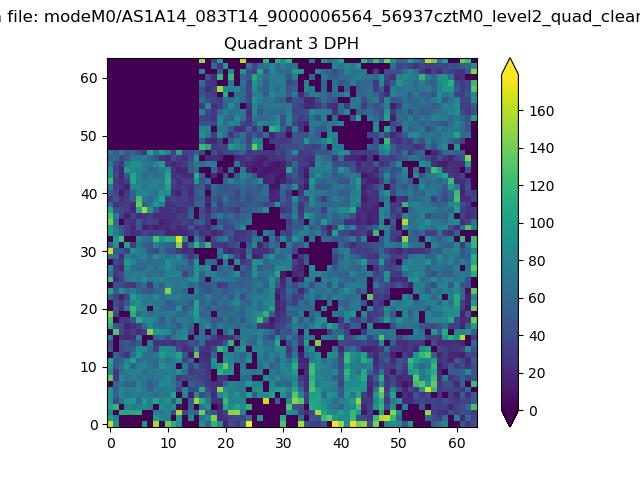 |
 |
Quadrant C |
| Plot type | Count rate plots | Images |
|---|---|---|
| Comparison with Poisson distribution Blue bars denote a histogram of data divided into 1 sec bins. Red curve is a Poisson curve with rate = median count rate of data. |
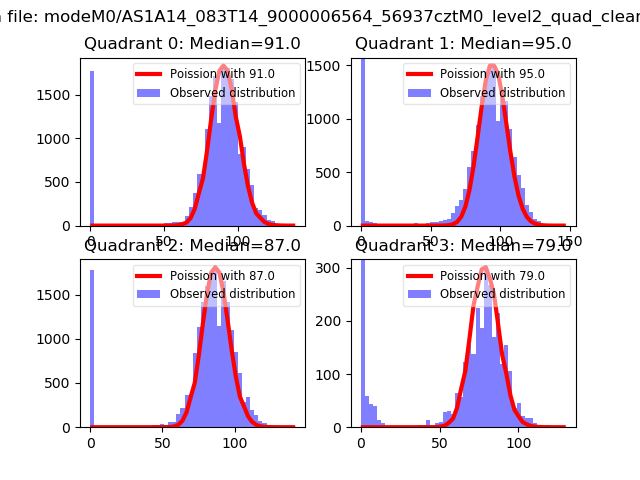 |
 |
| Quadrant-wise count rates Data is divided into 100 sec bins |
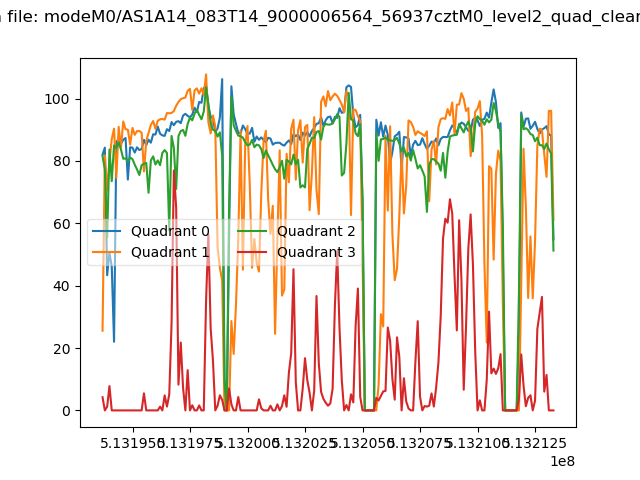 |
|
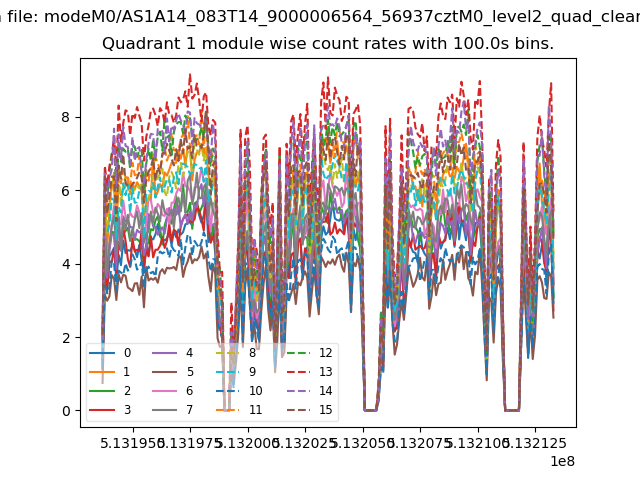
| Module-wise count rates for Quadrant A Data is divided into 100 sec bins |
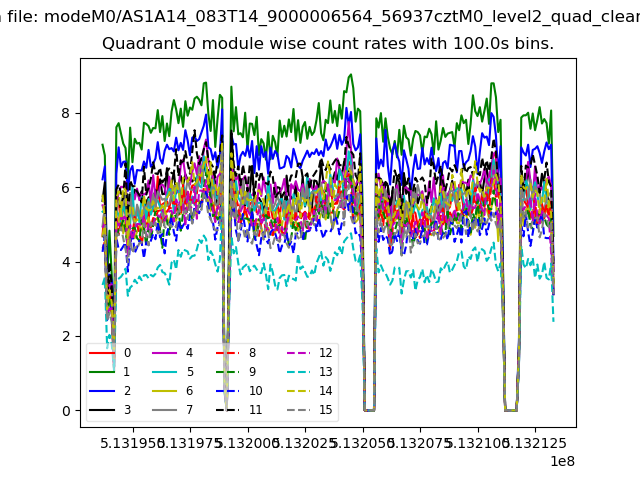 |
 |
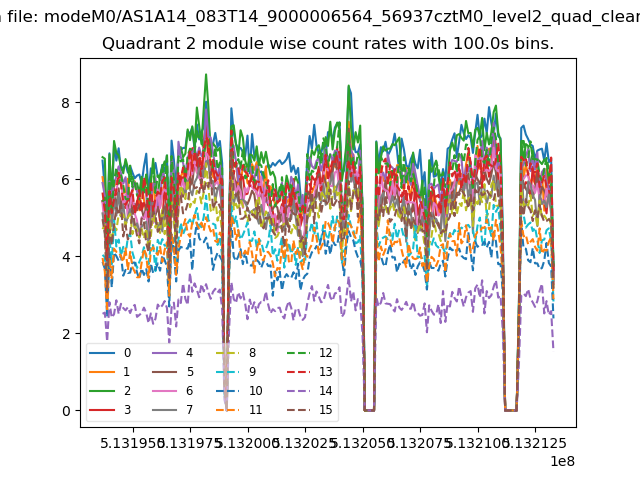
| Module-wise count rates for Quadrant B Data is divided into 100 sec bins |
 |
 |
| Module-wise count rates for Quadrant C Data is divided into 100 sec bins |
 |
 |
| Module-wise count rates for Quadrant D Data is divided into 100 sec bins |
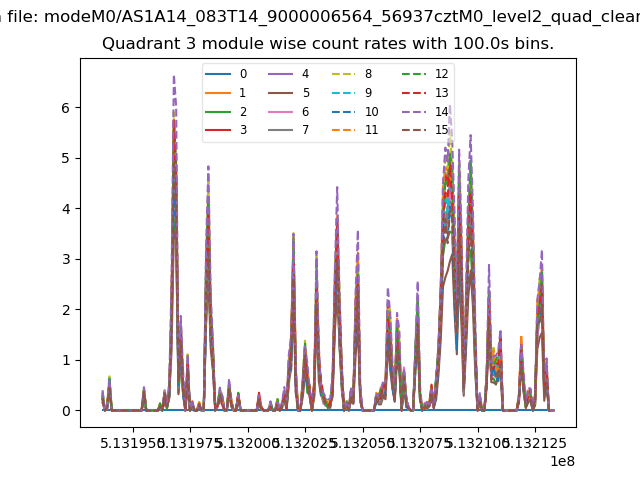 |
 |
| Parameter | Plot |
|---|---|
| CZT HV Monitor |  |
| D_VDD | 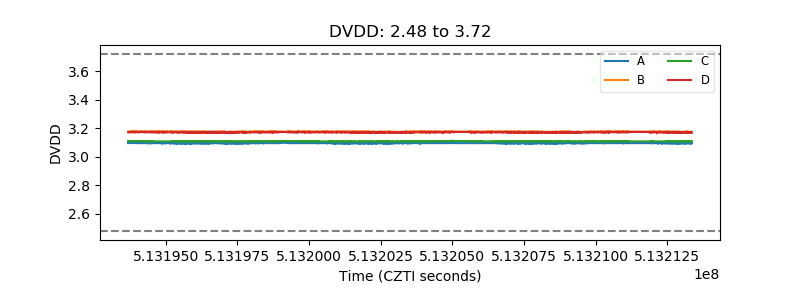 |
| Temperature 1 | 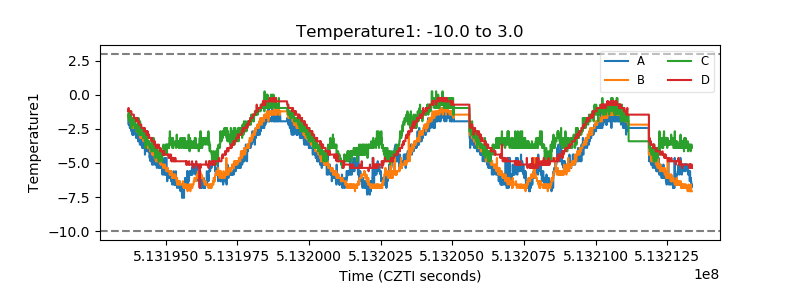 |
| Veto HV Monitor | 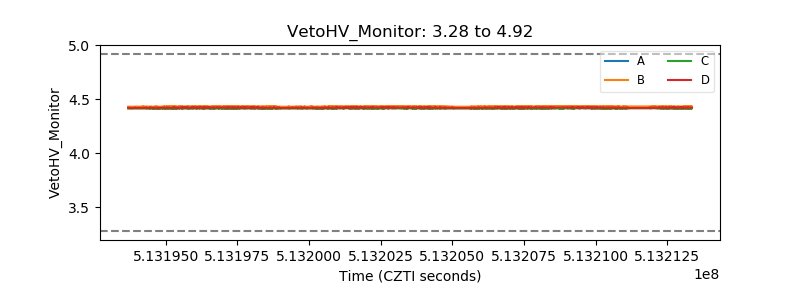 |
| Veto LLD | 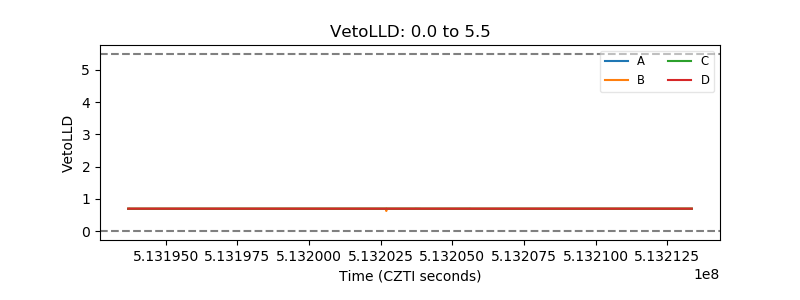 |
| Alpha Counter | 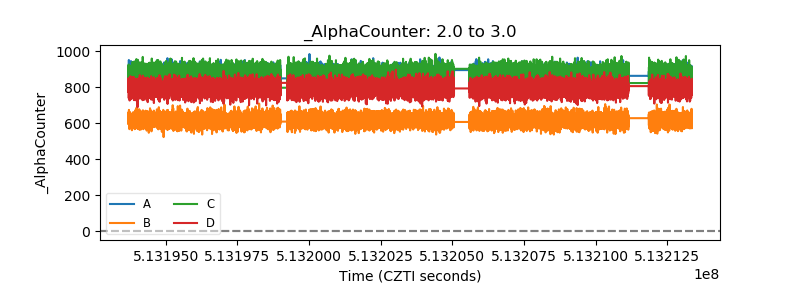 |
| _CPM_Rate | 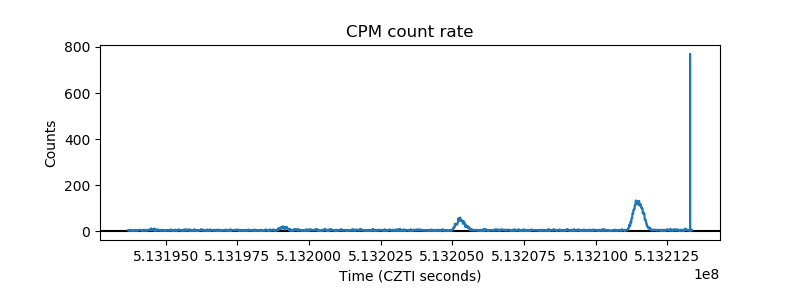 |
| CZT Counter | 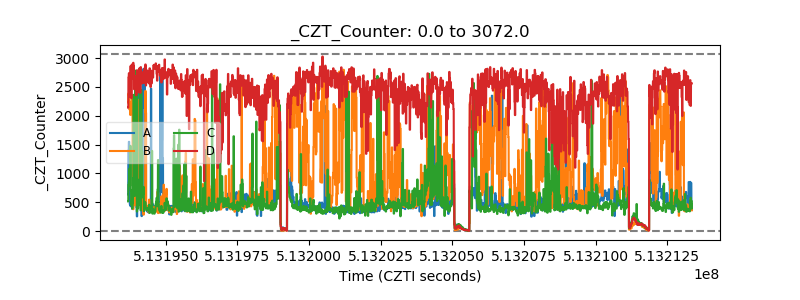 |
| +2.5 Volts monitor |  |
| +5 Volts monitor | 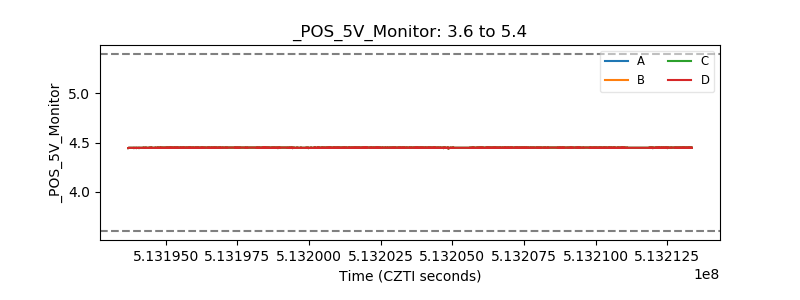 |
| _ROLL_ROT | 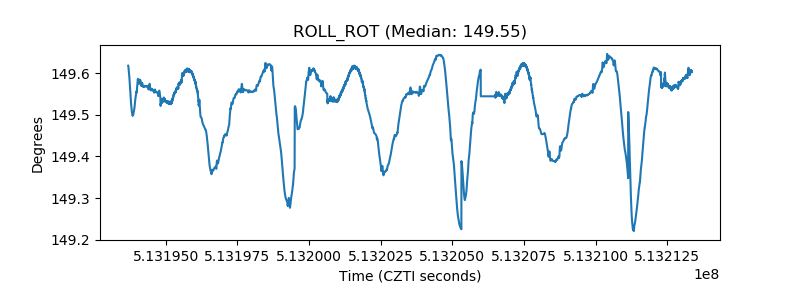 |
| _Roll_DEC | 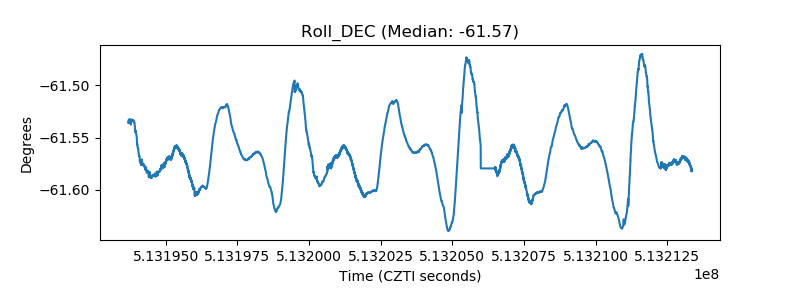 |
| _Roll_RA | 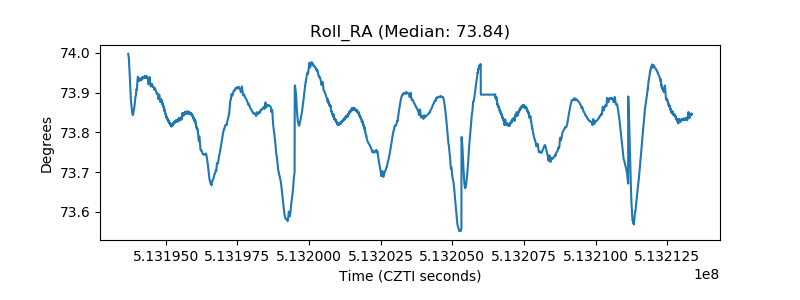 |
| Veto Counter | 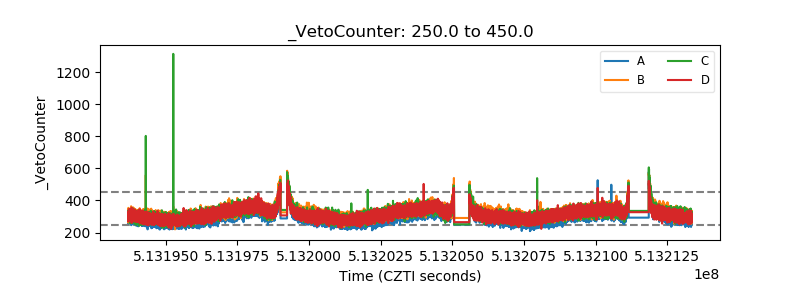 |