| Param | Original file | Final file |
|---|---|---|
| Filename | modeM0/AS1A14_083T14_9000006564_56938cztM0_level2.fits | modeM0/AS1A14_083T14_9000006564_56938cztM0_level2_quad_clean.evt |
| Size (bytes) | 878,872,320 | 74,407,680 |
| Size | 838.2 MB | 71.0 MB |
| Events in quadrant A | 5,011,263 | 611,916 |
| Events in quadrant B | 7,795,668 | 534,364 |
| Events in quadrant C | 3,179,275 | 606,046 |
| Events in quadrant D | 16,013,032 | 21,531 |
| Mode SS | |||
|---|---|---|---|
| Quadrant | BADHDUFLAG | Total packets | Discarded packets |
| A | 0 | 140 | 0 |
| B | 0 | 140 | 0 |
| C | 0 | 140 | 0 |
| D | 0 | 140 | 0 |
| Mode M9 | |||
|---|---|---|---|
| Quadrant | BADHDUFLAG | Total packets | Discarded packets |
| A | 0 | 11 | 0 |
| B | 0 | 11 | 0 |
| C | 0 | 12 | 0 |
| D | 0 | 12 | 0 |
| Mode M0 | |||
|---|---|---|---|
| Quadrant | BADHDUFLAG | Total packets | Discarded packets |
| A | 0 | 19742 | 5 |
| B | 0 | 28058 | 2 |
| C | 0 | 14718 | 2 |
| D | 0 | 52253 | 2 |
| Quadrant | Total seconds | Saturated seconds | Saturation percentage |
|---|---|---|---|
| A | 6870 | 357 | 5.196507% |
| B | 6870 | 1776 | 25.851528% |
| C | 6870 | 39 | 0.567686% |
| D | 6870 | 6678 | 97.205240% |
Noise dominated data is calculated using 1-second bins in cleaned event files. If a bin has >2000 counts, and if more than 50% of those come from <1% of pixels, then it is considered to be noise-dominated and hence unusable.
| Quadrant | # 1 sec bins | Bins with >0 counts | Bins with >2000 counts | High rate bins dominated by noise | Noise dominated (total time) | Noise dominated (detector-on time) | Marked lightcurve |
|---|---|---|---|---|---|---|---|
| A | 7740 | 6870 | 272 | 272 | 3.51% | 3.96% | 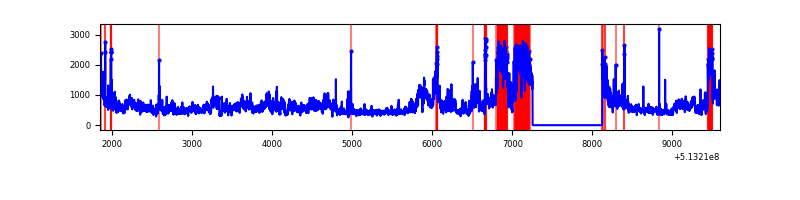 |
| B | 7740 | 6870 | 1342 | 1342 | 17.34% | 19.53% | 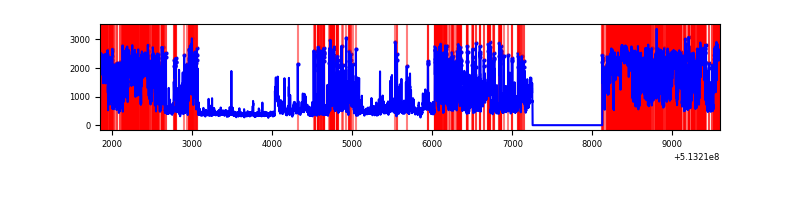 |
| C | 7740 | 6871 | 30 | 30 | 0.39% | 0.44% | 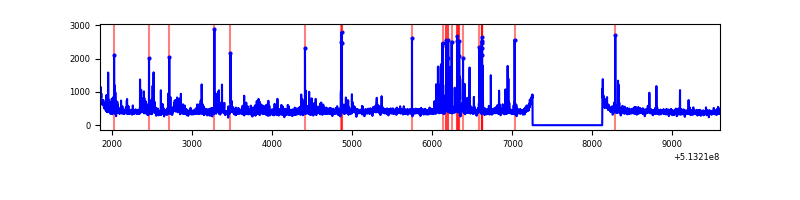 |
| D | 7739 | 6869 | 6018 | 6018 | 77.76% | 87.61% | 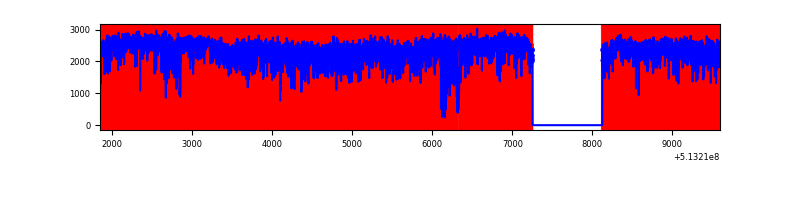 |
Top three noisy pixels from each quadrant. If the there are fewer than three noisy pixels in the level2.evt file, extra rows are filled as -1
| Pixel properties | Quadrant properties | ||||||
|---|---|---|---|---|---|---|---|
| Quadrant | DetID | PixID | Counts | Sigma | Mean | Median | Sigma |
| A | 7 | 64 | 2024559 | 11638.35 | 705 | 686 | 173.9 |
| A | 10 | 251 | 89507 | 510.77 | 705 | 686 | 173.9 |
| A | 8 | 249 | 34935 | 196.95 | 705 | 686 | 173.9 |
| B | 5 | 185 | 2262126 | 17067.85 | 615 | 593 | 132.5 |
| B | 10 | 16 | 2056829 | 15518.46 | 615 | 593 | 132.5 |
| B | 5 | 172 | 796629 | 6007.7 | 615 | 593 | 132.5 |
| C | 13 | 3 | 221590 | 1162.73 | 698 | 691 | 190.0 |
| C | 14 | 254 | 87044 | 454.53 | 698 | 691 | 190.0 |
| C | 12 | 112 | 59893 | 311.62 | 698 | 691 | 190.0 |
| D | 12 | 33 | 13989314 | 151628.85 | 312 | 296 | 92.3 |
| D | 8 | 240 | 519537 | 5628.12 | 312 | 296 | 92.3 |
| D | 3 | 12 | 101448 | 1096.4 | 312 | 296 | 92.3 |
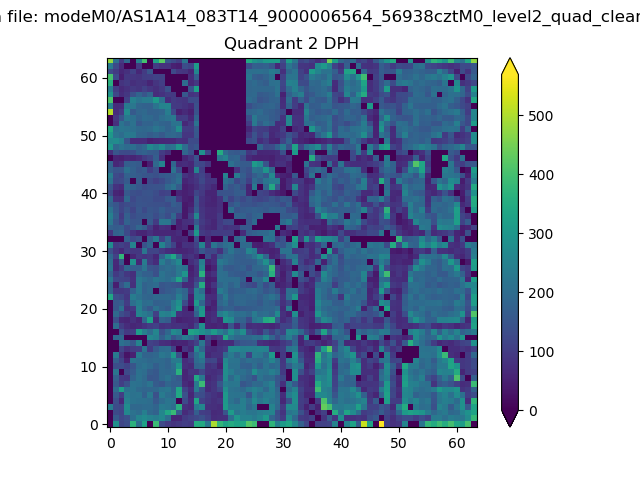
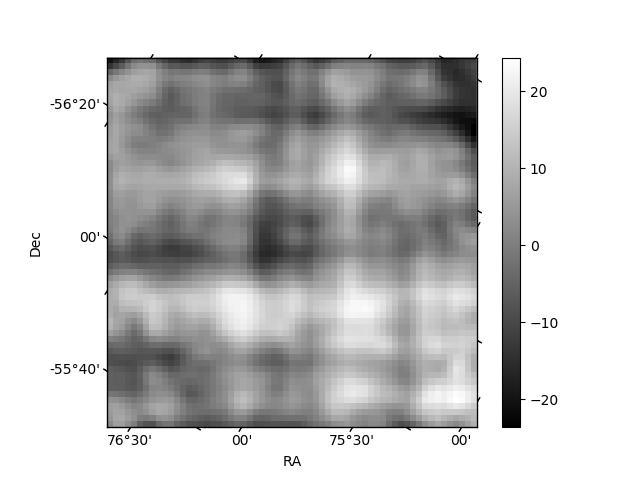
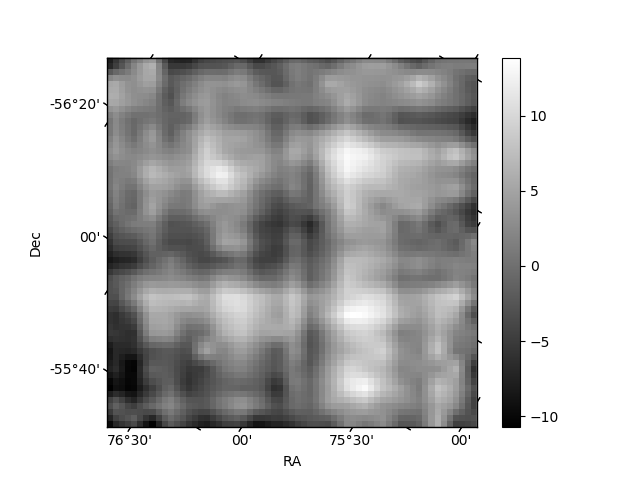
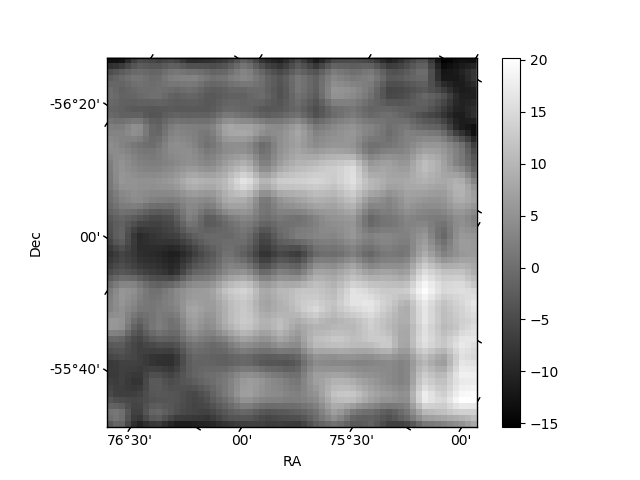
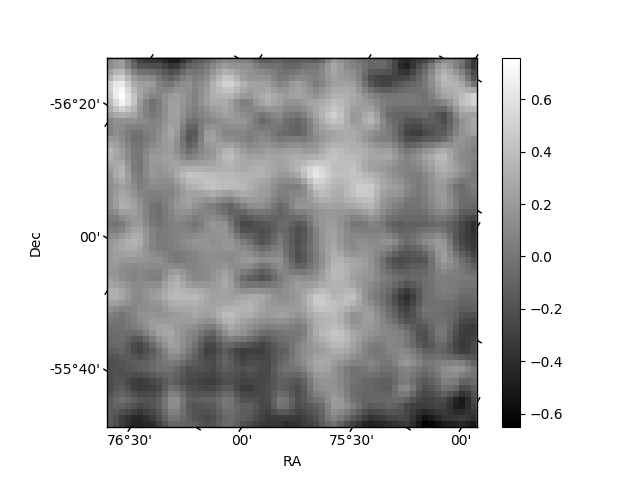
Histogram calculated using DETX and DETY for each event in the final _common_clean file
| Quadrant A | 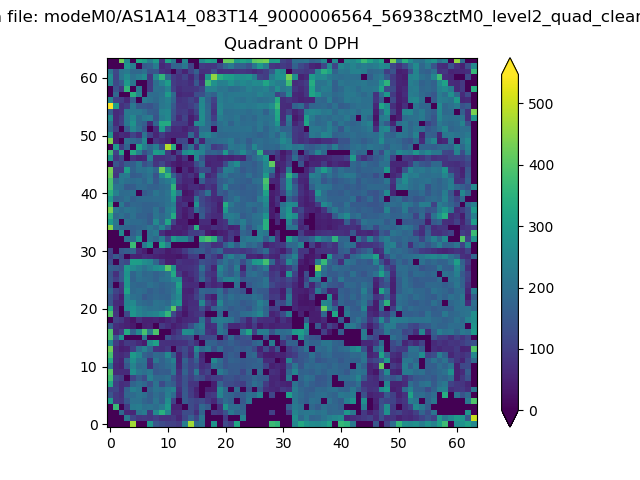 |
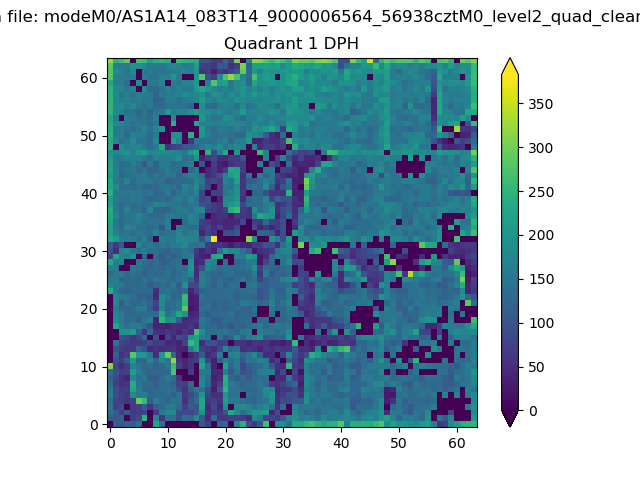 |
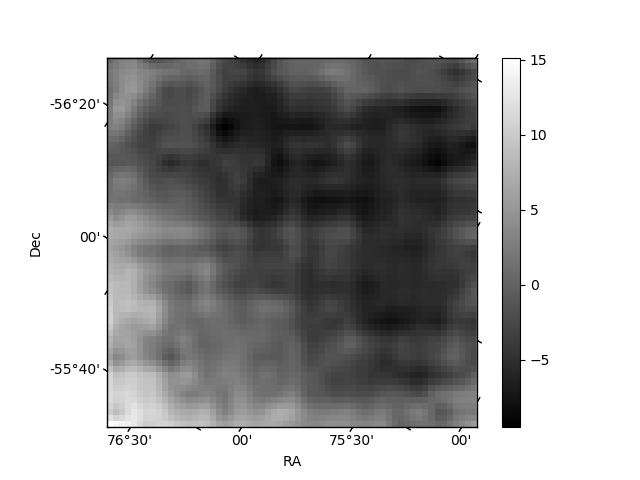
Quadrant B |
|---|---|---|---|
| Quadrant D | 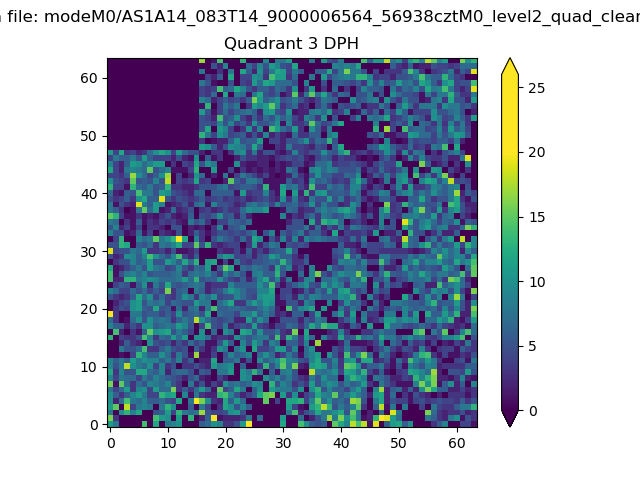 |
 |
Quadrant C |
| Plot type | Count rate plots | Images |
|---|---|---|
| Comparison with Poisson distribution Blue bars denote a histogram of data divided into 1 sec bins. Red curve is a Poisson curve with rate = median count rate of data. |
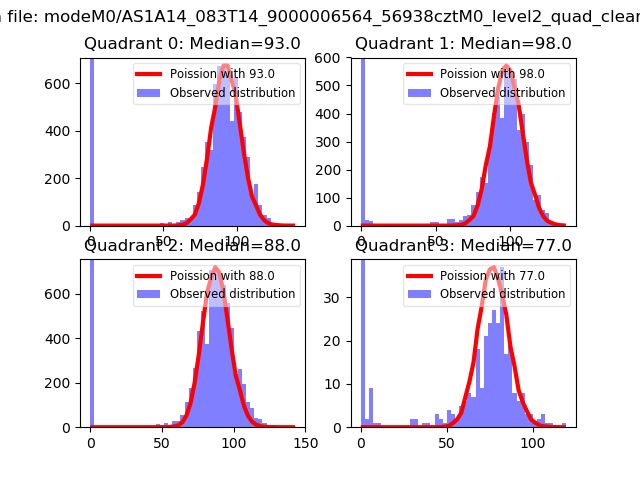 |
 |
| Quadrant-wise count rates Data is divided into 100 sec bins |
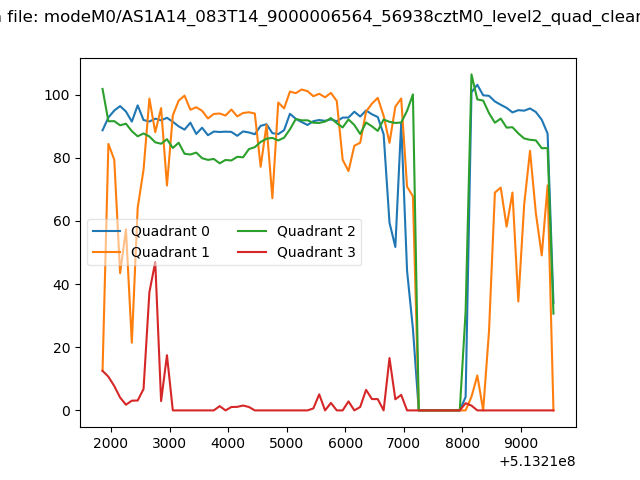 |
|
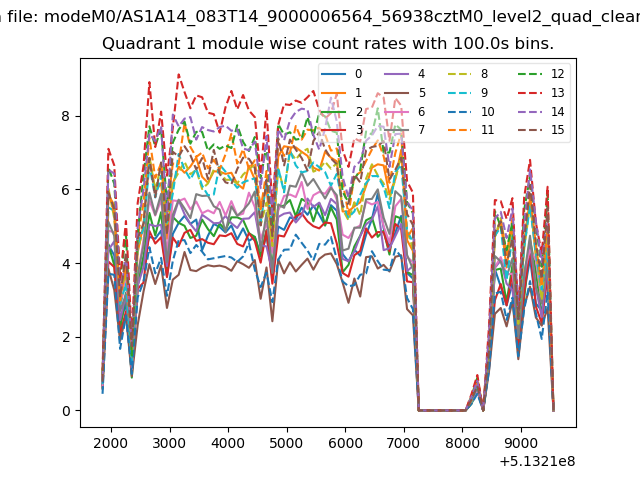
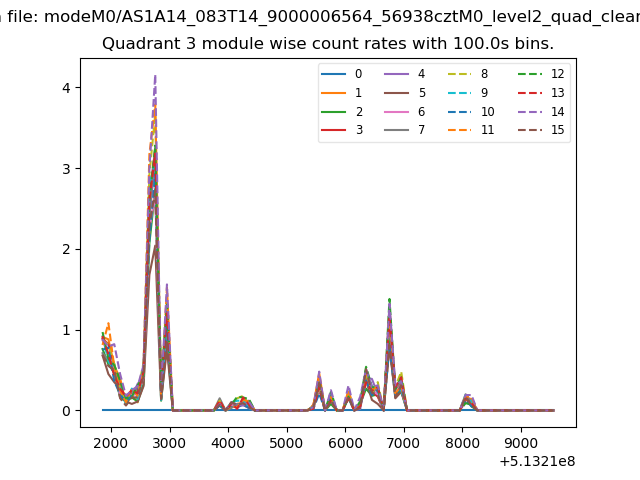
| Module-wise count rates for Quadrant A Data is divided into 100 sec bins |
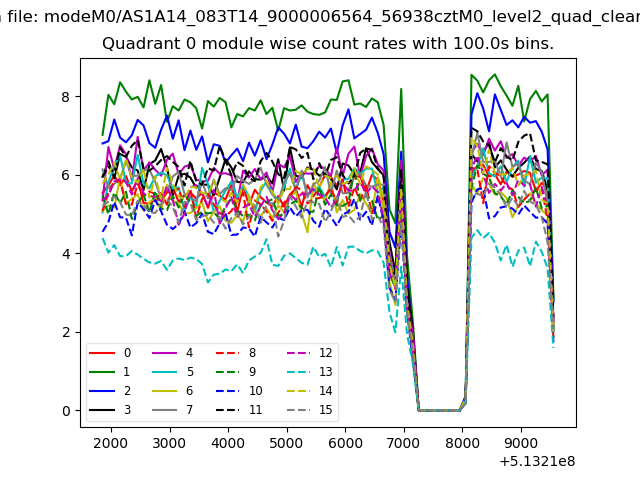 |
 |
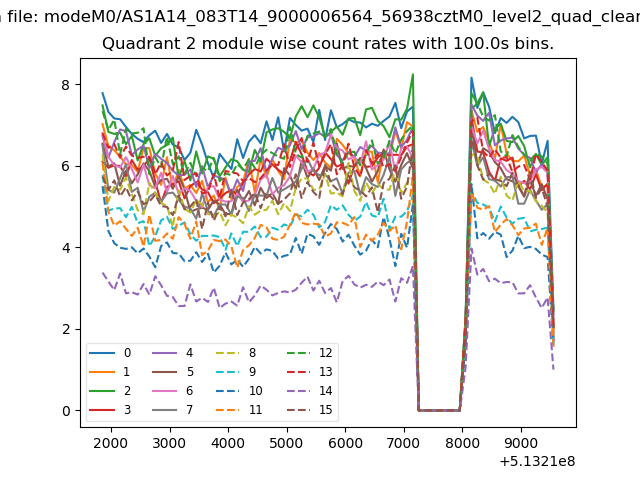
| Module-wise count rates for Quadrant B Data is divided into 100 sec bins |
 |
 |
| Module-wise count rates for Quadrant C Data is divided into 100 sec bins |
 |
 |
| Module-wise count rates for Quadrant D Data is divided into 100 sec bins |
 |
 |
| Parameter | Plot |
|---|---|
| CZT HV Monitor | 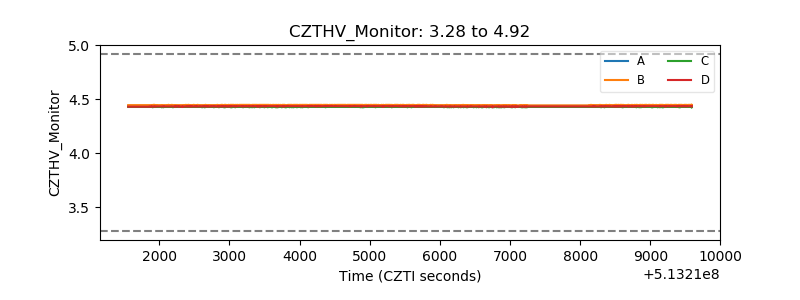 |
| D_VDD | 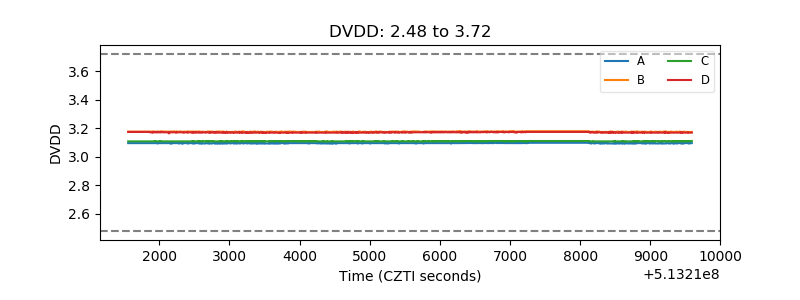 |
| Temperature 1 | 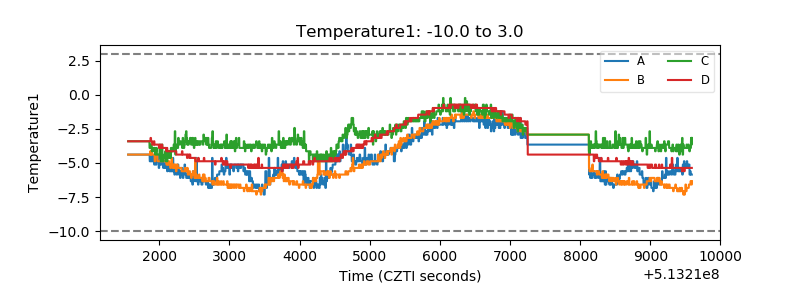 |
| Veto HV Monitor | 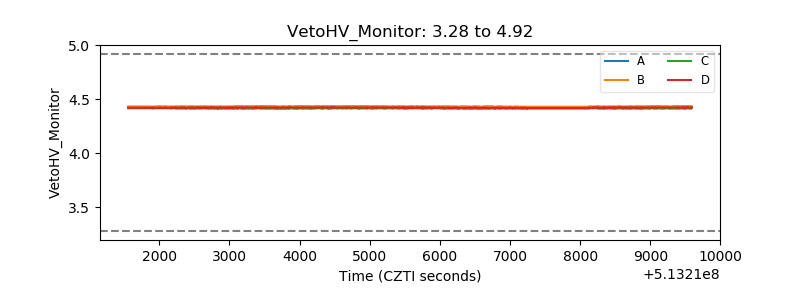 |
| Veto LLD | 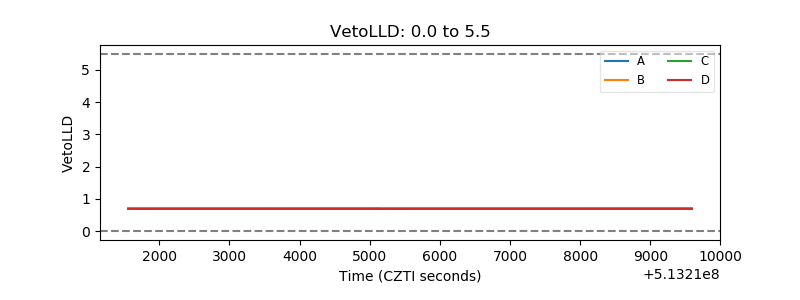 |
| Alpha Counter | 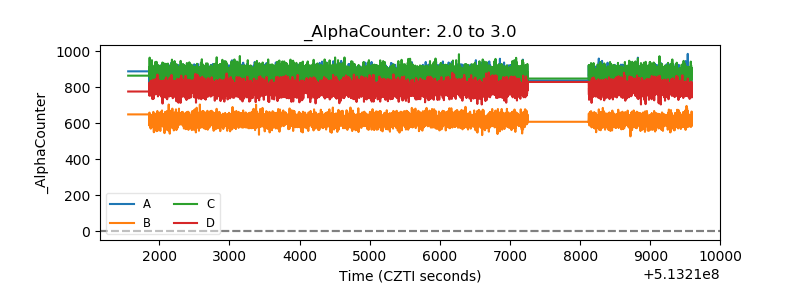 |
| _CPM_Rate | 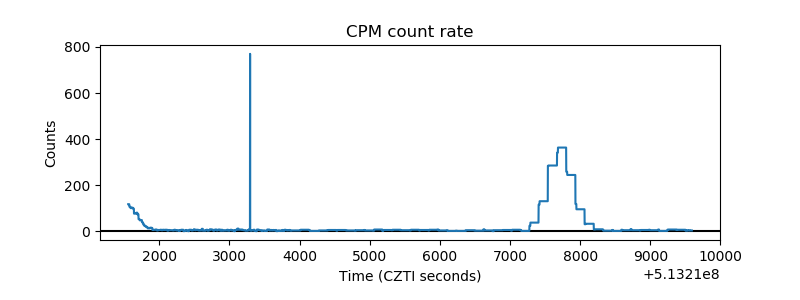 |
| CZT Counter | 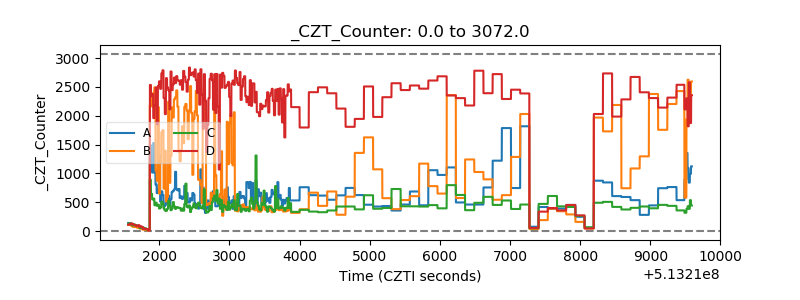 |
| +2.5 Volts monitor |  |
| +5 Volts monitor | 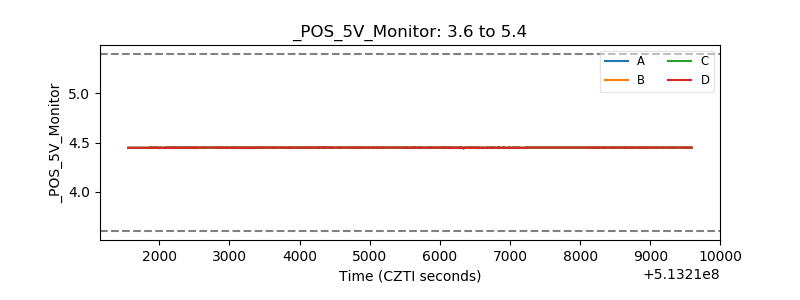 |
| _ROLL_ROT | 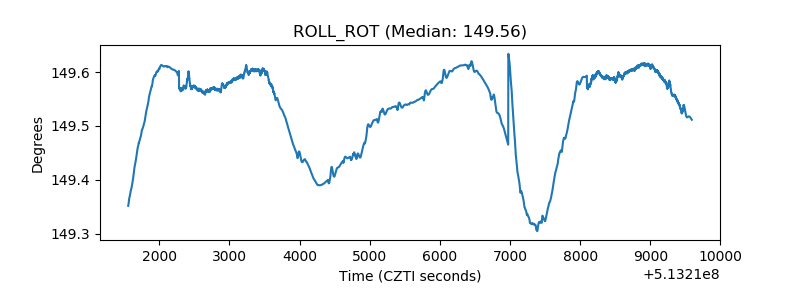 |
| _Roll_DEC | 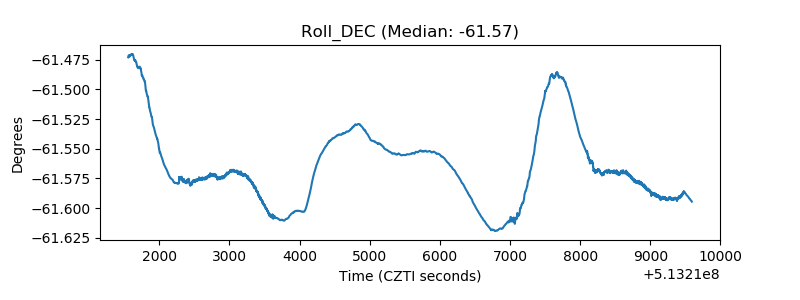 |
| _Roll_RA | 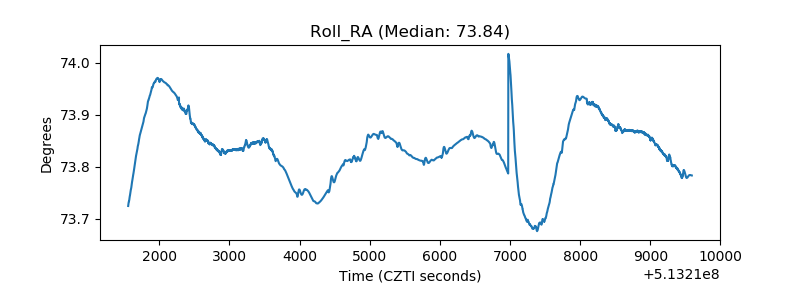 |
| Veto Counter | 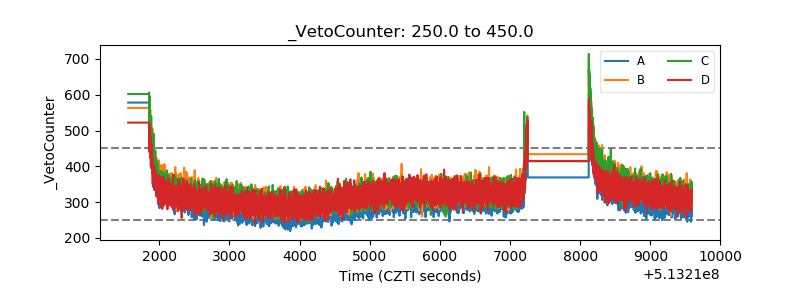 |