| Param | Original file | Final file |
|---|---|---|
| Filename | modeM0/AS1A14_083T14_9000006564_56941cztM0_level2.fits | modeM0/AS1A14_083T14_9000006564_56941cztM0_level2_quad_clean.evt |
| Size (bytes) | 789,217,920 | 65,623,680 |
| Size | 752.7 MB | 62.6 MB |
| Events in quadrant A | 6,693,646 | 500,302 |
| Events in quadrant B | 6,305,930 | 494,878 |
| Events in quadrant C | 2,954,638 | 538,016 |
| Events in quadrant D | 12,812,735 | 50,510 |
| Mode SS | |||
|---|---|---|---|
| Quadrant | BADHDUFLAG | Total packets | Discarded packets |
| A | 0 | 118 | 0 |
| B | 0 | 118 | 0 |
| C | 0 | 118 | 0 |
| D | 0 | 118 | 0 |
| Mode M9 | |||
|---|---|---|---|
| Quadrant | BADHDUFLAG | Total packets | Discarded packets |
| A | 0 | 11 | 0 |
| B | 0 | 11 | 0 |
| C | 0 | 11 | 0 |
| D | 0 | 11 | 0 |
| Mode M0 | |||
|---|---|---|---|
| Quadrant | BADHDUFLAG | Total packets | Discarded packets |
| A | 0 | 23972 | 1 |
| B | 0 | 22715 | 1 |
| C | 0 | 13133 | 1 |
| D | 0 | 41965 | 5 |
| Quadrant | Total seconds | Saturated seconds | Saturation percentage |
|---|---|---|---|
| A | 5764 | 875 | 15.180430% |
| B | 5764 | 1273 | 22.085357% |
| C | 5765 | 121 | 2.098873% |
| D | 5764 | 5323 | 92.349063% |
Noise dominated data is calculated using 1-second bins in cleaned event files. If a bin has >2000 counts, and if more than 50% of those come from <1% of pixels, then it is considered to be noise-dominated and hence unusable.
| Quadrant | # 1 sec bins | Bins with >0 counts | Bins with >2000 counts | High rate bins dominated by noise | Noise dominated (total time) | Noise dominated (detector-on time) | Marked lightcurve |
|---|---|---|---|---|---|---|---|
| A | 6884 | 5764 | 826 | 826 | 12.00% | 14.33% | 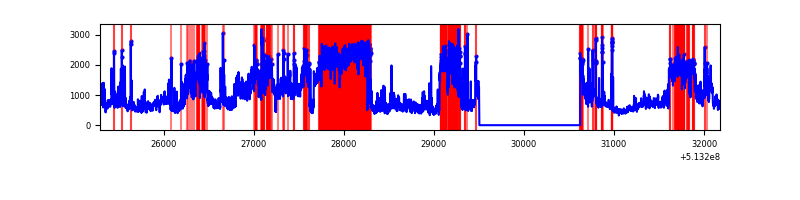 |
| B | 6884 | 5764 | 970 | 970 | 14.09% | 16.83% | 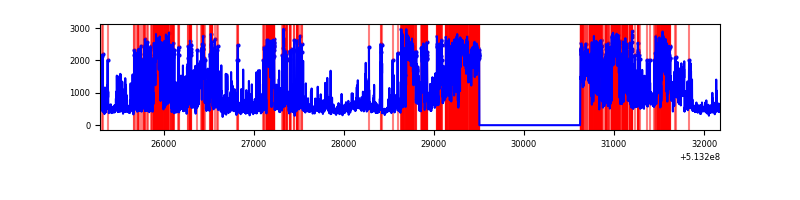 |
| C | 6885 | 5765 | 70 | 70 | 1.02% | 1.21% | 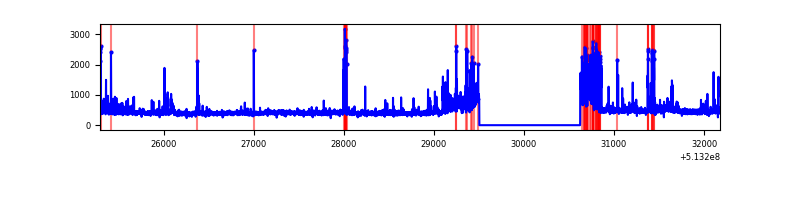 |
| D | 6883 | 5763 | 4354 | 4354 | 63.26% | 75.55% | 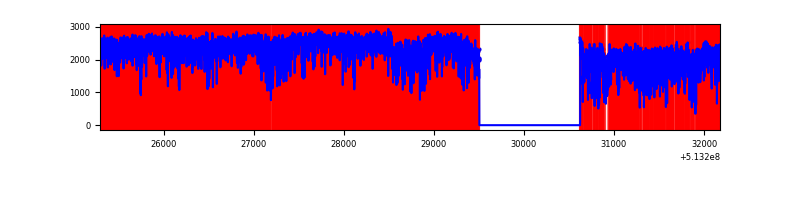 |
Top three noisy pixels from each quadrant. If the there are fewer than three noisy pixels in the level2.evt file, extra rows are filled as -1
| Pixel properties | Quadrant properties | ||||||
|---|---|---|---|---|---|---|---|
| Quadrant | DetID | PixID | Counts | Sigma | Mean | Median | Sigma |
| A | 7 | 64 | 4098029 | 27674.02 | 592 | 577 | 148.1 |
| A | 10 | 251 | 158813 | 1068.72 | 592 | 577 | 148.1 |
| A | 0 | 12 | 103154 | 692.8 | 592 | 577 | 148.1 |
| B | 5 | 172 | 2392374 | 21022.32 | 535 | 514 | 113.8 |
| B | 10 | 16 | 876507 | 7699.2 | 535 | 514 | 113.8 |
| B | 5 | 185 | 595021 | 5225.19 | 535 | 514 | 113.8 |
| C | 13 | 3 | 289758 | 1762.84 | 602 | 598 | 164.0 |
| C | 12 | 249 | 174273 | 1058.8 | 602 | 598 | 164.0 |
| C | 6 | 223 | 49535 | 298.34 | 602 | 598 | 164.0 |
| D | 12 | 33 | 10663363 | 112059.17 | 329 | 313 | 95.2 |
| D | 12 | 1 | 217697 | 2284.51 | 329 | 313 | 95.2 |
| D | 3 | 12 | 149699 | 1569.91 | 329 | 313 | 95.2 |
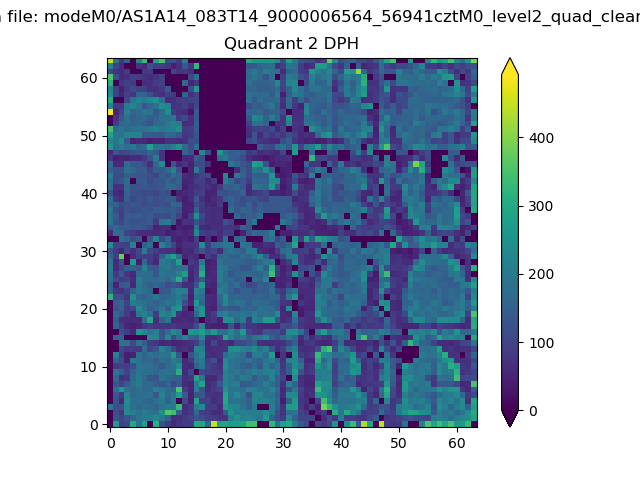
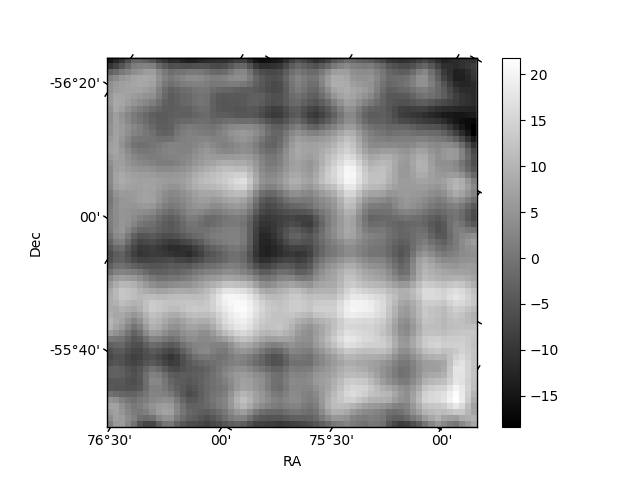
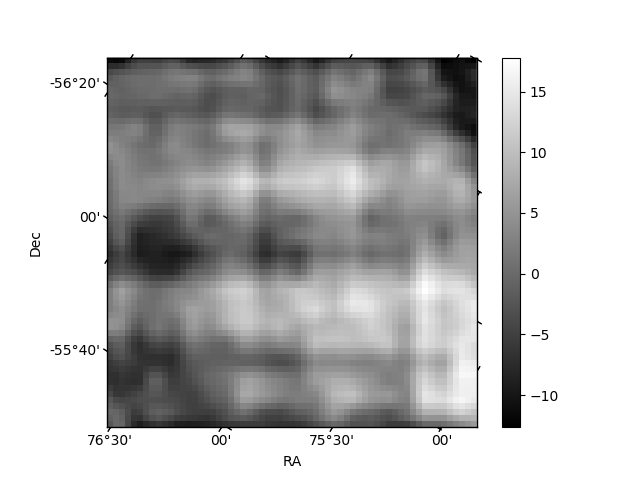
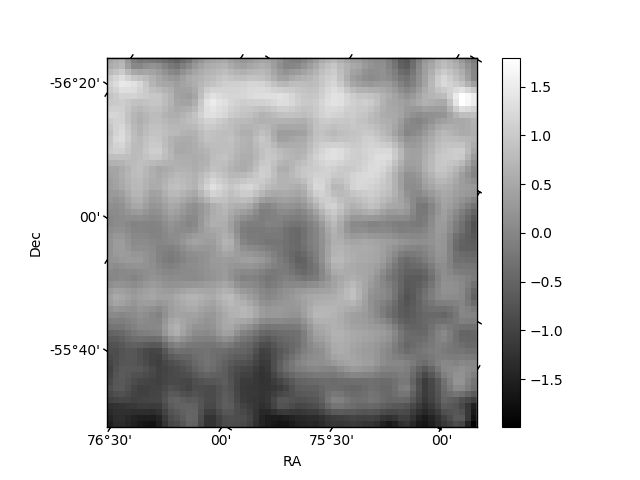
Histogram calculated using DETX and DETY for each event in the final _common_clean file
| Quadrant A | 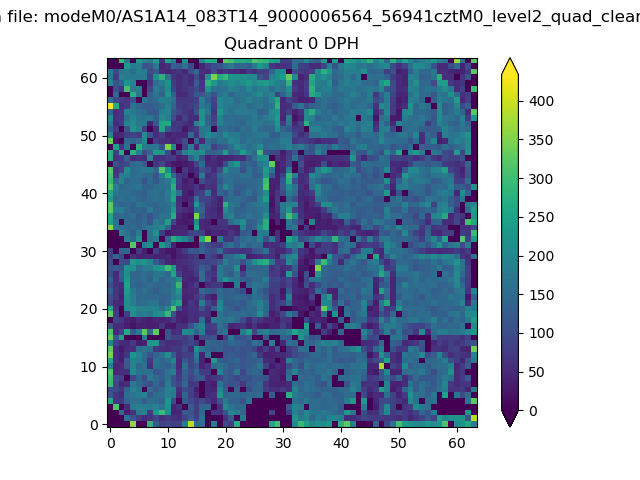 |
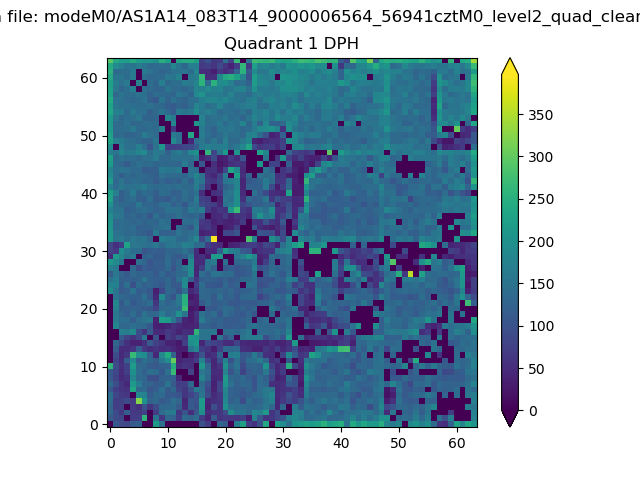 |
Quadrant B |
|---|---|---|---|
| Quadrant D | 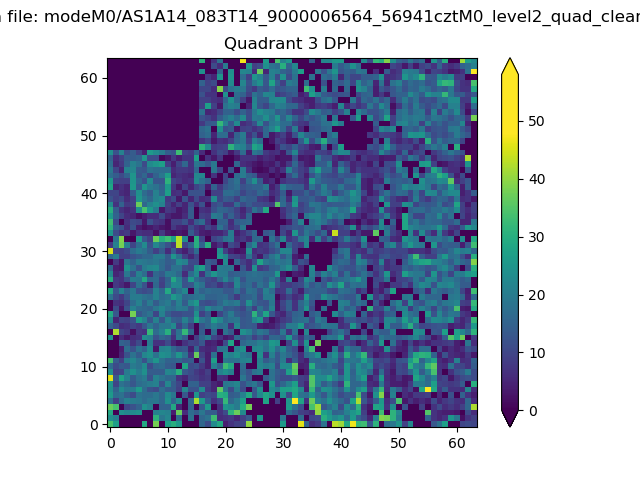 |
 |
Quadrant C |
| Plot type | Count rate plots | Images |
|---|---|---|
| Comparison with Poisson distribution Blue bars denote a histogram of data divided into 1 sec bins. Red curve is a Poisson curve with rate = median count rate of data. |
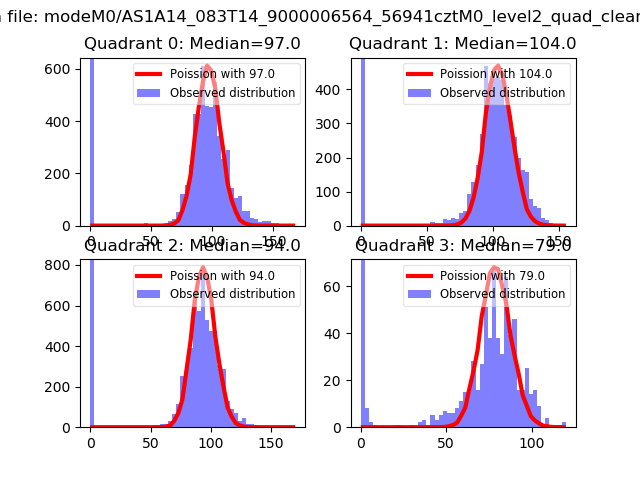 |
 |
| Quadrant-wise count rates Data is divided into 100 sec bins |
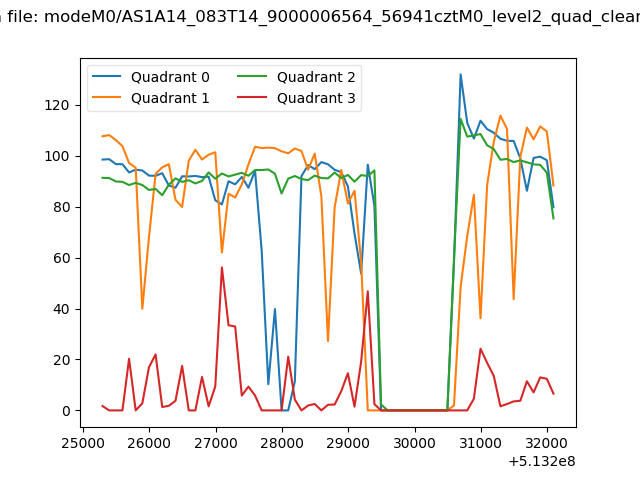 |
|
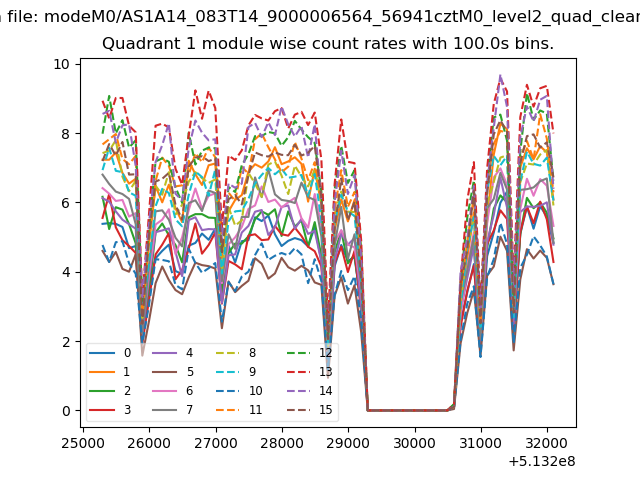
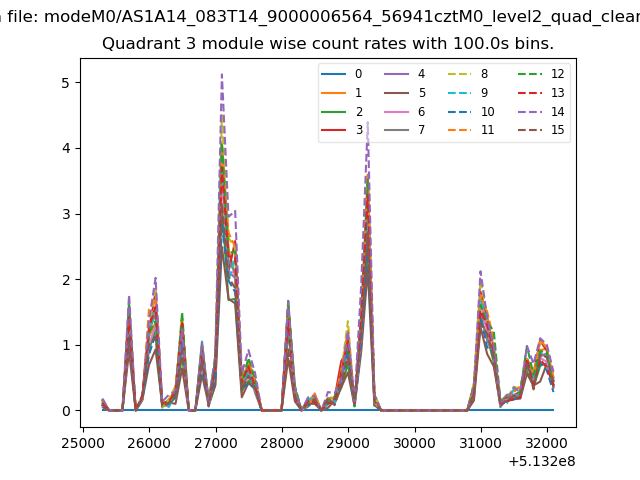
| Module-wise count rates for Quadrant A Data is divided into 100 sec bins |
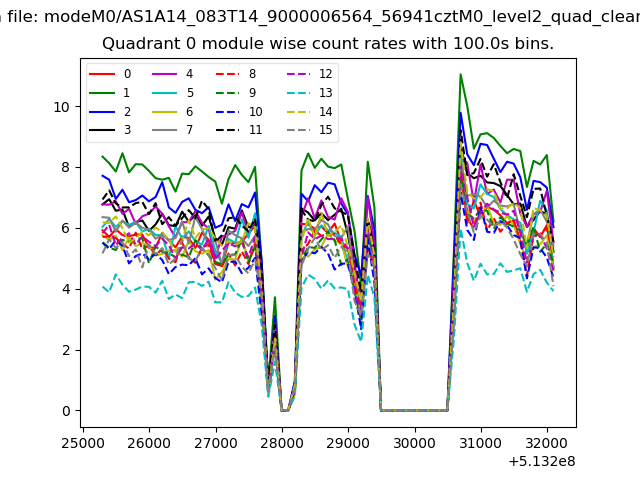 |
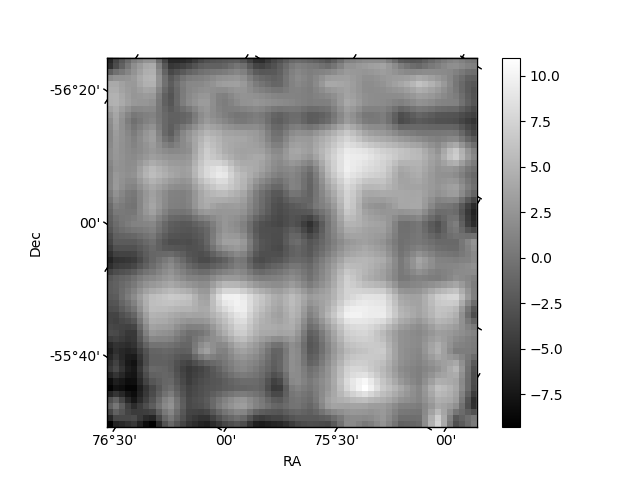 |
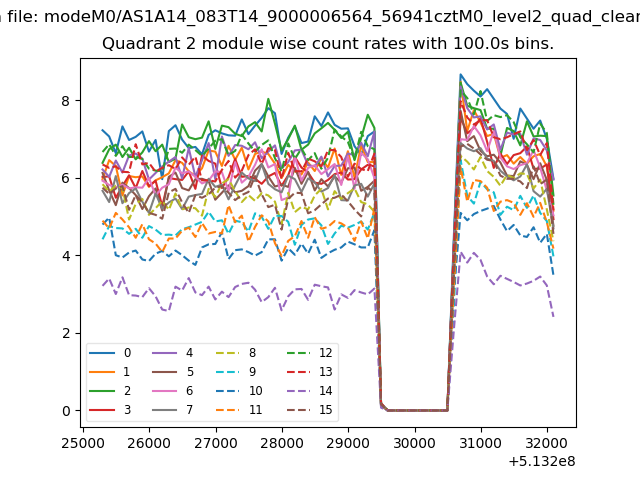
| Module-wise count rates for Quadrant B Data is divided into 100 sec bins |
 |
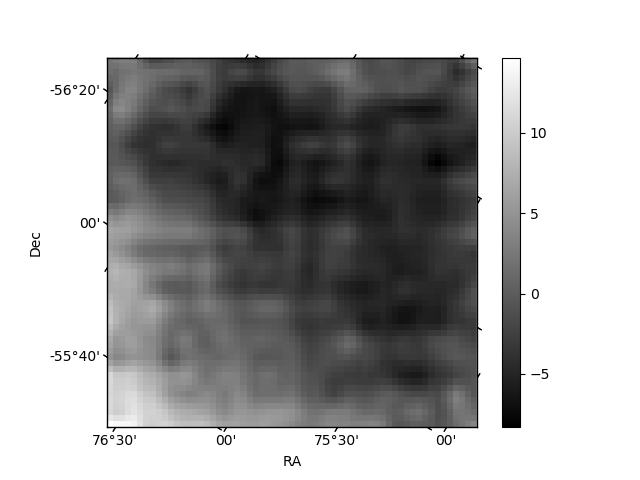 |
| Module-wise count rates for Quadrant C Data is divided into 100 sec bins |
 |
 |
| Module-wise count rates for Quadrant D Data is divided into 100 sec bins |
 |
 |
| Parameter | Plot |
|---|---|
| CZT HV Monitor | 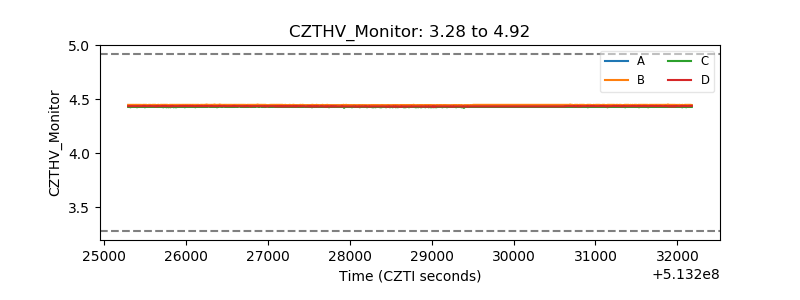 |
| D_VDD | 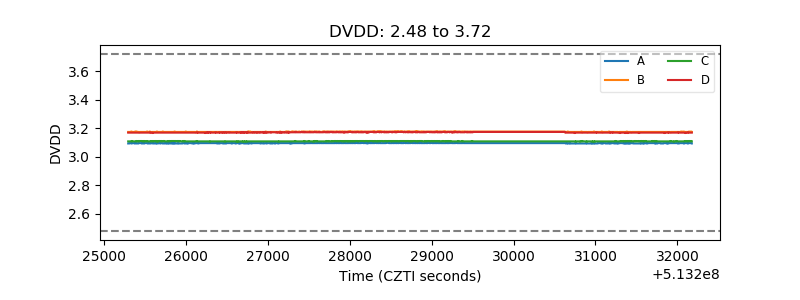 |
| Temperature 1 | 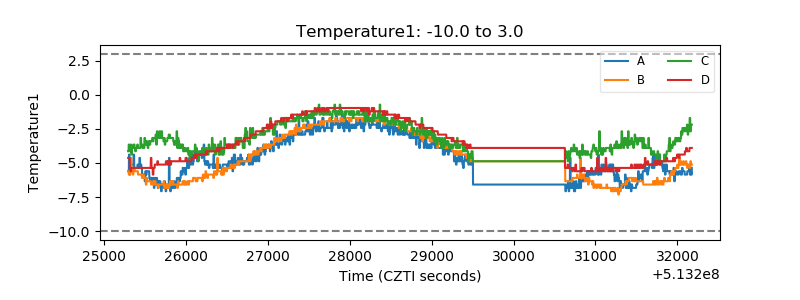 |
| Veto HV Monitor | 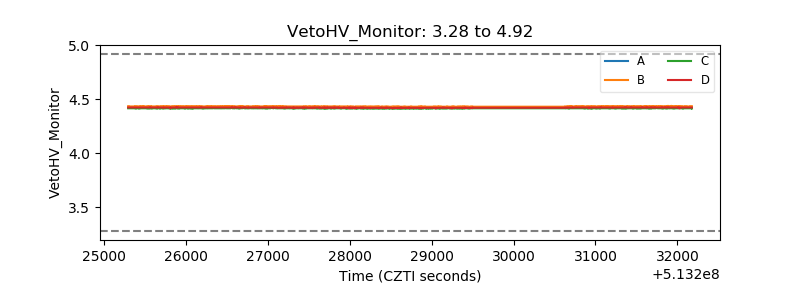 |
| Veto LLD | 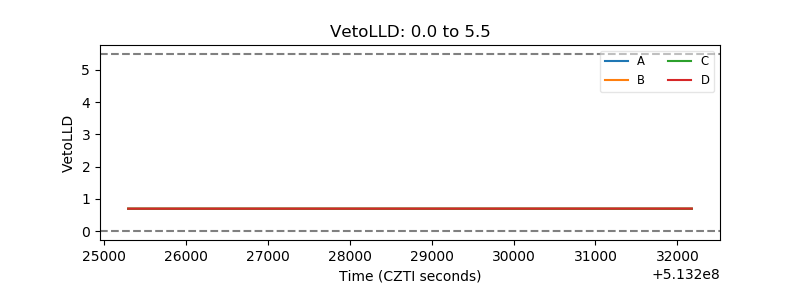 |
| Alpha Counter | 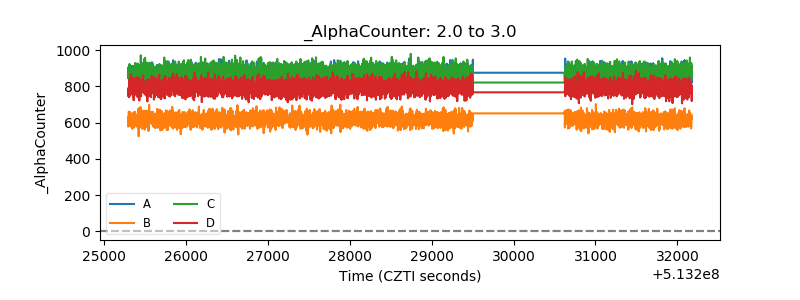 |
| _CPM_Rate | 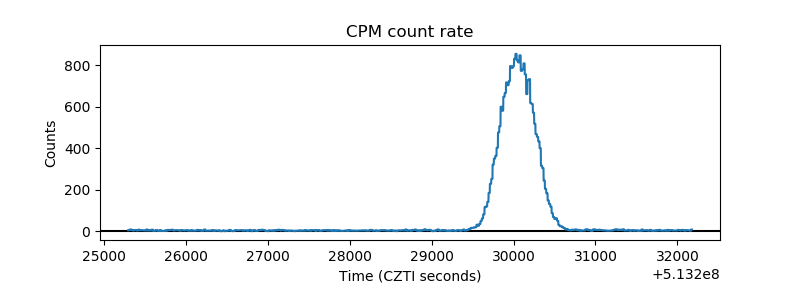 |
| CZT Counter | 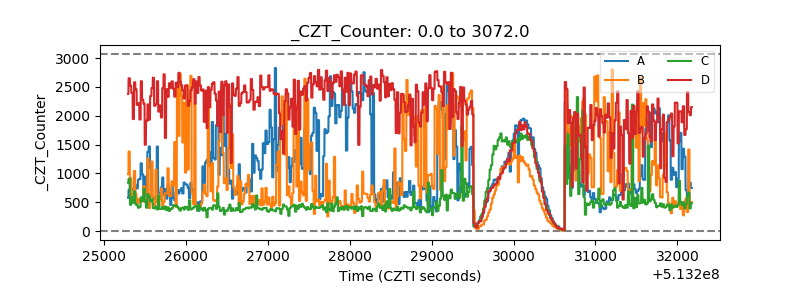 |
| +2.5 Volts monitor |  |
| +5 Volts monitor |  |
| _ROLL_ROT | 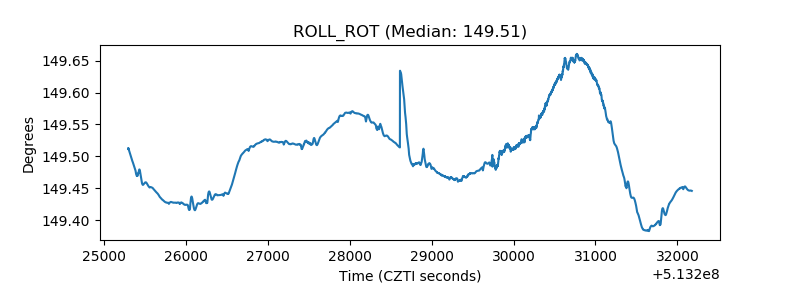 |
| _Roll_DEC | 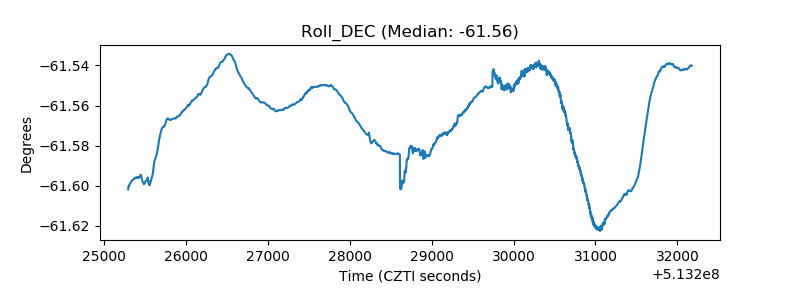 |
| _Roll_RA | 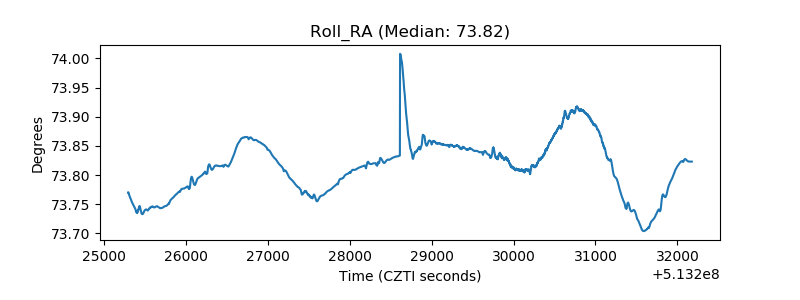 |
| Veto Counter | 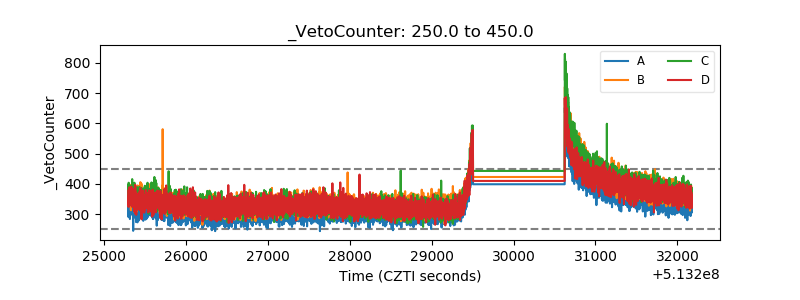 |