| Param | Original file | Final file |
|---|---|---|
| Filename | modeM0/AS1A14_083T14_9000006564_56942cztM0_level2.fits | modeM0/AS1A14_083T14_9000006564_56942cztM0_level2_quad_clean.evt |
| Size (bytes) | 697,642,560 | 76,996,800 |
| Size | 665.3 MB | 73.4 MB |
| Events in quadrant A | 5,716,675 | 565,709 |
| Events in quadrant B | 5,358,877 | 567,922 |
| Events in quadrant C | 3,153,775 | 568,875 |
| Events in quadrant D | 11,135,455 | 214,656 |
| Mode SS | |||
|---|---|---|---|
| Quadrant | BADHDUFLAG | Total packets | Discarded packets |
| A | 0 | 122 | 0 |
| B | 0 | 122 | 0 |
| C | 0 | 122 | 0 |
| D | 0 | 122 | 0 |
| Mode M9 | |||
|---|---|---|---|
| Quadrant | BADHDUFLAG | Total packets | Discarded packets |
| A | 0 | 11 | 0 |
| B | 0 | 11 | 0 |
| C | 0 | 11 | 0 |
| D | 0 | 11 | 0 |
| Mode M0 | |||
|---|---|---|---|
| Quadrant | BADHDUFLAG | Total packets | Discarded packets |
| A | 0 | 21077 | 1 |
| B | 0 | 20018 | 1 |
| C | 0 | 13572 | 1 |
| D | 0 | 37102 | 1 |
| Quadrant | Total seconds | Saturated seconds | Saturation percentage |
|---|---|---|---|
| A | 5921 | 471 | 7.954737% |
| B | 5921 | 859 | 14.507685% |
| C | 5922 | 130 | 2.195204% |
| D | 5922 | 3947 | 66.649780% |
Noise dominated data is calculated using 1-second bins in cleaned event files. If a bin has >2000 counts, and if more than 50% of those come from <1% of pixels, then it is considered to be noise-dominated and hence unusable.
| Quadrant | # 1 sec bins | Bins with >0 counts | Bins with >2000 counts | High rate bins dominated by noise | Noise dominated (total time) | Noise dominated (detector-on time) | Marked lightcurve |
|---|---|---|---|---|---|---|---|
| A | 7091 | 5921 | 397 | 397 | 5.60% | 6.70% | 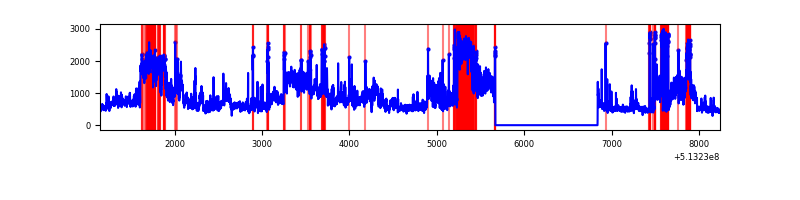 |
| B | 7091 | 5921 | 578 | 578 | 8.15% | 9.76% | 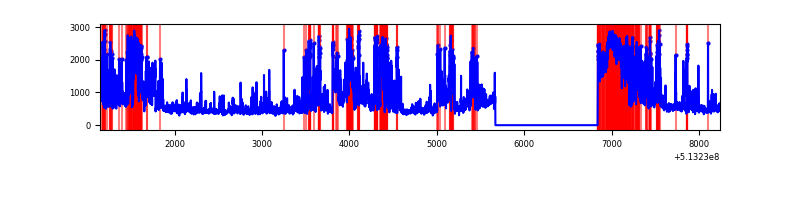 |
| C | 7092 | 5922 | 80 | 80 | 1.13% | 1.35% | 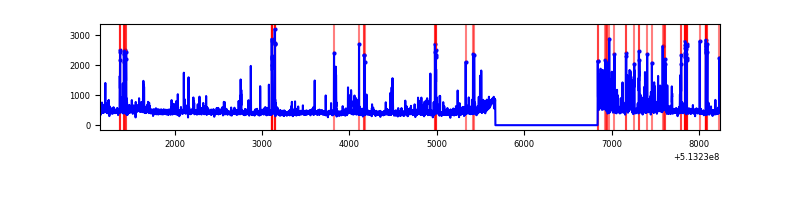 |
| D | 7092 | 5922 | 2914 | 2914 | 41.09% | 49.21% | 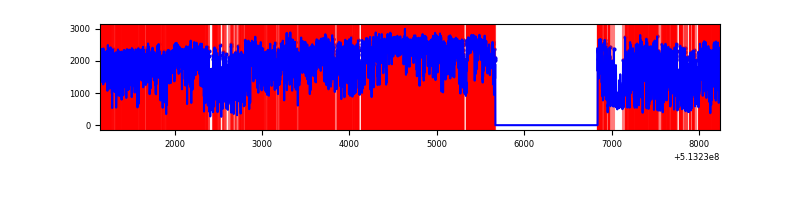 |
Top three noisy pixels from each quadrant. If the there are fewer than three noisy pixels in the level2.evt file, extra rows are filled as -1
| Pixel properties | Quadrant properties | ||||||
|---|---|---|---|---|---|---|---|
| Quadrant | DetID | PixID | Counts | Sigma | Mean | Median | Sigma |
| A | 7 | 64 | 2928192 | 18804.9 | 633 | 618 | 155.7 |
| A | 10 | 251 | 116735 | 745.86 | 633 | 618 | 155.7 |
| A | 3 | 14 | 82170 | 523.84 | 633 | 618 | 155.7 |
| B | 10 | 16 | 1308196 | 10434.78 | 595 | 574 | 125.3 |
| B | 5 | 172 | 1094281 | 8727.75 | 595 | 574 | 125.3 |
| B | 5 | 185 | 396494 | 3159.43 | 595 | 574 | 125.3 |
| C | 13 | 3 | 348500 | 2040.48 | 633 | 628 | 170.5 |
| C | 6 | 223 | 94783 | 552.28 | 633 | 628 | 170.5 |
| C | 7 | 2 | 94421 | 550.15 | 633 | 628 | 170.5 |
| D | 12 | 33 | 8209243 | 65124.19 | 441 | 420 | 126.0 |
| D | 12 | 1 | 311756 | 2469.96 | 441 | 420 | 126.0 |
| D | 8 | 240 | 247621 | 1961.15 | 441 | 420 | 126.0 |
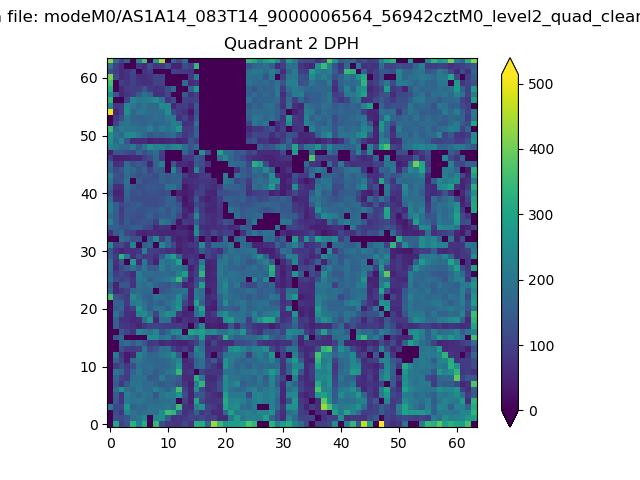
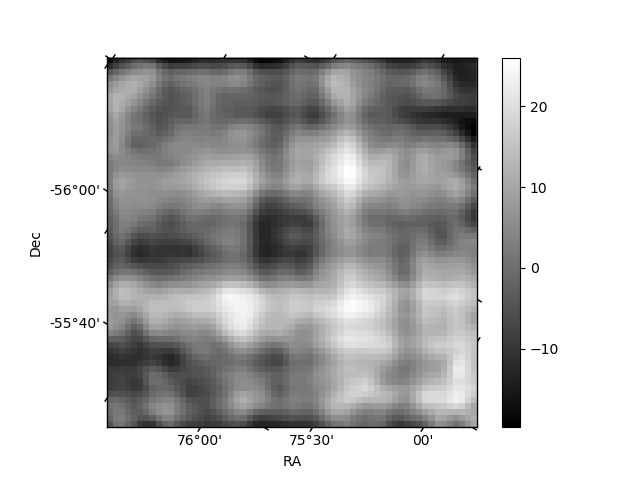
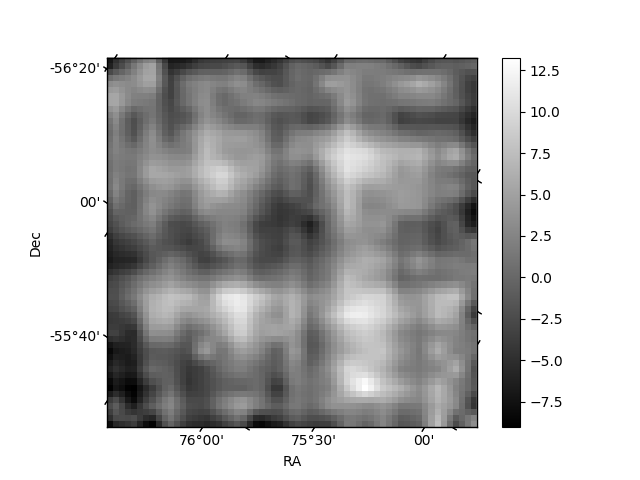
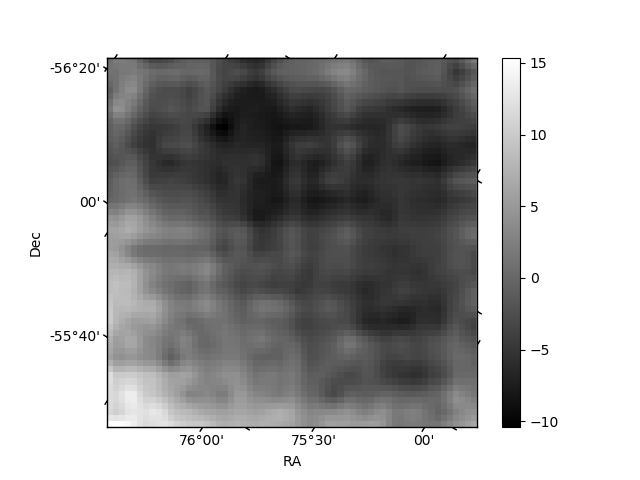
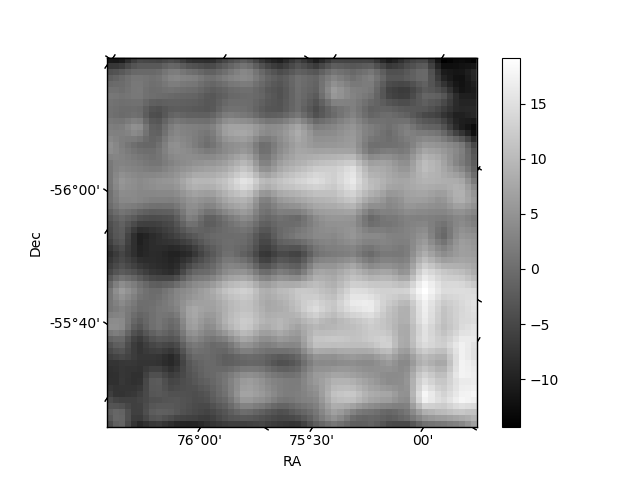
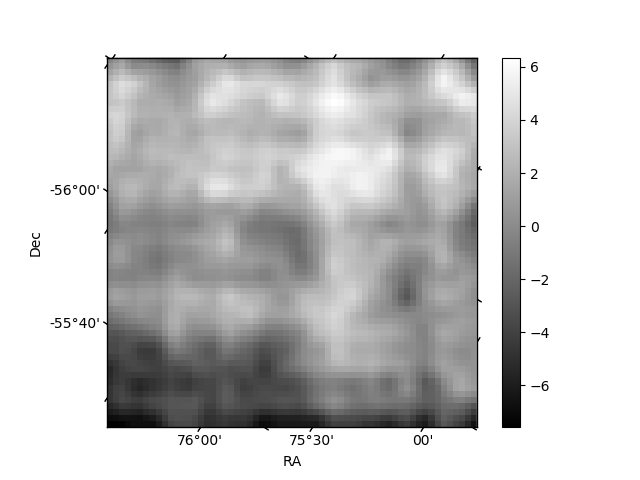
Histogram calculated using DETX and DETY for each event in the final _common_clean file
| Quadrant A | 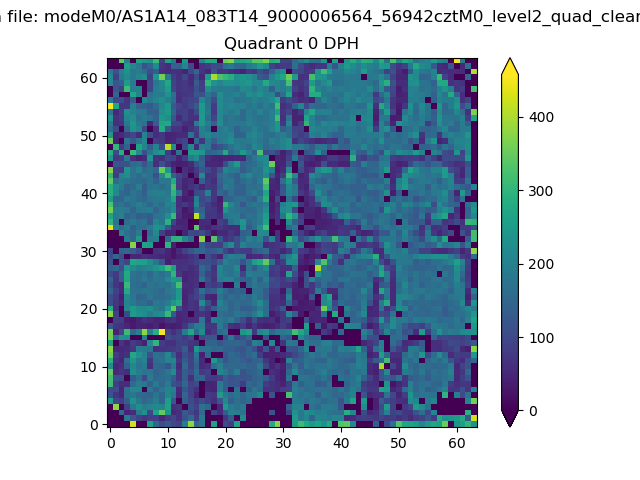 |
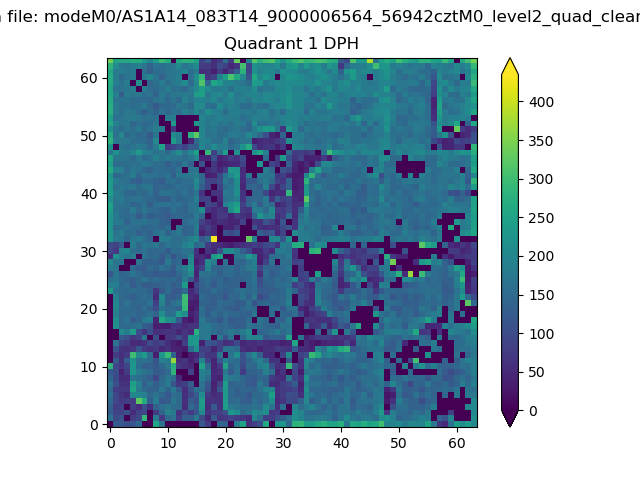 |
Quadrant B |
|---|---|---|---|
| Quadrant D | 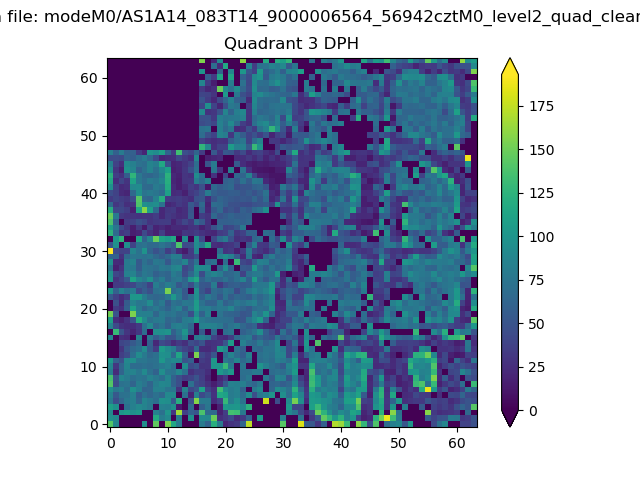 |
 |
Quadrant C |
| Plot type | Count rate plots | Images |
|---|---|---|
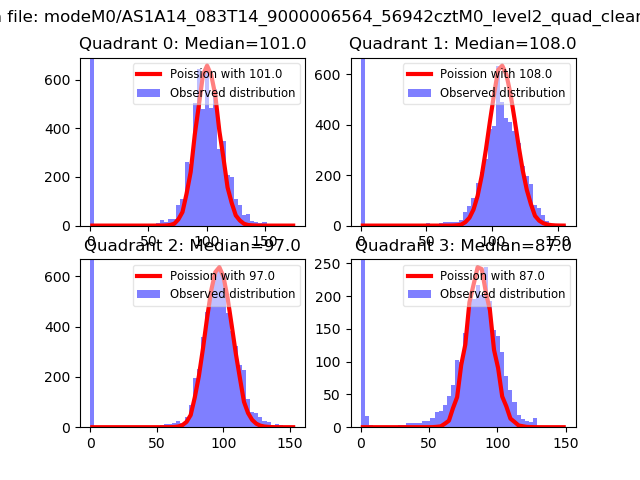
| Comparison with Poisson distribution Blue bars denote a histogram of data divided into 1 sec bins. Red curve is a Poisson curve with rate = median count rate of data. |
 |
 |
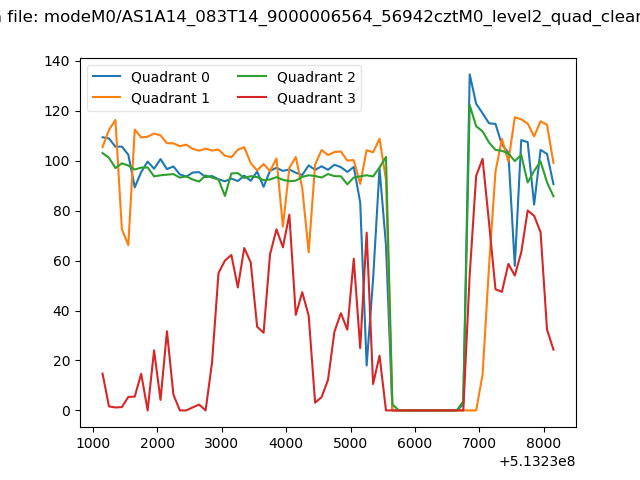
| Quadrant-wise count rates Data is divided into 100 sec bins |
 |
|
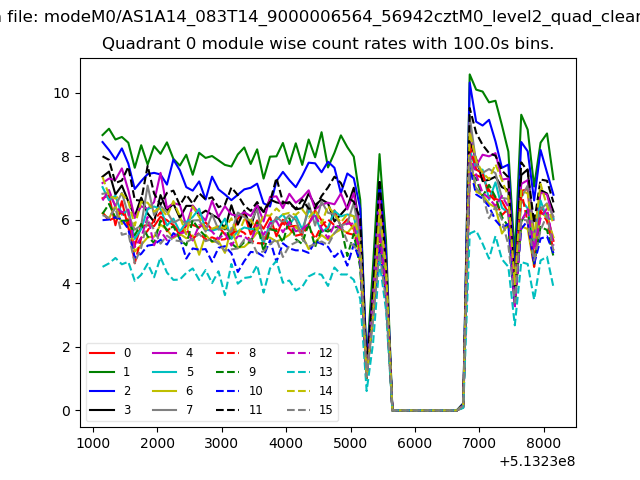
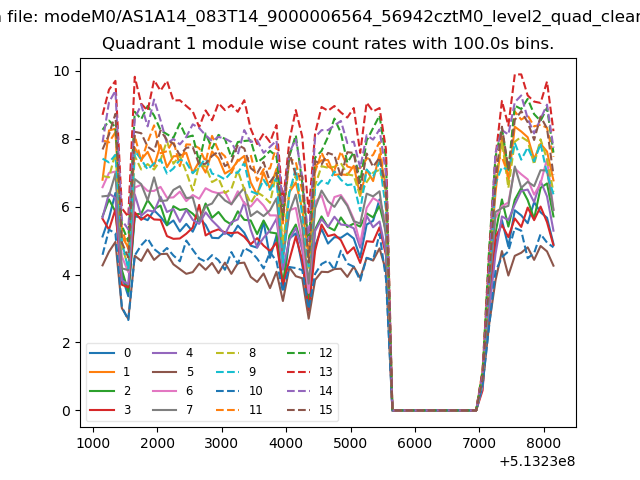
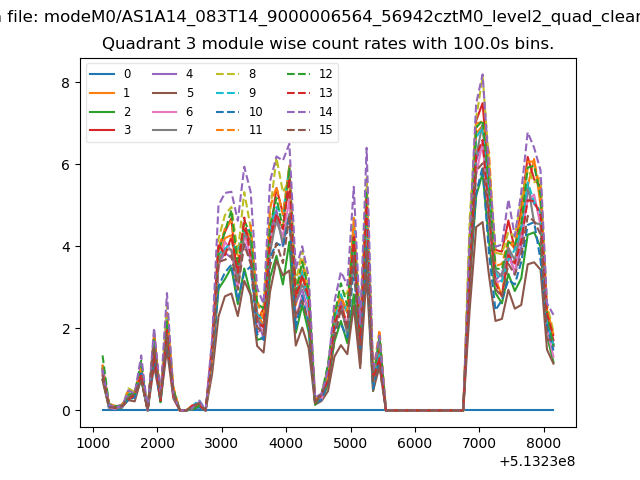
| Module-wise count rates for Quadrant A Data is divided into 100 sec bins |
 |
 |
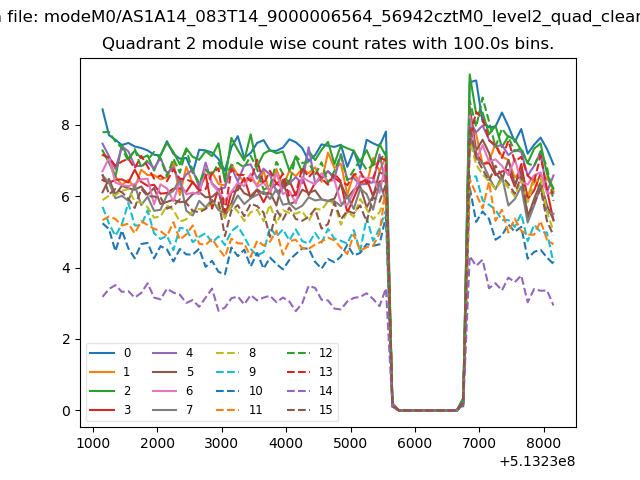
| Module-wise count rates for Quadrant B Data is divided into 100 sec bins |
 |
 |
| Module-wise count rates for Quadrant C Data is divided into 100 sec bins |
 |
 |
| Module-wise count rates for Quadrant D Data is divided into 100 sec bins |
 |
 |
| Parameter | Plot |
|---|---|
| CZT HV Monitor | 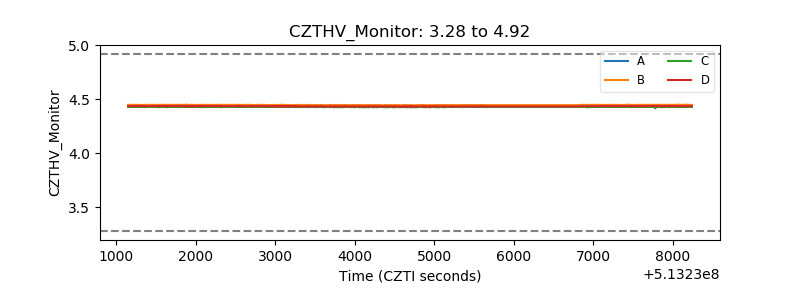 |
| D_VDD | 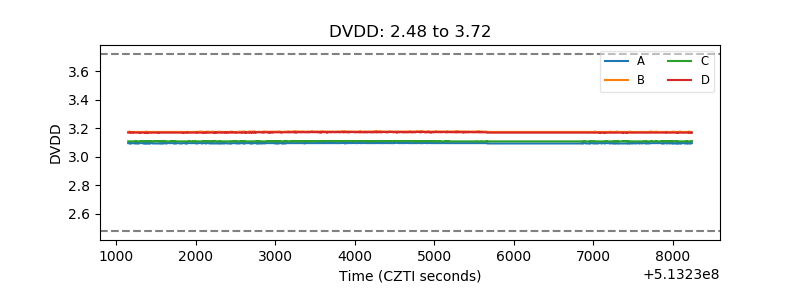 |
| Temperature 1 | 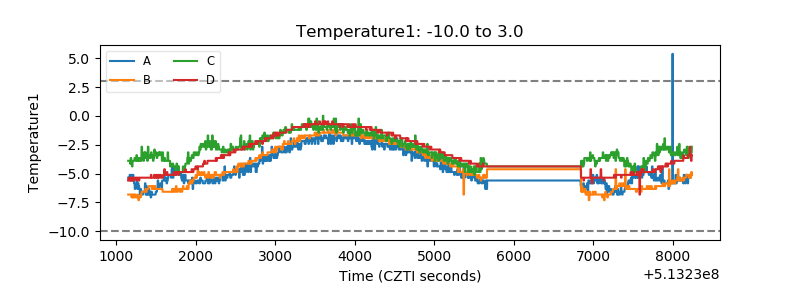 |
| Veto HV Monitor | 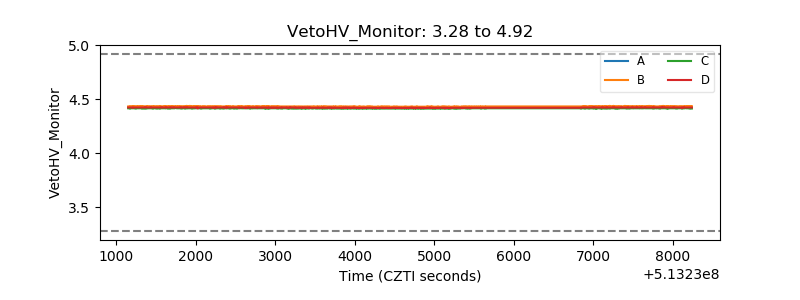 |
| Veto LLD | 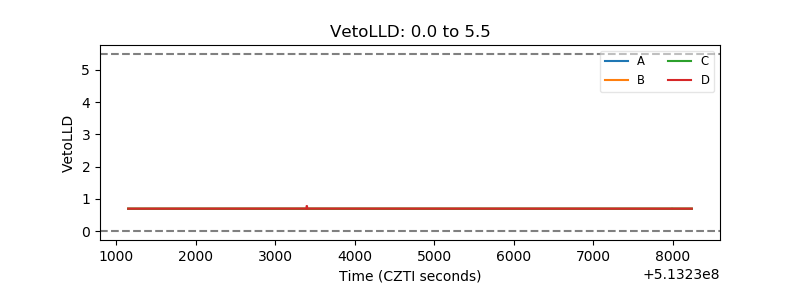 |
| Alpha Counter | 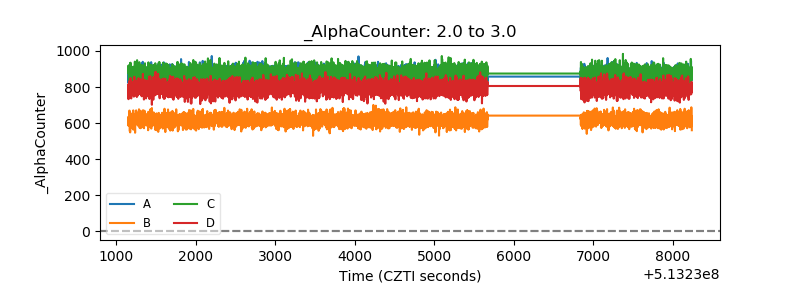 |
| _CPM_Rate | 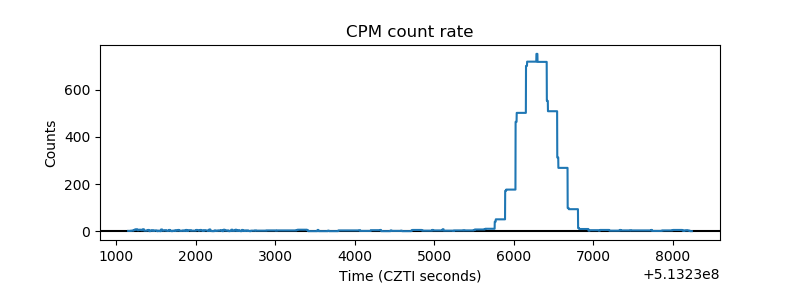 |
| CZT Counter | 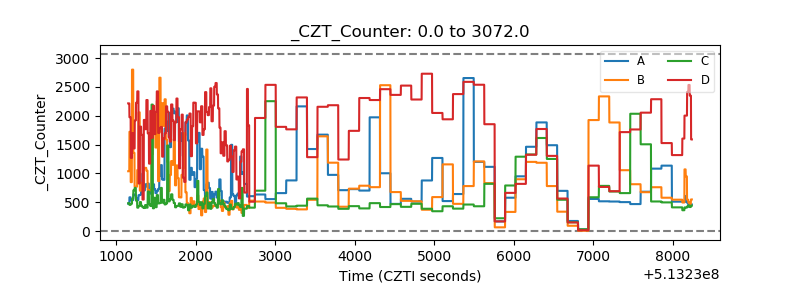 |
| +2.5 Volts monitor |  |
| +5 Volts monitor | 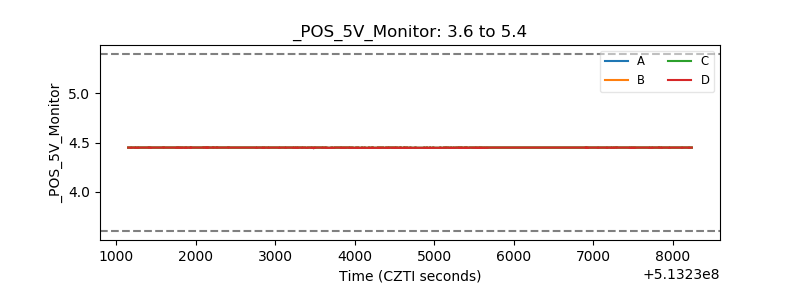 |
| _ROLL_ROT | 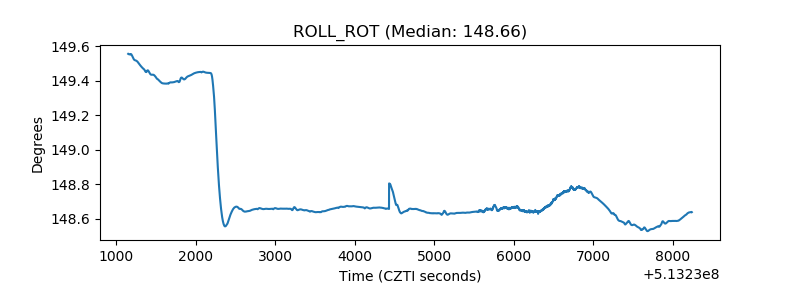 |
| _Roll_DEC | 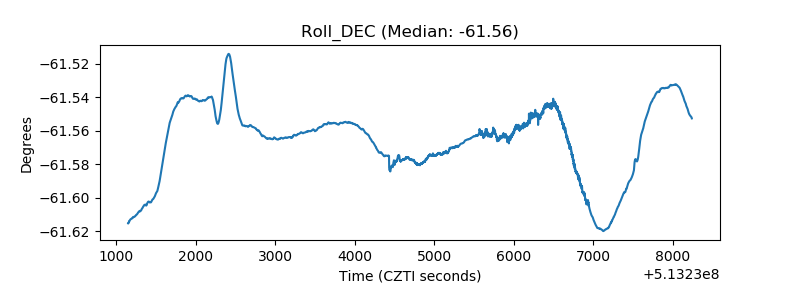 |
| _Roll_RA | 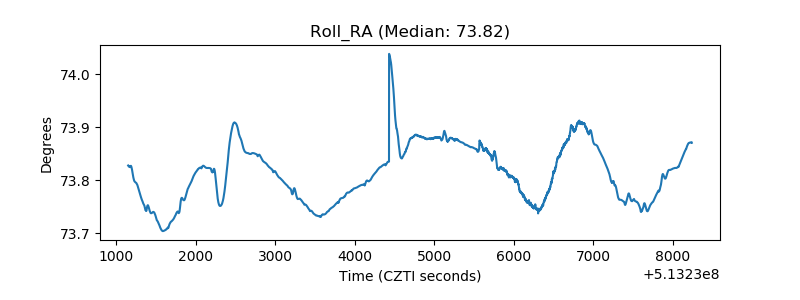 |
| Veto Counter | 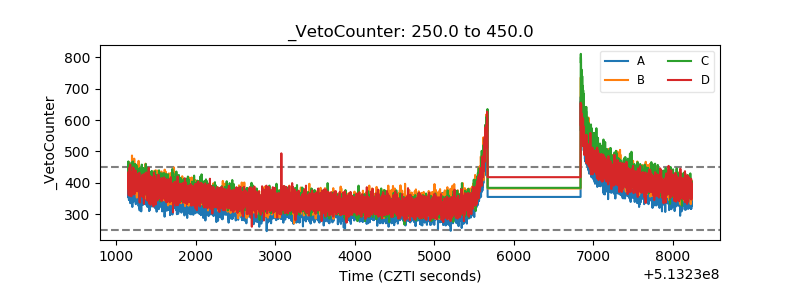 |