| Param | Original file | Final file |
|---|---|---|
| Filename | modeM0/AS1A14_083T14_9000006564_56943cztM0_level2.fits | modeM0/AS1A14_083T14_9000006564_56943cztM0_level2_quad_clean.evt |
| Size (bytes) | 713,410,560 | 78,687,360 |
| Size | 680.4 MB | 75.0 MB |
| Events in quadrant A | 6,565,844 | 499,242 |
| Events in quadrant B | 5,729,789 | 587,046 |
| Events in quadrant C | 3,238,729 | 582,119 |
| Events in quadrant D | 10,402,975 | 290,253 |
| Mode SS | |||
|---|---|---|---|
| Quadrant | BADHDUFLAG | Total packets | Discarded packets |
| A | 0 | 124 | 0 |
| B | 0 | 124 | 0 |
| C | 0 | 124 | 0 |
| D | 0 | 124 | 0 |
| Mode M9 | |||
|---|---|---|---|
| Quadrant | BADHDUFLAG | Total packets | Discarded packets |
| A | 0 | 11 | 0 |
| B | 0 | 11 | 0 |
| C | 0 | 11 | 0 |
| D | 0 | 11 | 0 |
| Mode M0 | |||
|---|---|---|---|
| Quadrant | BADHDUFLAG | Total packets | Discarded packets |
| A | 0 | 23575 | 2 |
| B | 0 | 21215 | 2 |
| C | 0 | 13915 | 2 |
| D | 0 | 35032 | 2 |
| Quadrant | Total seconds | Saturated seconds | Saturation percentage |
|---|---|---|---|
| A | 6069 | 1245 | 20.514088% |
| B | 6069 | 902 | 14.862416% |
| C | 6068 | 157 | 2.587343% |
| D | 6069 | 3243 | 53.435492% |
Noise dominated data is calculated using 1-second bins in cleaned event files. If a bin has >2000 counts, and if more than 50% of those come from <1% of pixels, then it is considered to be noise-dominated and hence unusable.
| Quadrant | # 1 sec bins | Bins with >0 counts | Bins with >2000 counts | High rate bins dominated by noise | Noise dominated (total time) | Noise dominated (detector-on time) | Marked lightcurve |
|---|---|---|---|---|---|---|---|
| A | 7239 | 6069 | 1191 | 1191 | 16.45% | 19.62% | 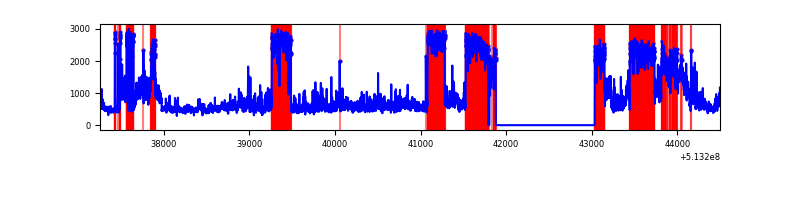 |
| B | 7239 | 6070 | 639 | 639 | 8.83% | 10.53% | 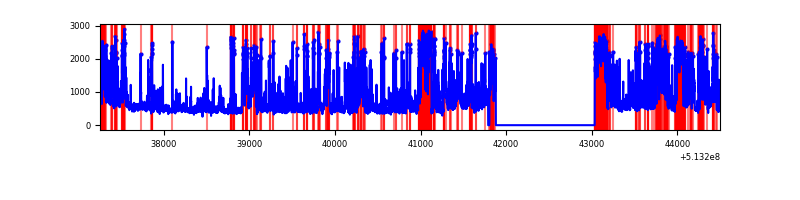 |
| C | 7238 | 6069 | 94 | 94 | 1.30% | 1.55% | 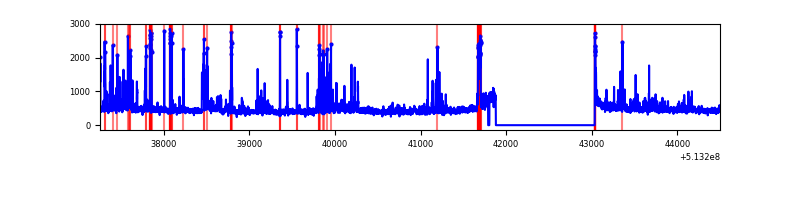 |
| D | 7239 | 6069 | 2952 | 2952 | 40.78% | 48.64% | 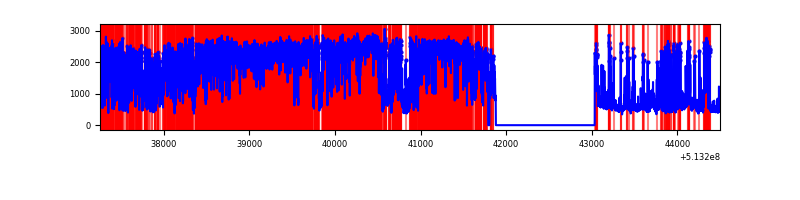 |
Top three noisy pixels from each quadrant. If the there are fewer than three noisy pixels in the level2.evt file, extra rows are filled as -1
| Pixel properties | Quadrant properties | ||||||
|---|---|---|---|---|---|---|---|
| Quadrant | DetID | PixID | Counts | Sigma | Mean | Median | Sigma |
| A | 7 | 64 | 3811453 | 25514.18 | 603 | 589 | 149.4 |
| A | 3 | 14 | 254623 | 1700.79 | 603 | 589 | 149.4 |
| A | 4 | 249 | 59086 | 391.64 | 603 | 589 | 149.4 |
| B | 5 | 172 | 2164006 | 16762.86 | 612 | 592 | 129.1 |
| B | 10 | 16 | 603057 | 4668.1 | 612 | 592 | 129.1 |
| B | 5 | 185 | 334882 | 2590.19 | 612 | 592 | 129.1 |
| C | 13 | 3 | 511874 | 2885.08 | 648 | 642 | 177.2 |
| C | 6 | 223 | 106915 | 599.74 | 648 | 642 | 177.2 |
| C | 14 | 254 | 25109 | 138.08 | 648 | 642 | 177.2 |
| D | 12 | 33 | 7221320 | 50470.31 | 499 | 473 | 143.1 |
| D | 8 | 240 | 574826 | 4014.46 | 499 | 473 | 143.1 |
| D | 12 | 1 | 280566 | 1957.72 | 499 | 473 | 143.1 |
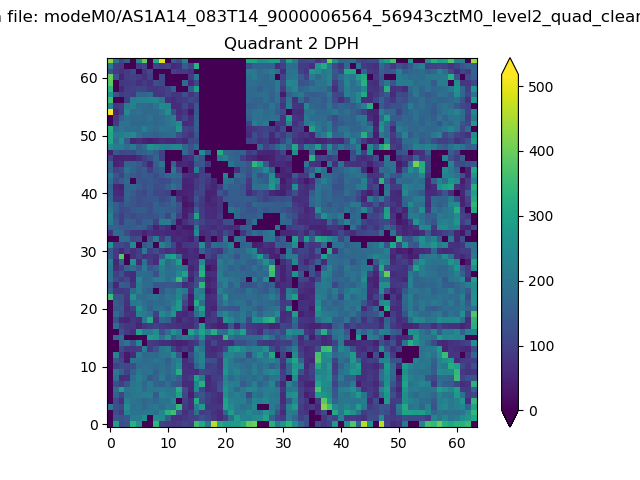
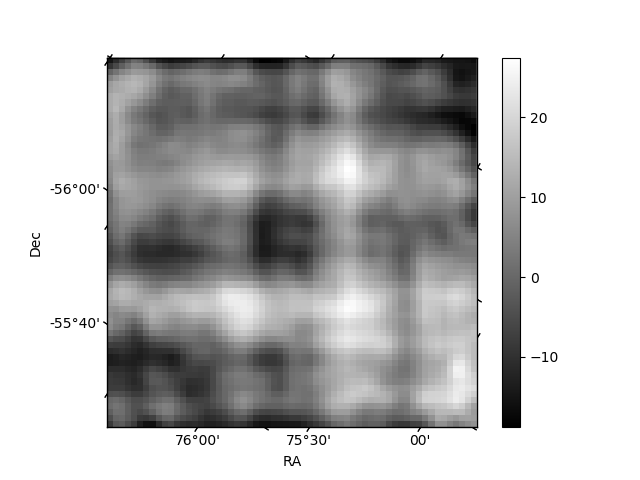
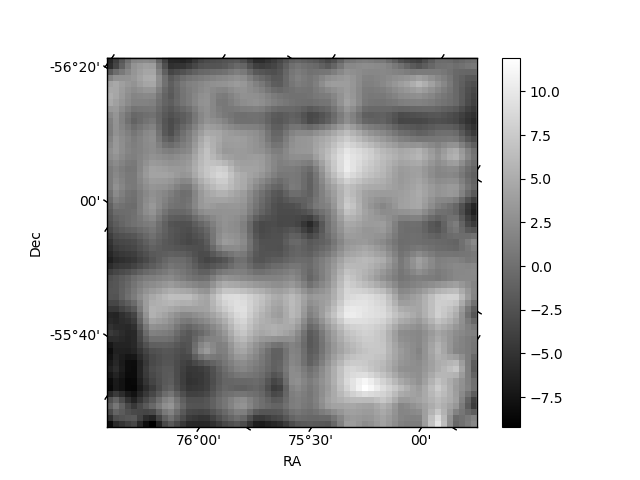
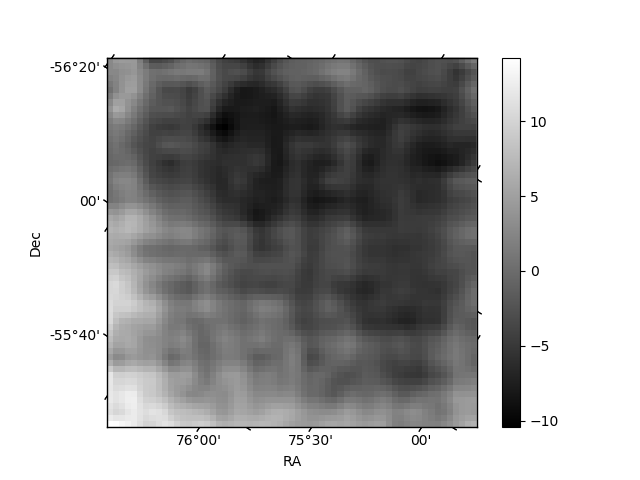
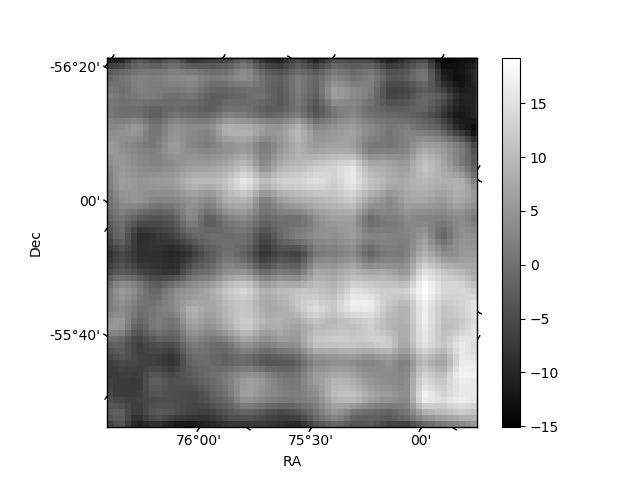
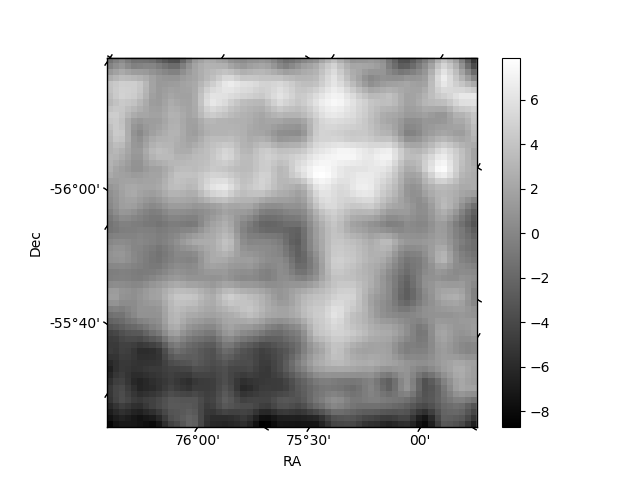
Histogram calculated using DETX and DETY for each event in the final _common_clean file
| Quadrant A | 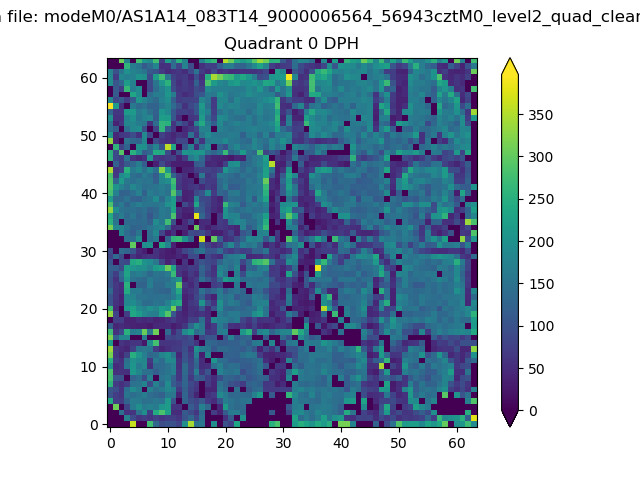 |
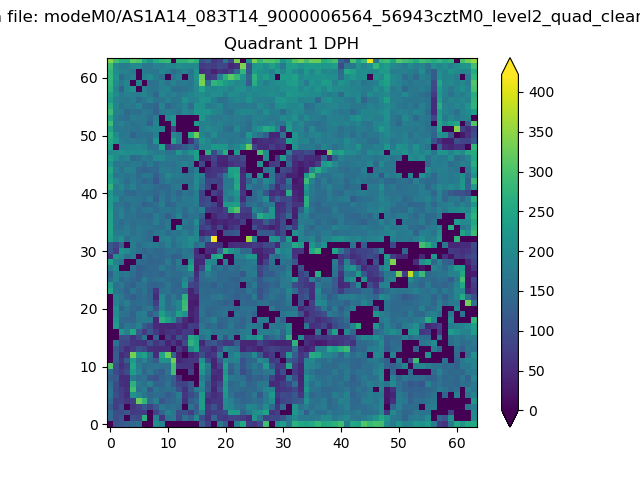 |
Quadrant B |
|---|---|---|---|
| Quadrant D | 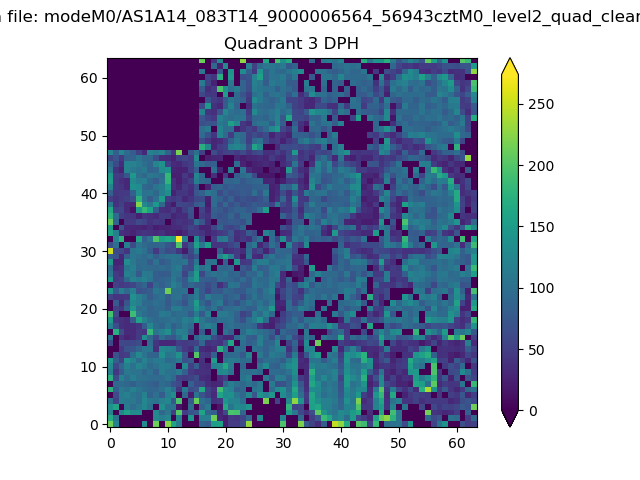 |
 |
Quadrant C |
| Plot type | Count rate plots | Images |
|---|---|---|
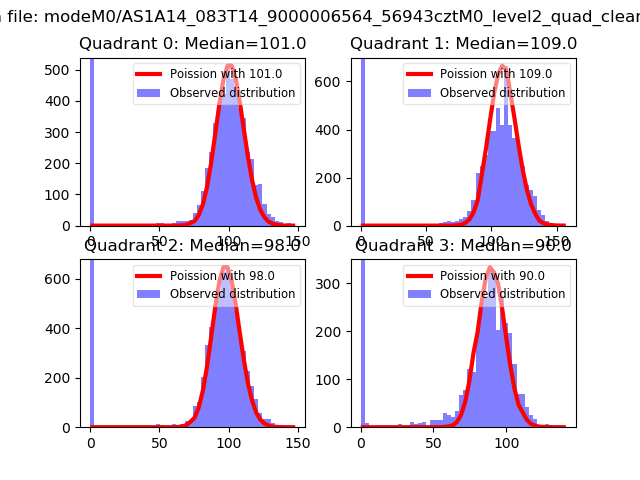
| Comparison with Poisson distribution Blue bars denote a histogram of data divided into 1 sec bins. Red curve is a Poisson curve with rate = median count rate of data. |
 |
 |
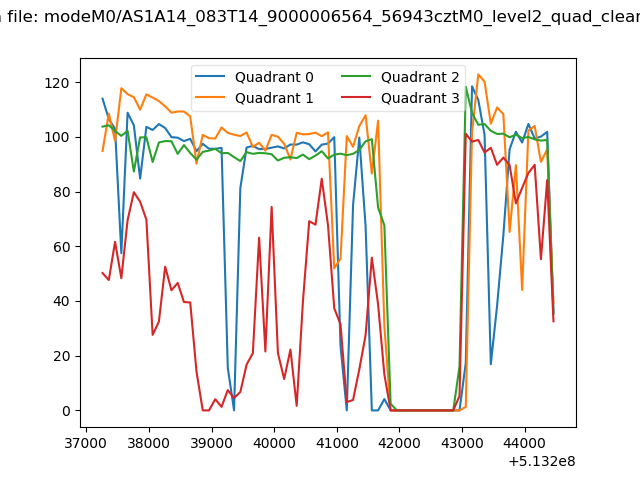
| Quadrant-wise count rates Data is divided into 100 sec bins |
 |
|
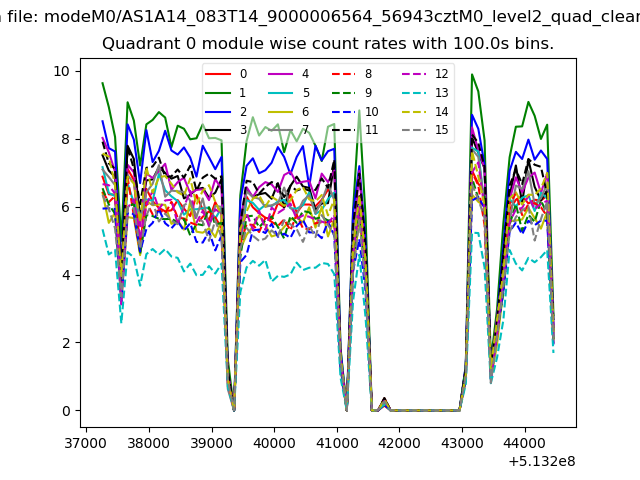
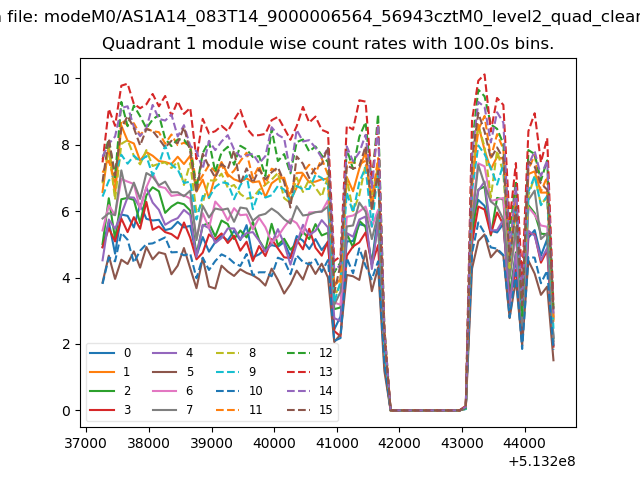
| Module-wise count rates for Quadrant A Data is divided into 100 sec bins |
 |
 |
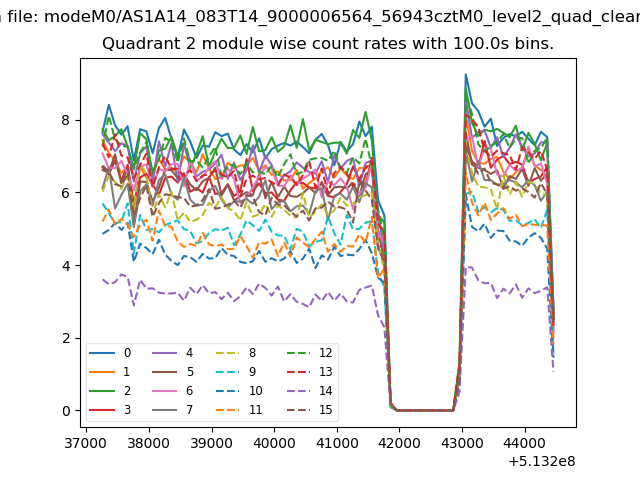
| Module-wise count rates for Quadrant B Data is divided into 100 sec bins |
 |
 |
| Module-wise count rates for Quadrant C Data is divided into 100 sec bins |
 |
 |
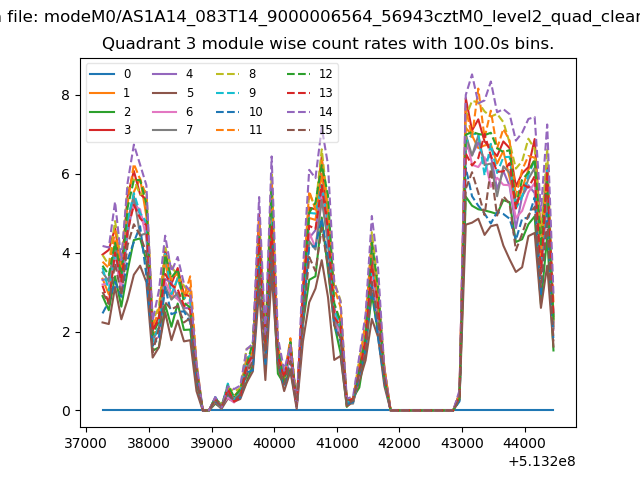
| Module-wise count rates for Quadrant D Data is divided into 100 sec bins |
 |
 |
| Parameter | Plot |
|---|---|
| CZT HV Monitor | 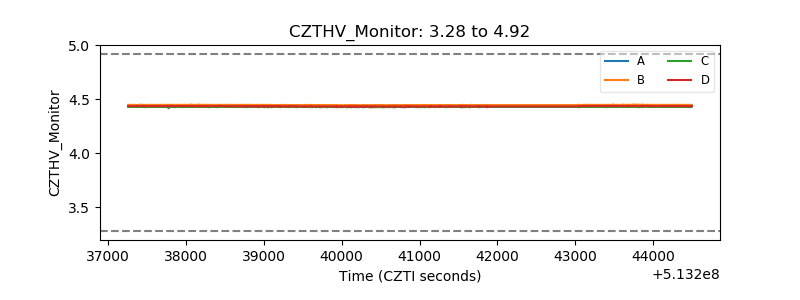 |
| D_VDD | 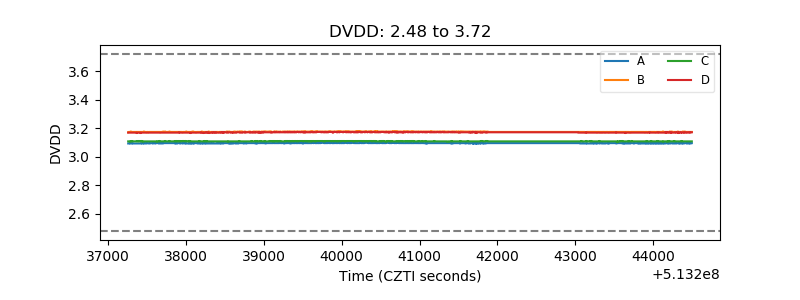 |
| Temperature 1 | 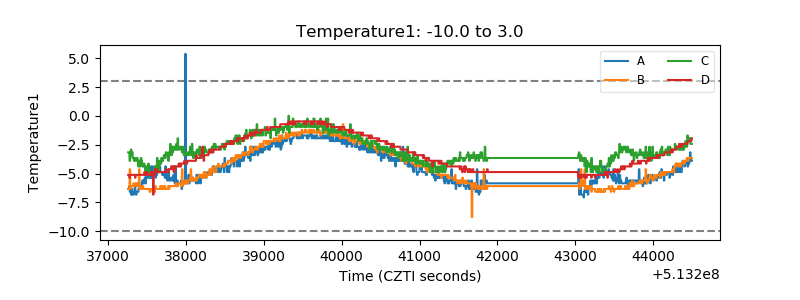 |
| Veto HV Monitor | 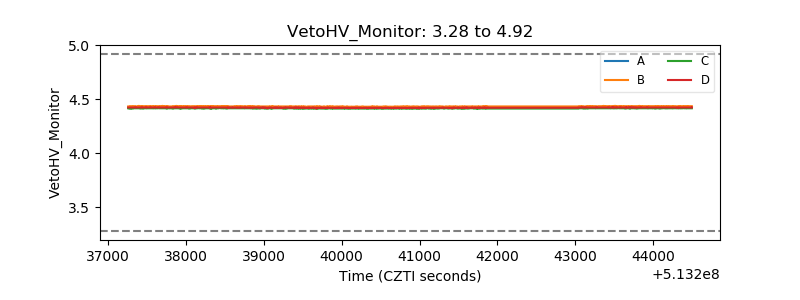 |
| Veto LLD | 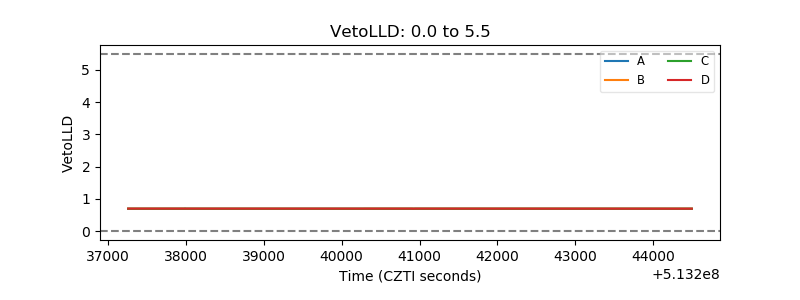 |
| Alpha Counter | 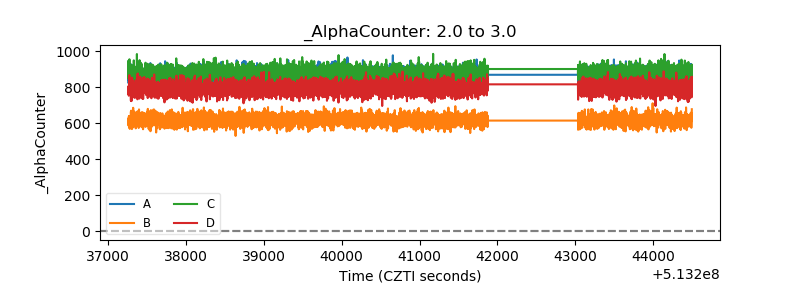 |
| _CPM_Rate | 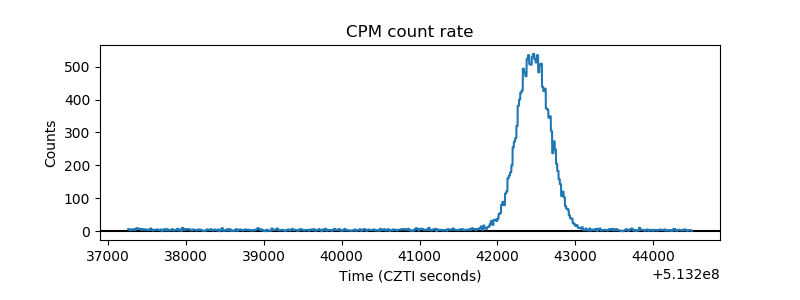 |
| CZT Counter | 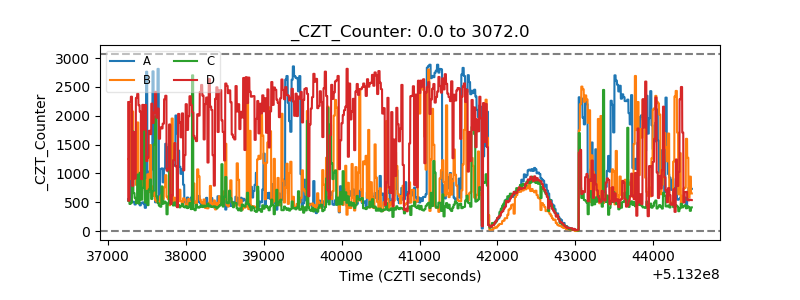 |
| +2.5 Volts monitor |  |
| +5 Volts monitor | 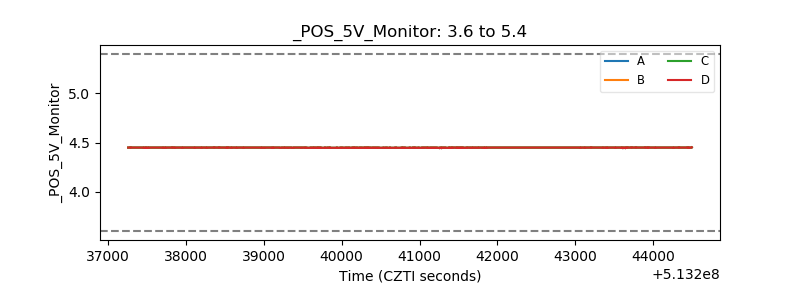 |
| _ROLL_ROT | 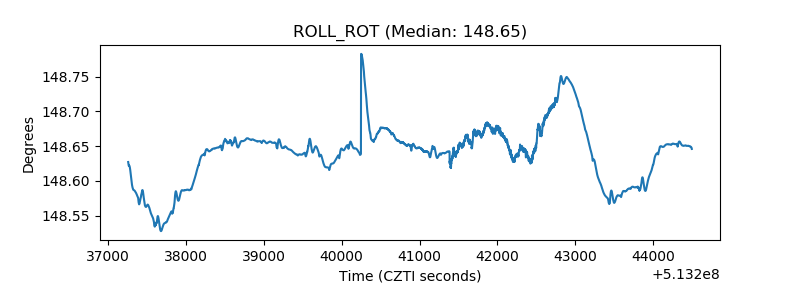 |
| _Roll_DEC | 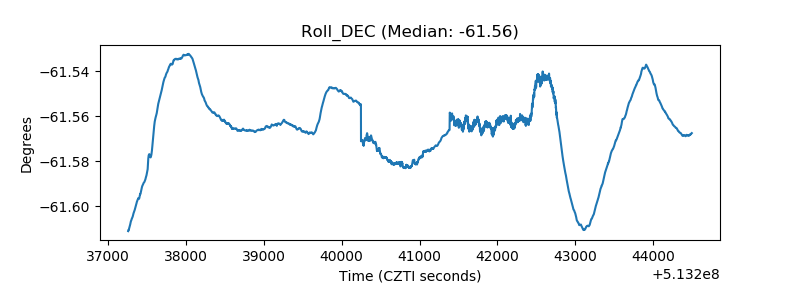 |
| _Roll_RA | 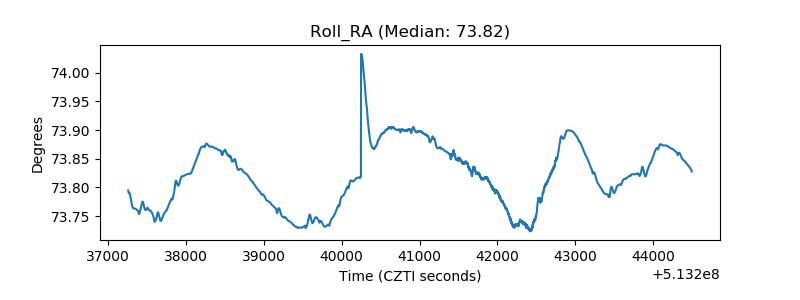 |
| Veto Counter | 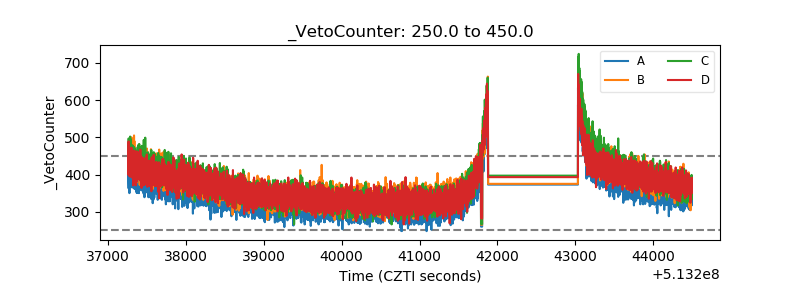 |