| Param | Original file | Final file |
|---|---|---|
| Filename | modeM0/AS1A14_083T14_9000006564_56944cztM0_level2.fits | modeM0/AS1A14_083T14_9000006564_56944cztM0_level2_quad_clean.evt |
| Size (bytes) | 725,613,120 | 78,206,400 |
| Size | 692.0 MB | 74.6 MB |
| Events in quadrant A | 5,697,914 | 533,878 |
| Events in quadrant B | 6,773,771 | 563,068 |
| Events in quadrant C | 3,040,628 | 589,607 |
| Events in quadrant D | 10,862,187 | 244,826 |
| Mode SS | |||
|---|---|---|---|
| Quadrant | BADHDUFLAG | Total packets | Discarded packets |
| A | 0 | 128 | 0 |
| B | 0 | 128 | 0 |
| C | 0 | 128 | 0 |
| D | 0 | 128 | 0 |
| Mode M9 | |||
|---|---|---|---|
| Quadrant | BADHDUFLAG | Total packets | Discarded packets |
| A | 0 | 10 | 0 |
| B | 0 | 10 | 0 |
| C | 0 | 10 | 0 |
| D | 0 | 10 | 0 |
| Mode M0 | |||
|---|---|---|---|
| Quadrant | BADHDUFLAG | Total packets | Discarded packets |
| A | 0 | 21269 | 2 |
| B | 0 | 24512 | 2 |
| C | 0 | 13699 | 2 |
| D | 0 | 36507 | 4 |
| Quadrant | Total seconds | Saturated seconds | Saturation percentage |
|---|---|---|---|
| A | 6249 | 983 | 15.730517% |
| B | 6249 | 1191 | 19.059049% |
| C | 6250 | 122 | 1.952000% |
| D | 6249 | 3793 | 60.697712% |
Noise dominated data is calculated using 1-second bins in cleaned event files. If a bin has >2000 counts, and if more than 50% of those come from <1% of pixels, then it is considered to be noise-dominated and hence unusable.
| Quadrant | # 1 sec bins | Bins with >0 counts | Bins with >2000 counts | High rate bins dominated by noise | Noise dominated (total time) | Noise dominated (detector-on time) | Marked lightcurve |
|---|---|---|---|---|---|---|---|
| A | 7278 | 6248 | 870 | 870 | 11.95% | 13.92% | 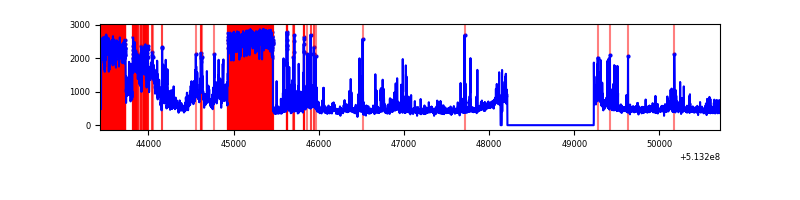 |
| B | 7278 | 6248 | 879 | 879 | 12.08% | 14.07% | 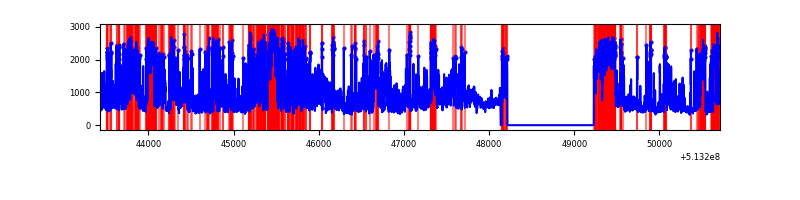 |
| C | 7279 | 6249 | 21 | 21 | 0.29% | 0.34% | 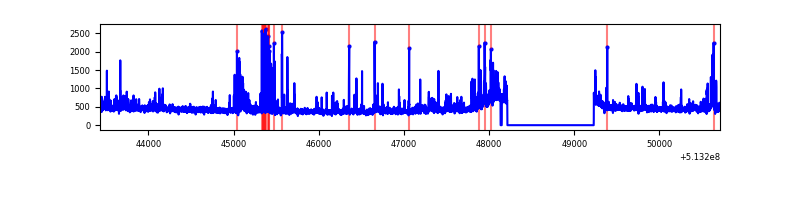 |
| D | 7278 | 6248 | 3159 | 3159 | 43.40% | 50.56% | 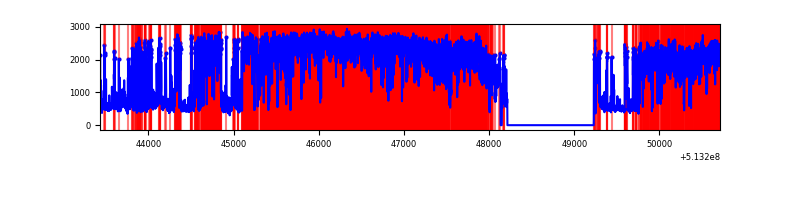 |
Top three noisy pixels from each quadrant. If the there are fewer than three noisy pixels in the level2.evt file, extra rows are filled as -1
| Pixel properties | Quadrant properties | ||||||
|---|---|---|---|---|---|---|---|
| Quadrant | DetID | PixID | Counts | Sigma | Mean | Median | Sigma |
| A | 7 | 64 | 2715127 | 16870.41 | 650 | 632 | 160.9 |
| A | 4 | 249 | 148007 | 915.93 | 650 | 632 | 160.9 |
| A | 3 | 14 | 124527 | 770.0 | 650 | 632 | 160.9 |
| B | 5 | 172 | 2624810 | 20382.33 | 611 | 588 | 128.7 |
| B | 0 | 171 | 561886 | 4359.6 | 611 | 588 | 128.7 |
| B | 10 | 16 | 500859 | 3885.6 | 611 | 588 | 128.7 |
| C | 13 | 3 | 273500 | 1513.03 | 664 | 657 | 180.3 |
| C | 14 | 254 | 66158 | 363.23 | 664 | 657 | 180.3 |
| C | 7 | 2 | 44076 | 240.78 | 664 | 657 | 180.3 |
| D | 12 | 33 | 7822983 | 57051.83 | 482 | 460 | 137.1 |
| D | 12 | 1 | 256893 | 1870.24 | 482 | 460 | 137.1 |
| D | 8 | 240 | 252260 | 1836.45 | 482 | 460 | 137.1 |
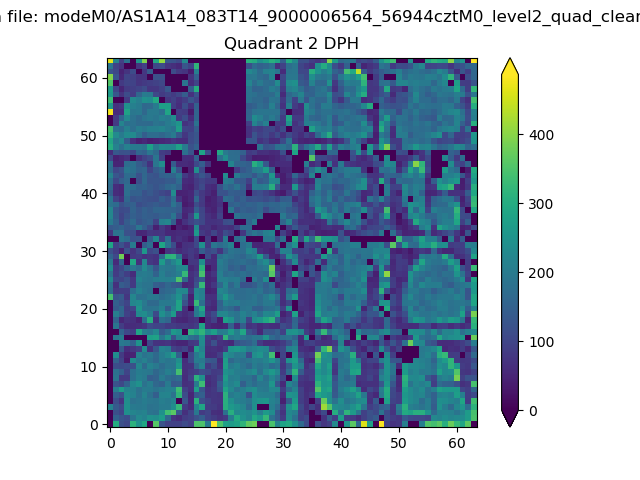
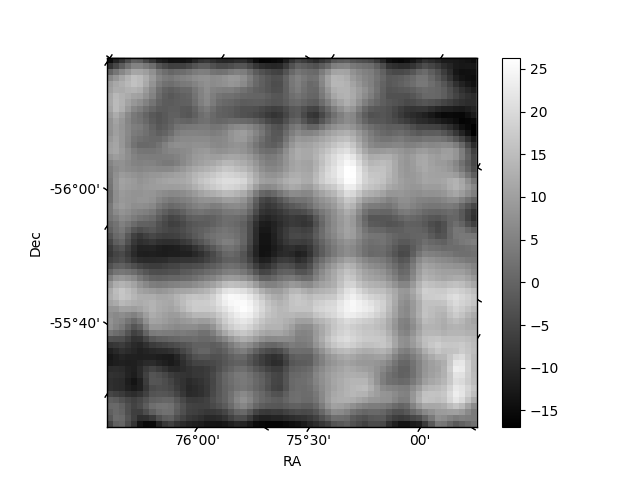
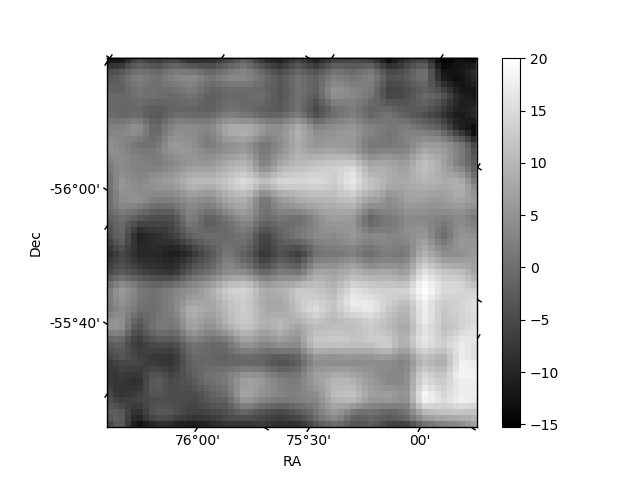
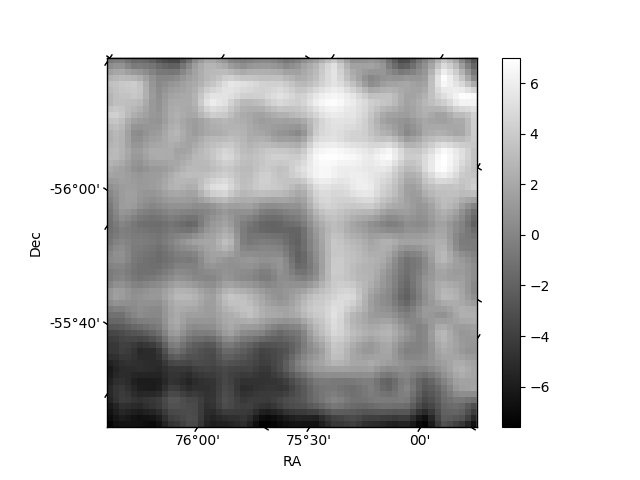
Histogram calculated using DETX and DETY for each event in the final _common_clean file
| Quadrant A | 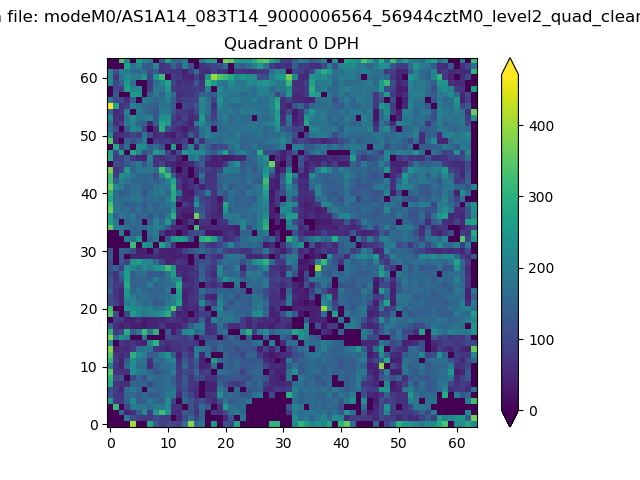 |
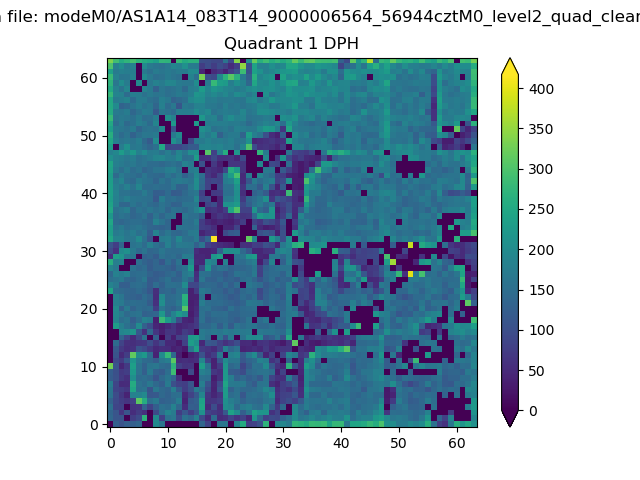 |
Quadrant B |
|---|---|---|---|
| Quadrant D | 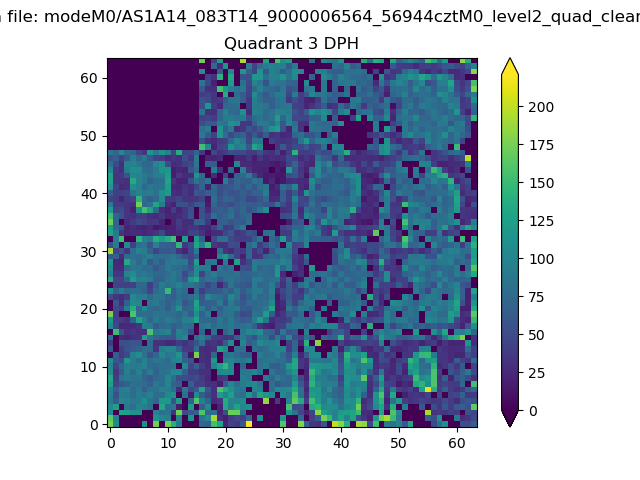 |
 |
Quadrant C |
| Plot type | Count rate plots | Images |
|---|---|---|
| Comparison with Poisson distribution Blue bars denote a histogram of data divided into 1 sec bins. Red curve is a Poisson curve with rate = median count rate of data. |
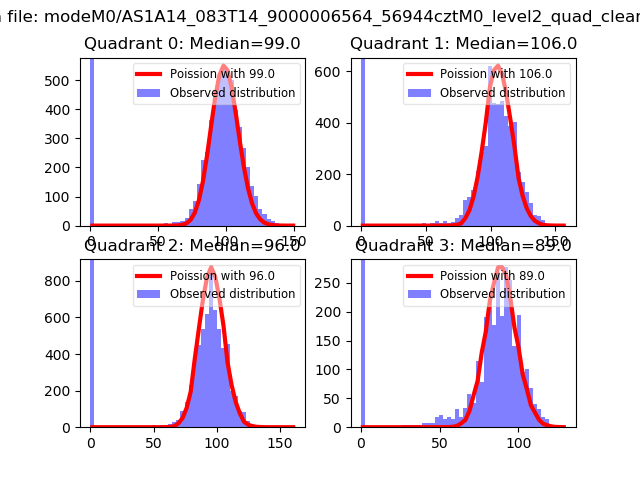 |
 |
| Quadrant-wise count rates Data is divided into 100 sec bins |
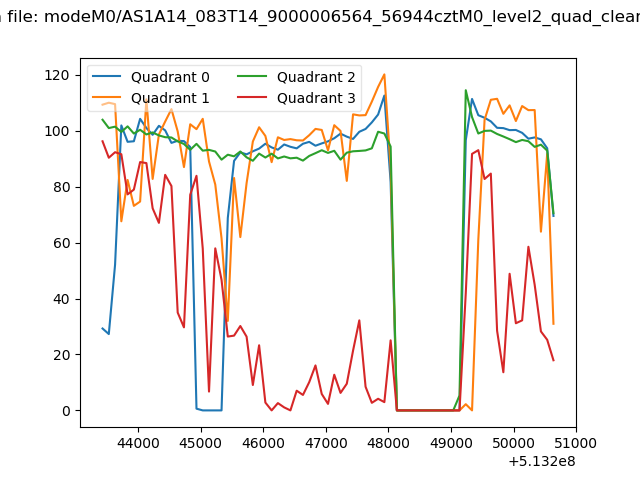 |
|
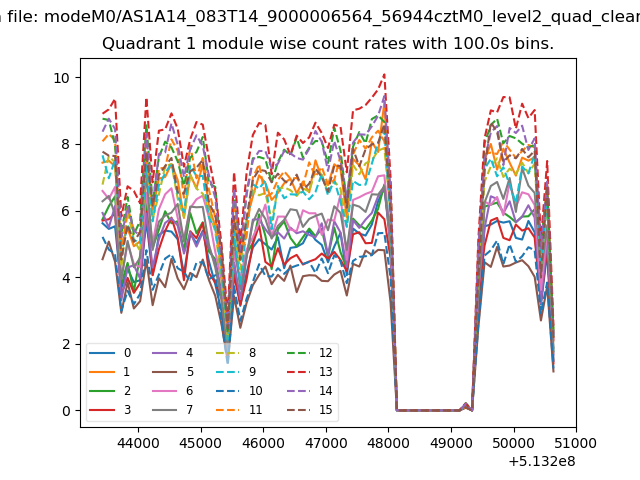
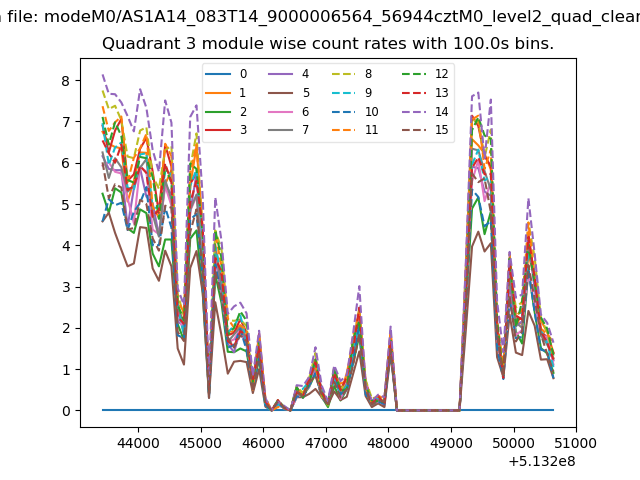
| Module-wise count rates for Quadrant A Data is divided into 100 sec bins |
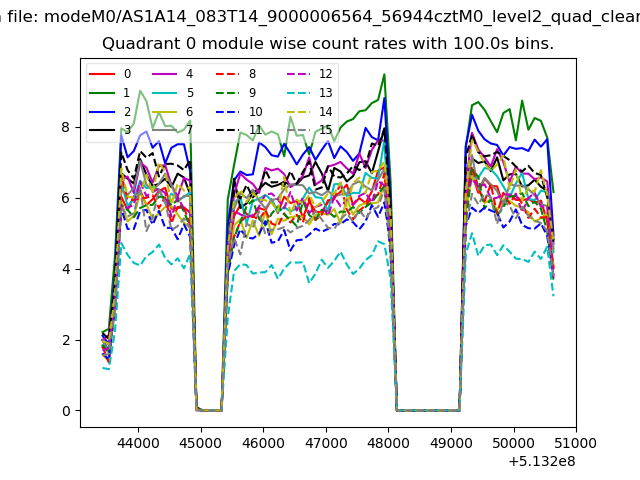 |
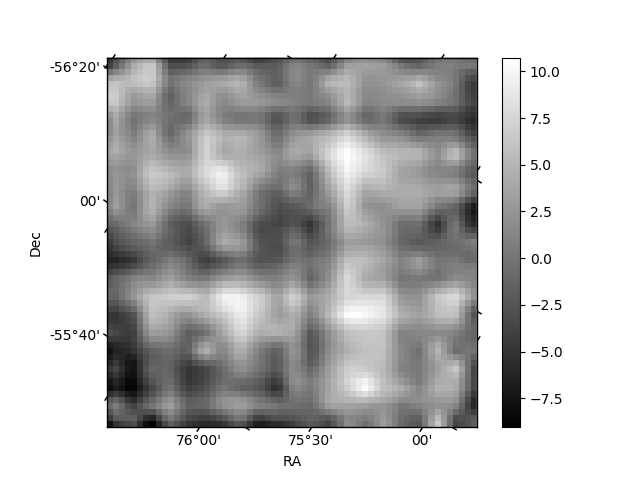 |
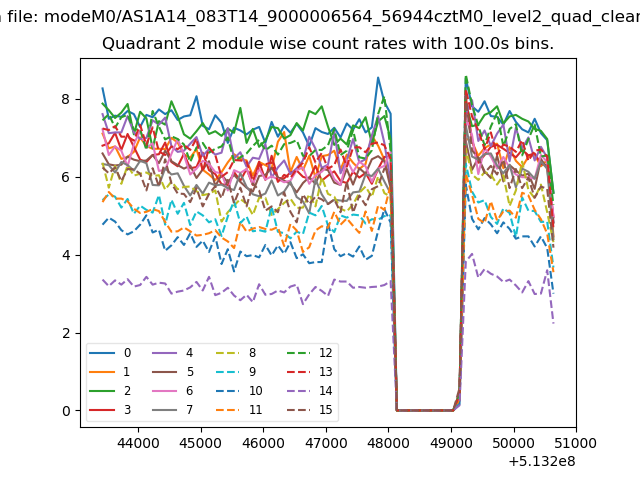
| Module-wise count rates for Quadrant B Data is divided into 100 sec bins |
 |
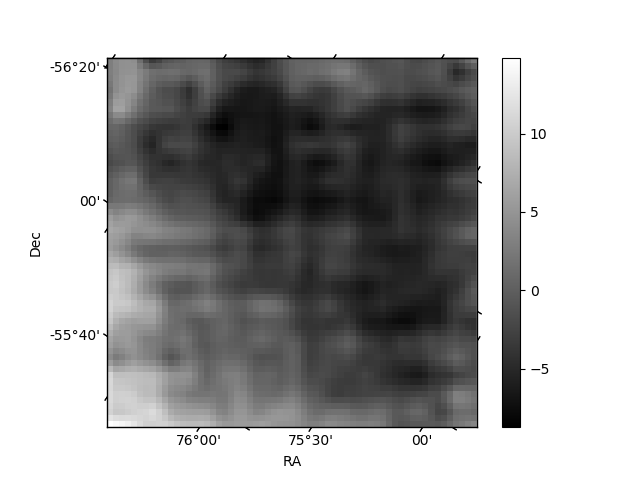 |
| Module-wise count rates for Quadrant C Data is divided into 100 sec bins |
 |
 |
| Module-wise count rates for Quadrant D Data is divided into 100 sec bins |
 |
 |
| Parameter | Plot |
|---|---|
| CZT HV Monitor | 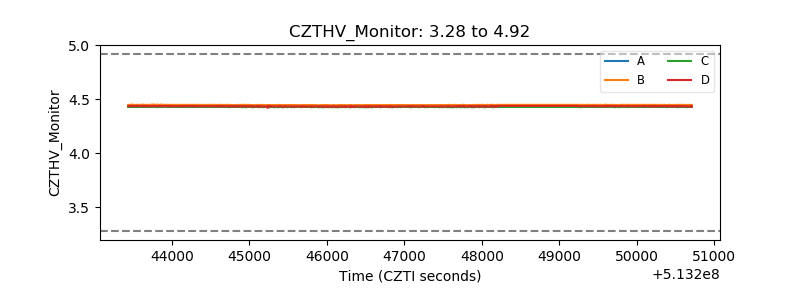 |
| D_VDD | 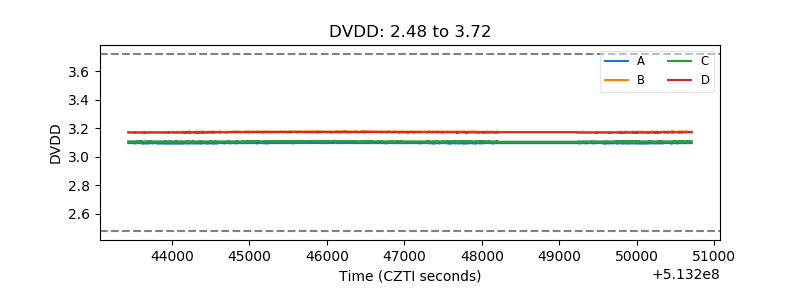 |
| Temperature 1 | 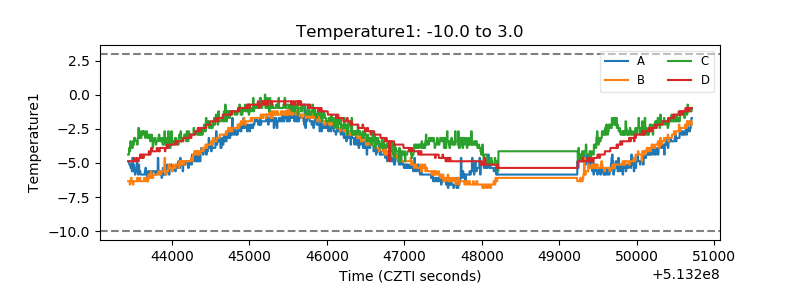 |
| Veto HV Monitor |  |
| Veto LLD | 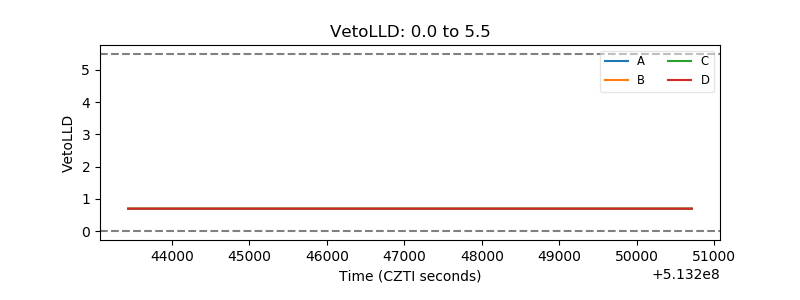 |
| Alpha Counter | 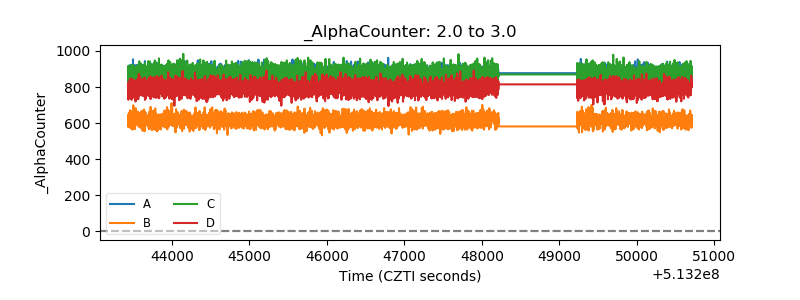 |
| _CPM_Rate | 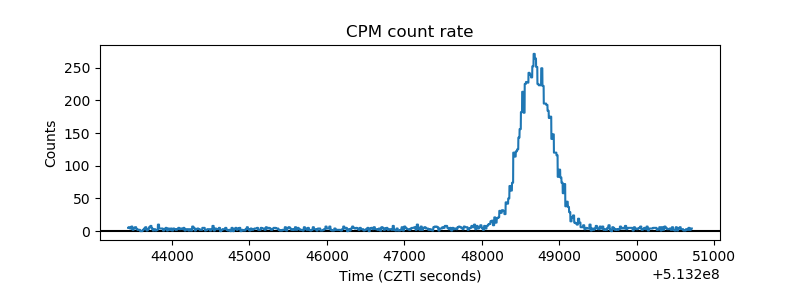 |
| CZT Counter | 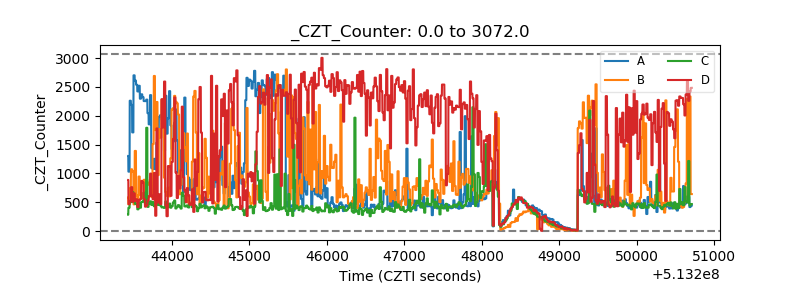 |
| +2.5 Volts monitor |  |
| +5 Volts monitor | 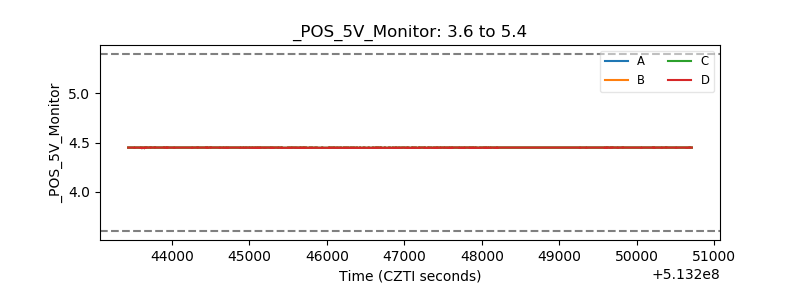 |
| _ROLL_ROT | 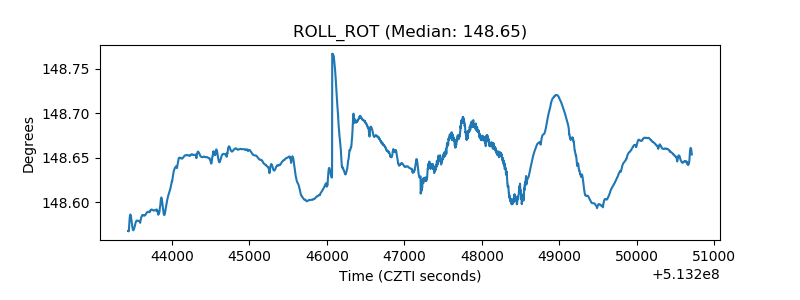 |
| _Roll_DEC | 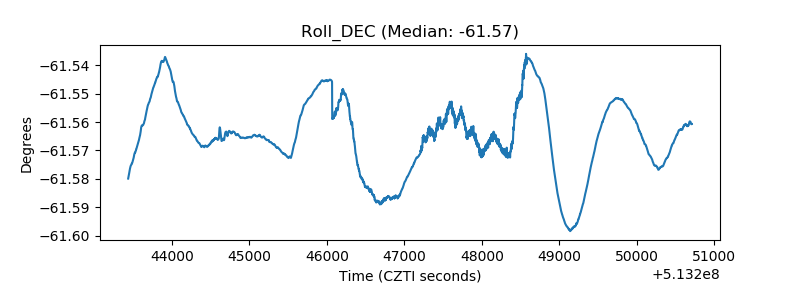 |
| _Roll_RA | 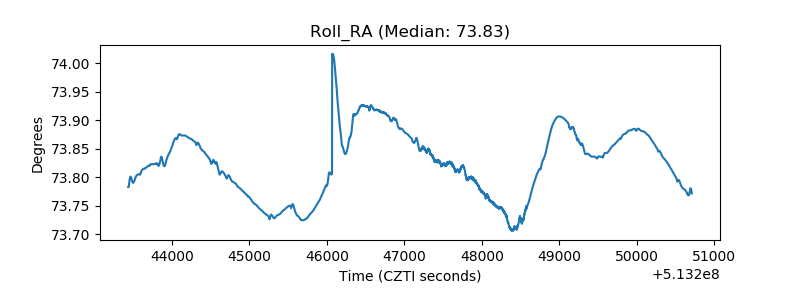 |
| Veto Counter | 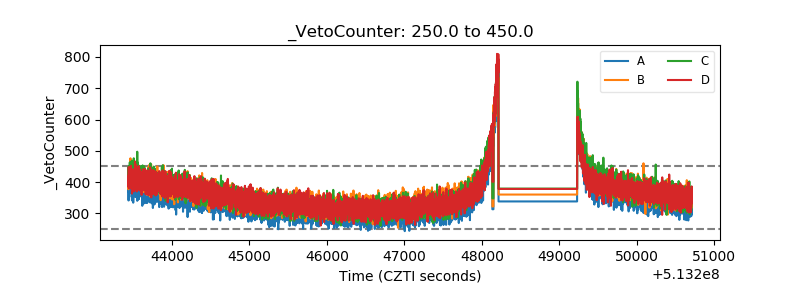 |