| Param | Original file | Final file |
|---|---|---|
| Filename | modeM0/AS1A14_083T14_9000006564_56945cztM0_level2.fits | modeM0/AS1A14_083T14_9000006564_56945cztM0_level2_quad_clean.evt |
| Size (bytes) | 813,810,240 | 79,125,120 |
| Size | 776.1 MB | 75.5 MB |
| Events in quadrant A | 5,680,473 | 604,635 |
| Events in quadrant B | 7,539,924 | 586,834 |
| Events in quadrant C | 3,326,280 | 623,242 |
| Events in quadrant D | 13,048,952 | 106,260 |
| Mode SS | |||
|---|---|---|---|
| Quadrant | BADHDUFLAG | Total packets | Discarded packets |
| A | 0 | 138 | 0 |
| B | 0 | 138 | 0 |
| C | 0 | 138 | 0 |
| D | 0 | 138 | 0 |
| Mode M9 | |||
|---|---|---|---|
| Quadrant | BADHDUFLAG | Total packets | Discarded packets |
| A | 0 | 8 | 0 |
| B | 0 | 8 | 0 |
| C | 0 | 8 | 0 |
| D | 0 | 8 | 0 |
| Mode M0 | |||
|---|---|---|---|
| Quadrant | BADHDUFLAG | Total packets | Discarded packets |
| A | 0 | 21610 | 1 |
| B | 0 | 27064 | 1 |
| C | 0 | 15031 | 2 |
| D | 0 | 43454 | 1 |
| Quadrant | Total seconds | Saturated seconds | Saturation percentage |
|---|---|---|---|
| A | 6807 | 645 | 9.475540% |
| B | 6807 | 1417 | 20.816806% |
| C | 6807 | 108 | 1.586602% |
| D | 6807 | 5853 | 85.985015% |
Noise dominated data is calculated using 1-second bins in cleaned event files. If a bin has >2000 counts, and if more than 50% of those come from <1% of pixels, then it is considered to be noise-dominated and hence unusable.
| Quadrant | # 1 sec bins | Bins with >0 counts | Bins with >2000 counts | High rate bins dominated by noise | Noise dominated (total time) | Noise dominated (detector-on time) | Marked lightcurve |
|---|---|---|---|---|---|---|---|
| A | 7616 | 6807 | 508 | 508 | 6.67% | 7.46% | 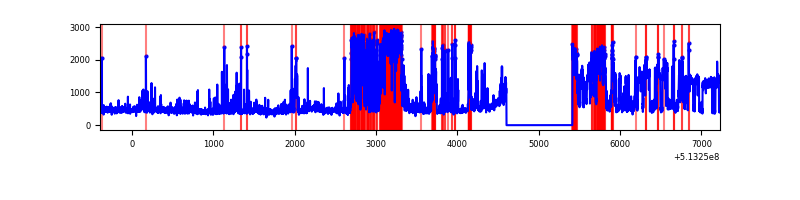 |
| B | 7616 | 6806 | 1037 | 1037 | 13.62% | 15.24% | 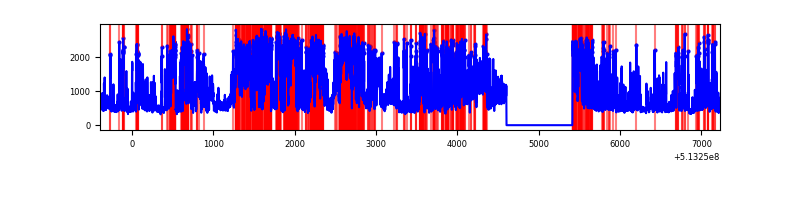 |
| C | 7616 | 6806 | 40 | 40 | 0.53% | 0.59% | 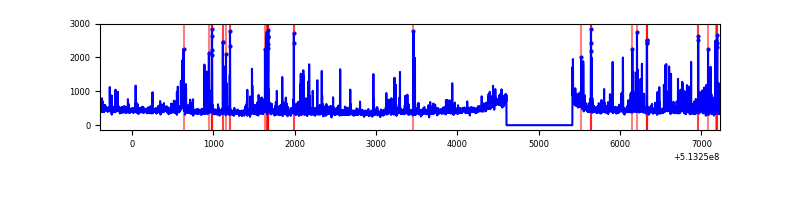 |
| D | 7616 | 6806 | 3479 | 3479 | 45.68% | 51.12% | 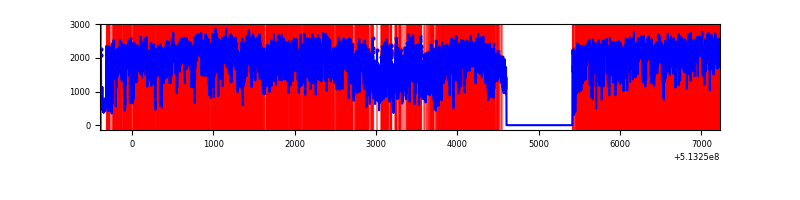 |
Top three noisy pixels from each quadrant. If the there are fewer than three noisy pixels in the level2.evt file, extra rows are filled as -1
| Pixel properties | Quadrant properties | ||||||
|---|---|---|---|---|---|---|---|
| Quadrant | DetID | PixID | Counts | Sigma | Mean | Median | Sigma |
| A | 7 | 64 | 1265580 | 7300.59 | 707 | 688 | 173.3 |
| A | 11 | 31 | 783369 | 4517.41 | 707 | 688 | 173.3 |
| A | 4 | 249 | 541161 | 3119.45 | 707 | 688 | 173.3 |
| B | 5 | 172 | 3910940 | 27693.45 | 665 | 640 | 141.2 |
| B | 4 | 156 | 415057 | 2934.98 | 665 | 640 | 141.2 |
| B | 10 | 16 | 251419 | 1776.06 | 665 | 640 | 141.2 |
| C | 13 | 3 | 171288 | 883.39 | 706 | 699 | 193.1 |
| C | 14 | 254 | 134454 | 692.65 | 706 | 699 | 193.1 |
| C | 12 | 249 | 85995 | 441.7 | 706 | 699 | 193.1 |
| D | 12 | 33 | 10446533 | 93555.42 | 388 | 370 | 111.7 |
| D | 8 | 240 | 222162 | 1986.36 | 388 | 370 | 111.7 |
| D | 12 | 1 | 194107 | 1735.1 | 388 | 370 | 111.7 |
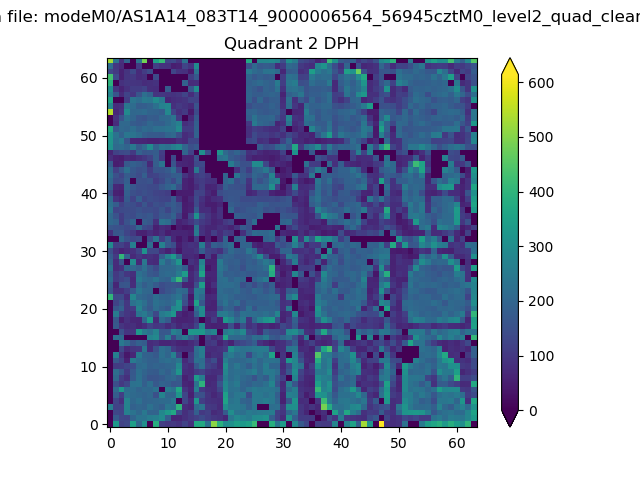
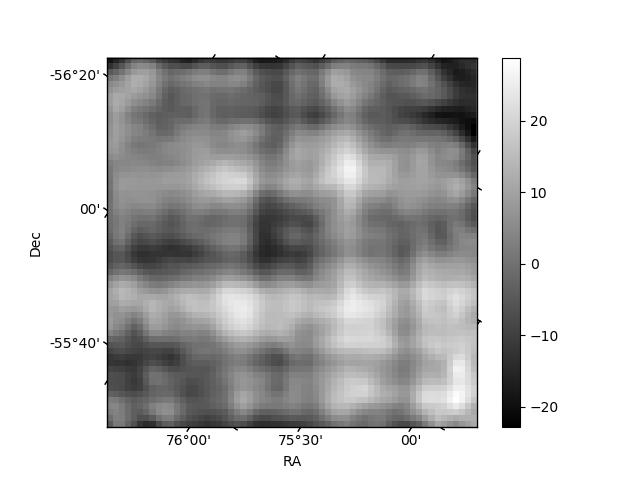
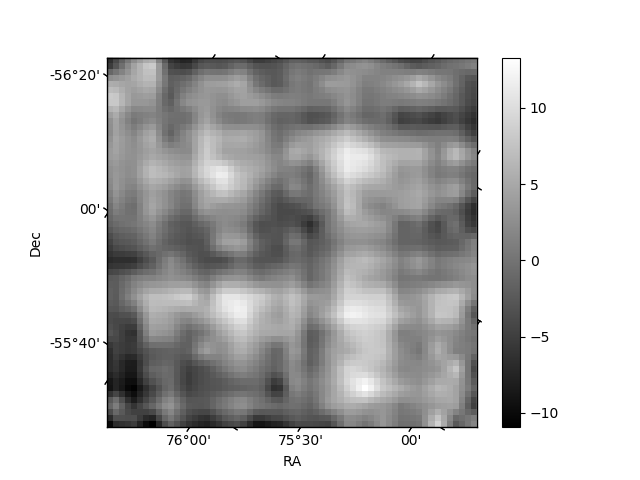
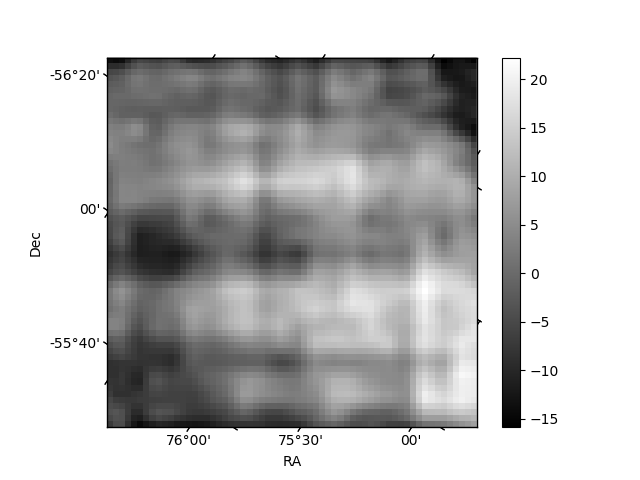
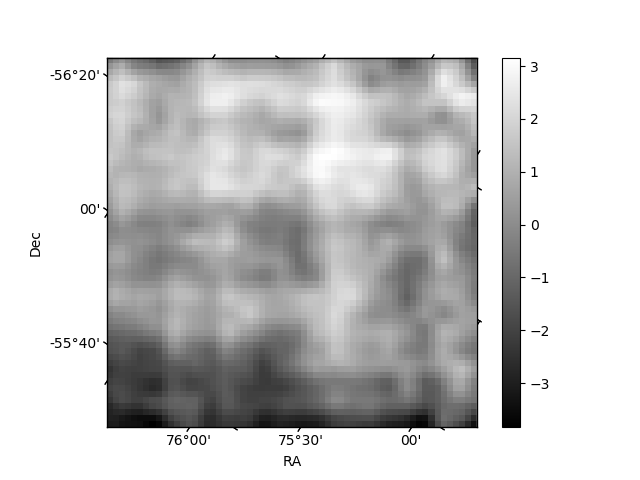
Histogram calculated using DETX and DETY for each event in the final _common_clean file
| Quadrant A | 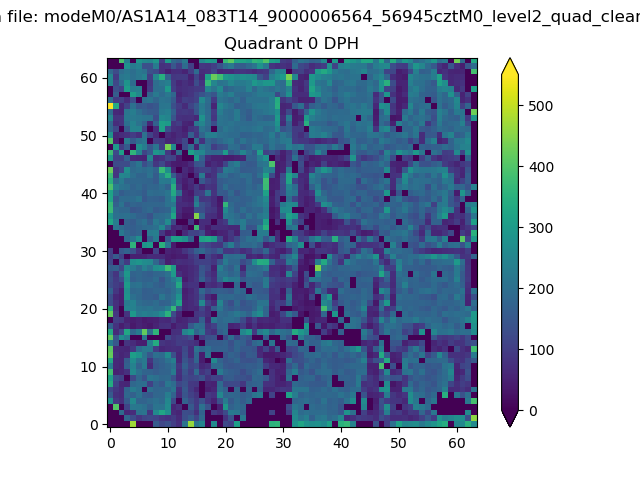 |
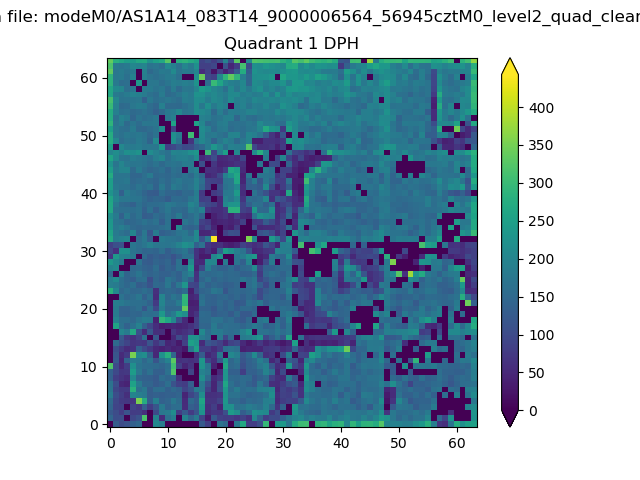 |
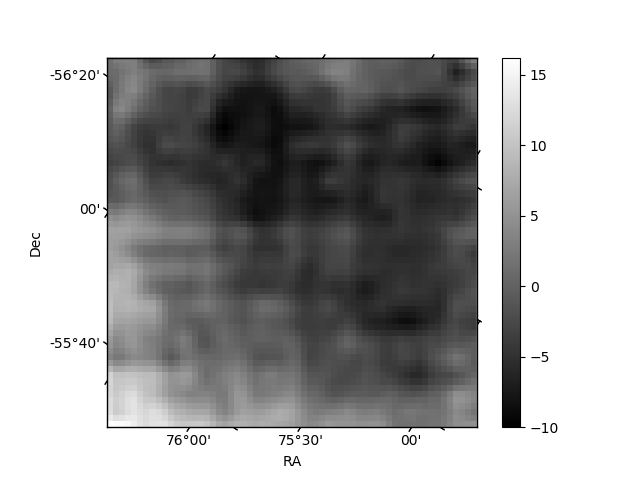
Quadrant B |
|---|---|---|---|
| Quadrant D | 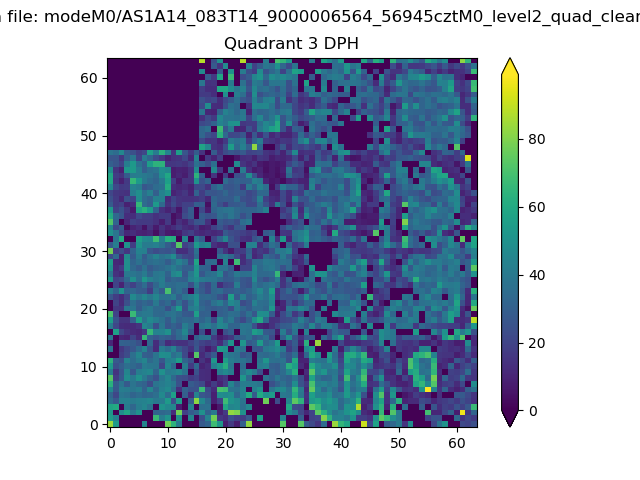 |
 |
Quadrant C |
| Plot type | Count rate plots | Images |
|---|---|---|
| Comparison with Poisson distribution Blue bars denote a histogram of data divided into 1 sec bins. Red curve is a Poisson curve with rate = median count rate of data. |
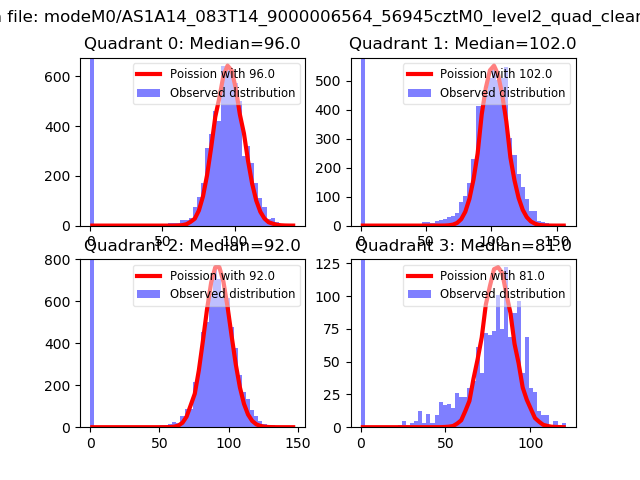 |
 |
| Quadrant-wise count rates Data is divided into 100 sec bins |
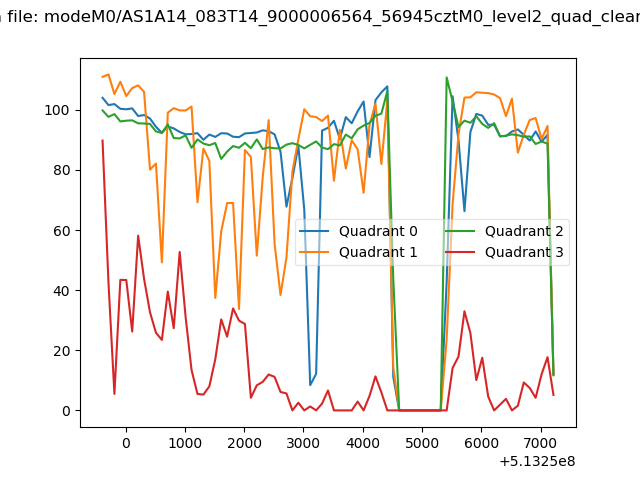 |
|
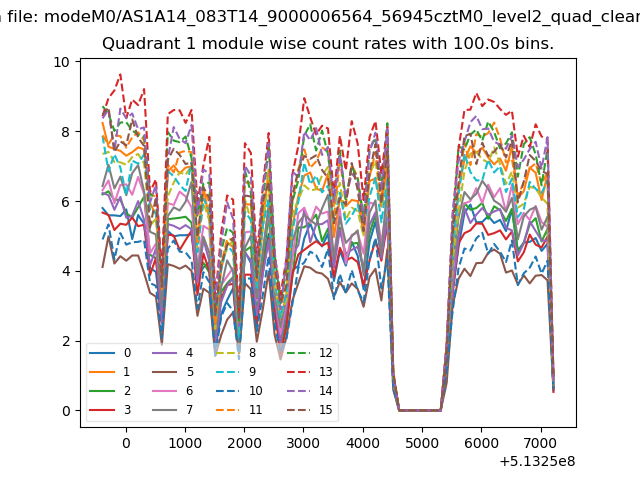
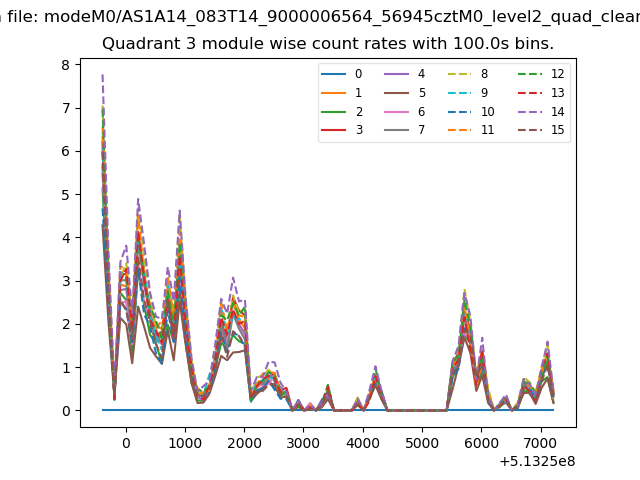
| Module-wise count rates for Quadrant A Data is divided into 100 sec bins |
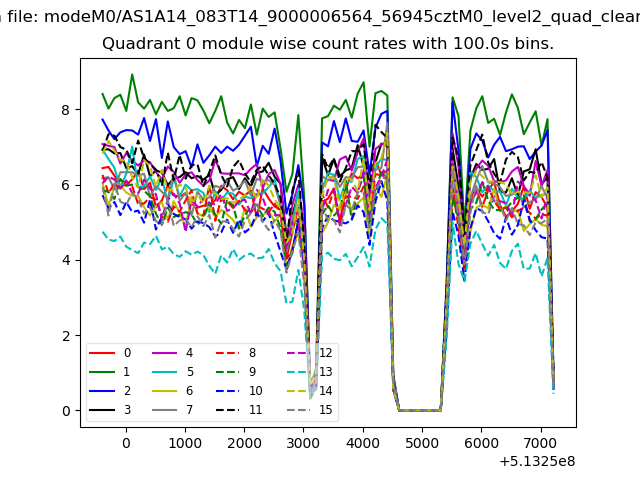 |
 |
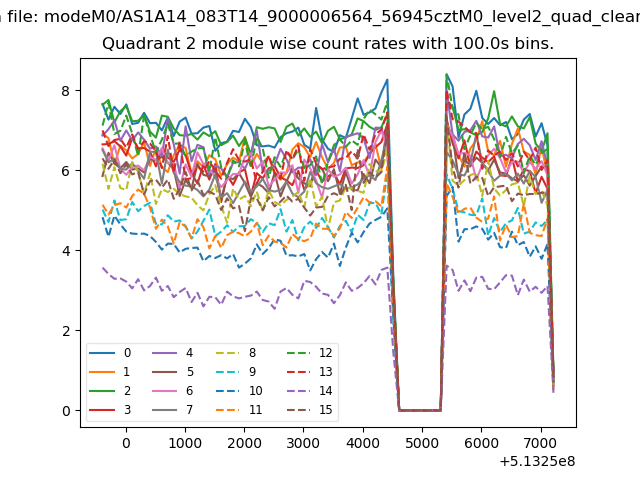
| Module-wise count rates for Quadrant B Data is divided into 100 sec bins |
 |
 |
| Module-wise count rates for Quadrant C Data is divided into 100 sec bins |
 |
 |
| Module-wise count rates for Quadrant D Data is divided into 100 sec bins |
 |
 |
| Parameter | Plot |
|---|---|
| CZT HV Monitor | 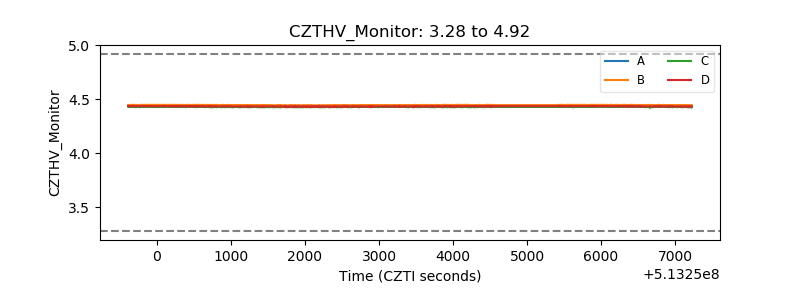 |
| D_VDD | 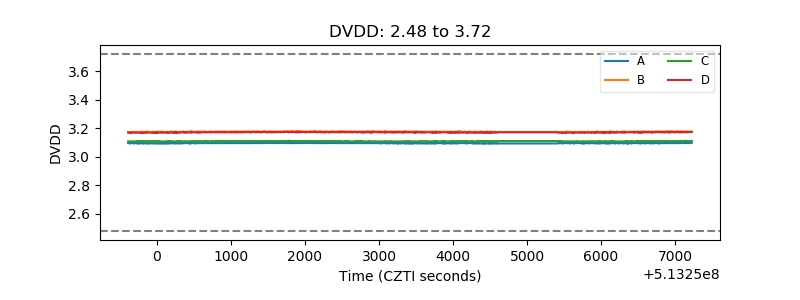 |
| Temperature 1 | 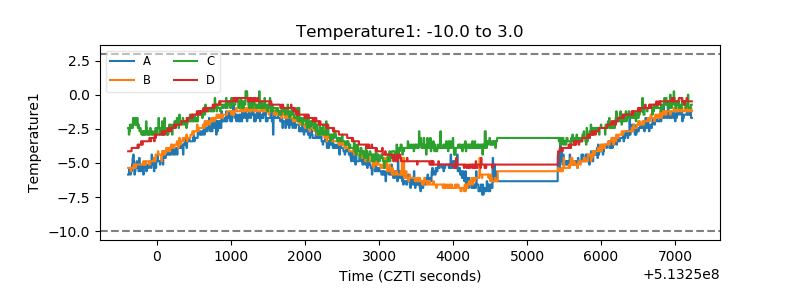 |
| Veto HV Monitor | 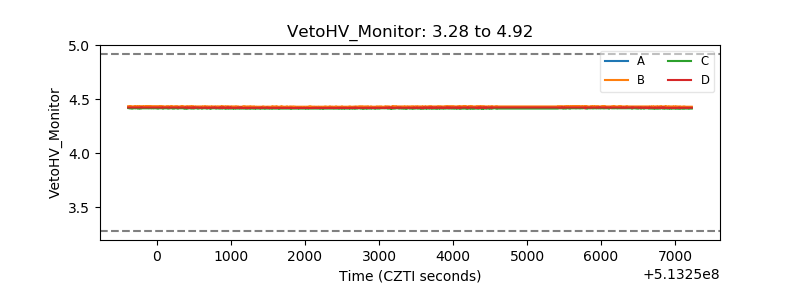 |
| Veto LLD | 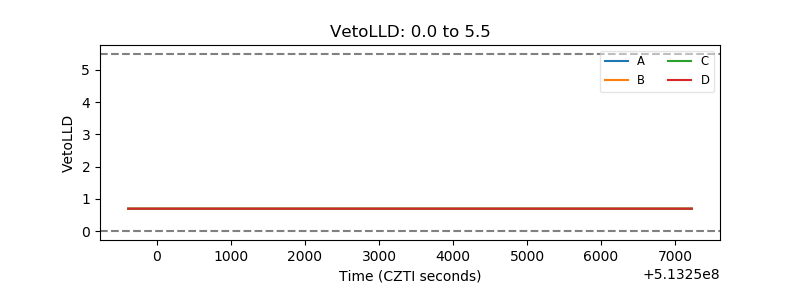 |
| Alpha Counter | 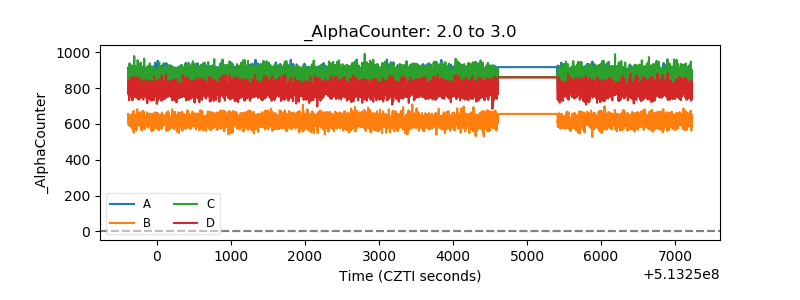 |
| _CPM_Rate | 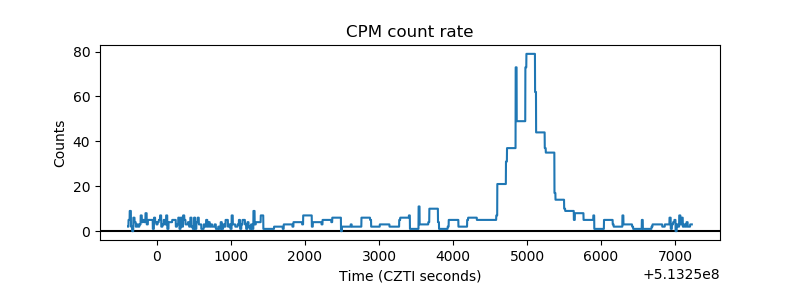 |
| CZT Counter | 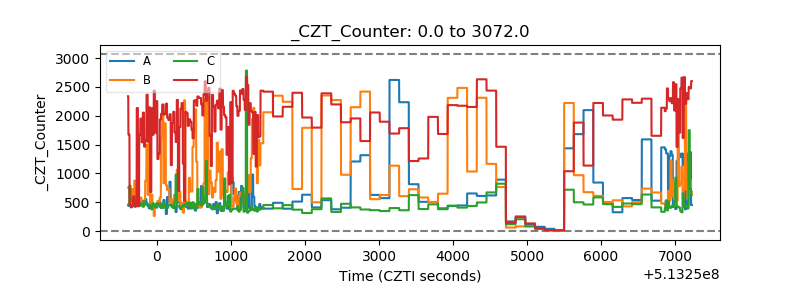 |
| +2.5 Volts monitor |  |
| +5 Volts monitor | 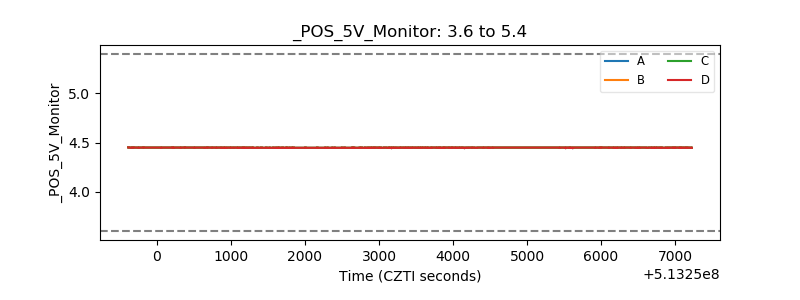 |
| _ROLL_ROT | 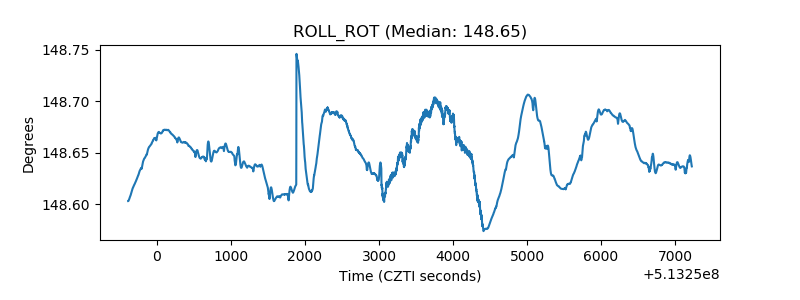 |
| _Roll_DEC | 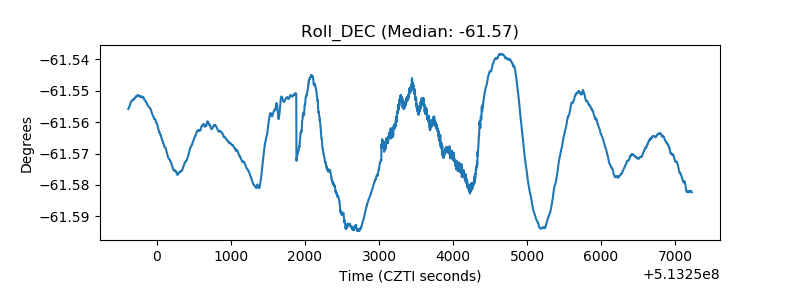 |
| _Roll_RA | 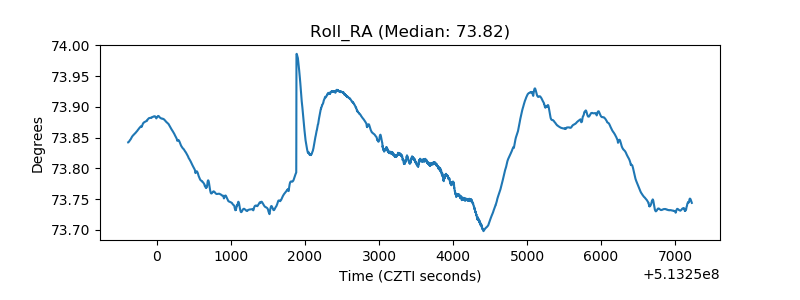 |
| Veto Counter | 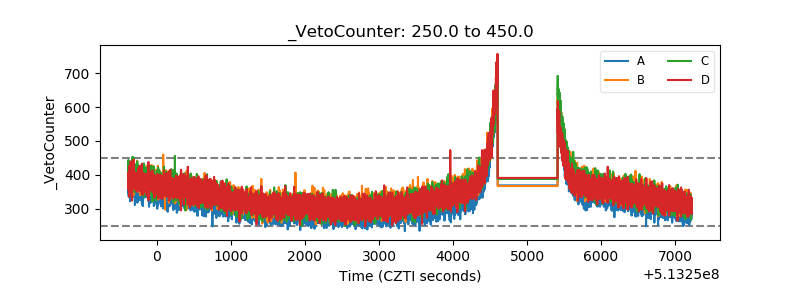 |