| Param | Original file | Final file |
|---|---|---|
| Filename | modeM0/AS1A14_083T14_9000006564_57031cztM0_level2.fits | modeM0/AS1A14_083T14_9000006564_57031cztM0_level2_quad_clean.evt |
| Size (bytes) | 398,448,000 | 91,586,880 |
| Size | 380.0 MB | 87.3 MB |
| Events in quadrant A | 5,236,018 | 584,334 |
| Events in quadrant B | 2,898,431 | 649,562 |
| Events in quadrant C | 2,951,305 | 578,658 |
| Events in quadrant D | 3,192,571 | 537,936 |
| Mode SS | |||
|---|---|---|---|
| Quadrant | BADHDUFLAG | Total packets | Discarded packets |
| A | 0 | 124 | 0 |
| B | 0 | 124 | 0 |
| C | 0 | 124 | 0 |
| D | 0 | 124 | 0 |
| Mode M9 | |||
|---|---|---|---|
| Quadrant | BADHDUFLAG | Total packets | Discarded packets |
| A | 0 | 11 | 0 |
| B | 0 | 11 | 0 |
| C | 0 | 11 | 0 |
| D | 0 | 11 | 0 |
| Mode M0 | |||
|---|---|---|---|
| Quadrant | BADHDUFLAG | Total packets | Discarded packets |
| A | 0 | 19738 | 1 |
| B | 0 | 12775 | 1 |
| C | 0 | 13165 | 1 |
| D | 0 | 13708 | 1 |
| Quadrant | Total seconds | Saturated seconds | Saturation percentage |
|---|---|---|---|
| A | 6053 | 296 | 4.890137% |
| B | 6053 | 128 | 2.114654% |
| C | 6053 | 120 | 1.982488% |
| D | 6052 | 145 | 2.395902% |
Noise dominated data is calculated using 1-second bins in cleaned event files. If a bin has >2000 counts, and if more than 50% of those come from <1% of pixels, then it is considered to be noise-dominated and hence unusable.
| Quadrant | # 1 sec bins | Bins with >0 counts | Bins with >2000 counts | High rate bins dominated by noise | Noise dominated (total time) | Noise dominated (detector-on time) | Marked lightcurve |
|---|---|---|---|---|---|---|---|
| A | 7173 | 6054 | 192 | 192 | 2.68% | 3.17% | 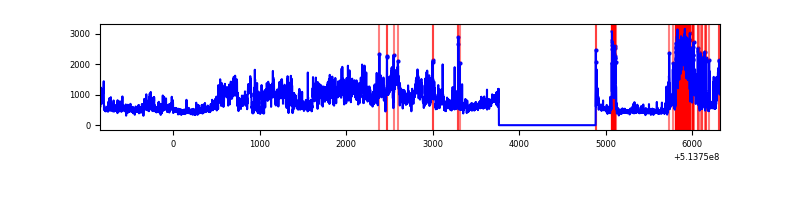 |
| B | 7173 | 6054 | 20 | 20 | 0.28% | 0.33% | 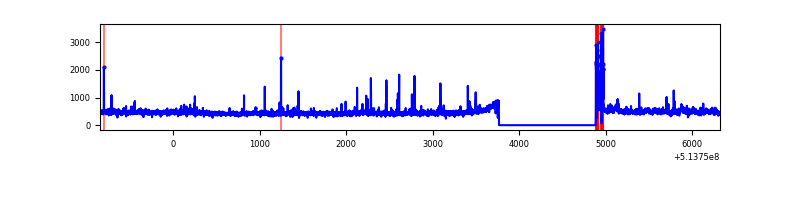 |
| C | 7173 | 6054 | 43 | 43 | 0.60% | 0.71% | 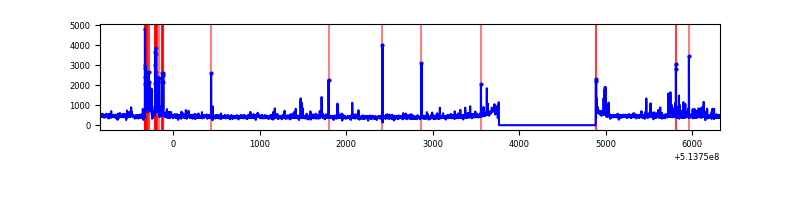 |
| D | 7172 | 6053 | 76 | 76 | 1.06% | 1.26% | 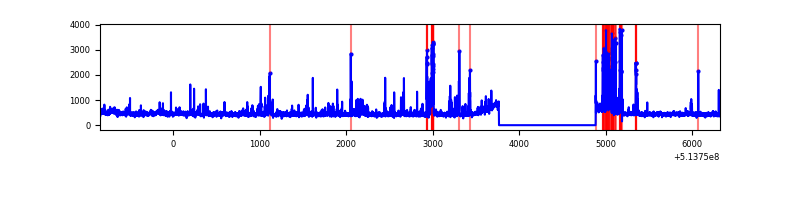 |
Top three noisy pixels from each quadrant. If the there are fewer than three noisy pixels in the level2.evt file, extra rows are filled as -1
| Pixel properties | Quadrant properties | ||||||
|---|---|---|---|---|---|---|---|
| Quadrant | DetID | PixID | Counts | Sigma | Mean | Median | Sigma |
| A | 3 | 14 | 2525109 | 15456.93 | 661 | 645 | 163.3 |
| A | 4 | 207 | 76401 | 463.84 | 661 | 645 | 163.3 |
| A | 8 | 6 | 18885 | 111.68 | 661 | 645 | 163.3 |
| B | 10 | 16 | 78688 | 552.08 | 662 | 638 | 141.4 |
| B | 0 | 63 | 78586 | 551.36 | 662 | 638 | 141.4 |
| B | 0 | 245 | 27819 | 192.26 | 662 | 638 | 141.4 |
| C | 12 | 252 | 161885 | 909.76 | 655 | 647 | 177.2 |
| C | 6 | 223 | 69206 | 386.83 | 655 | 647 | 177.2 |
| C | 14 | 254 | 43716 | 243.01 | 655 | 647 | 177.2 |
| D | 8 | 240 | 244625 | 1344.67 | 648 | 619 | 181.5 |
| D | 12 | 251 | 139106 | 763.18 | 648 | 619 | 181.5 |
| D | 2 | 249 | 68720 | 375.29 | 648 | 619 | 181.5 |
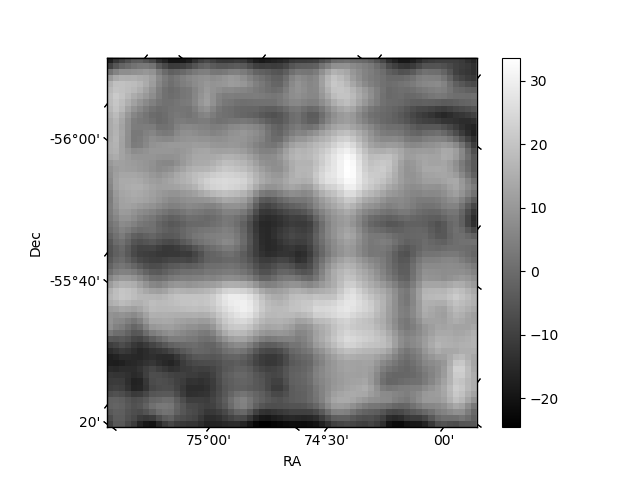
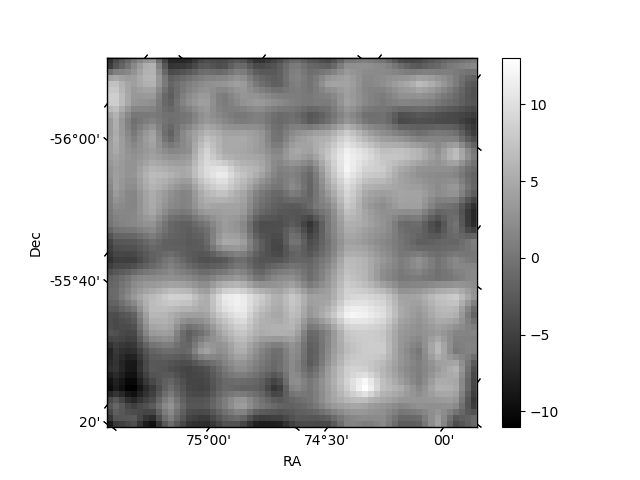
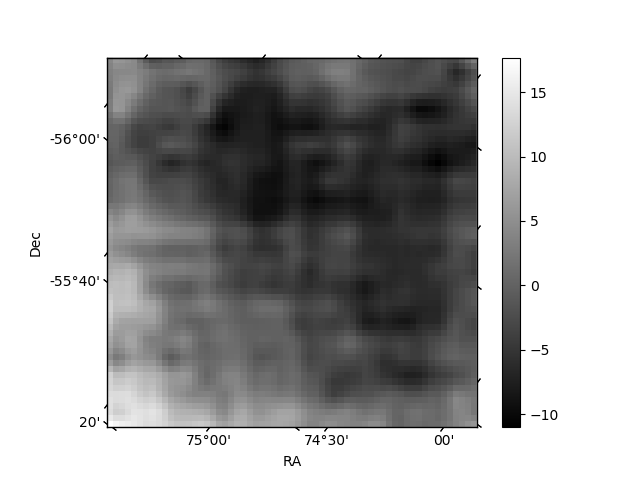
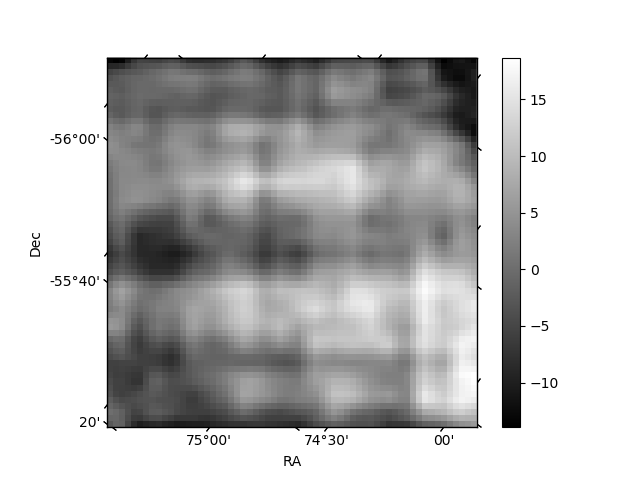
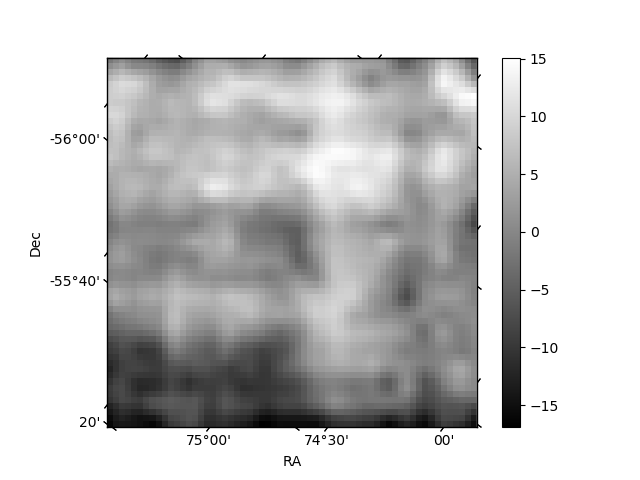
Histogram calculated using DETX and DETY for each event in the final _common_clean file
| Quadrant A | 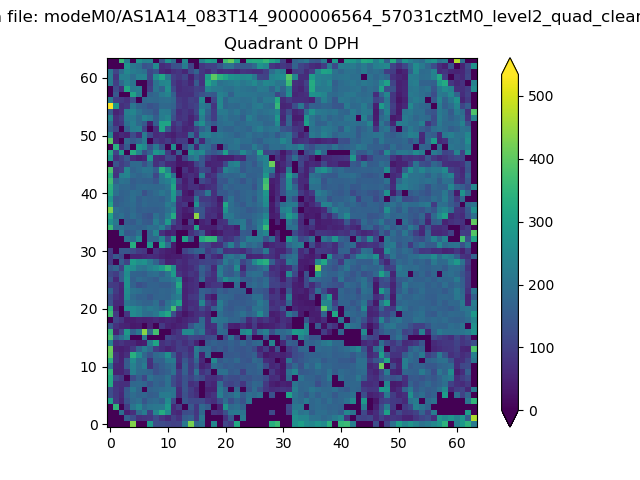 |
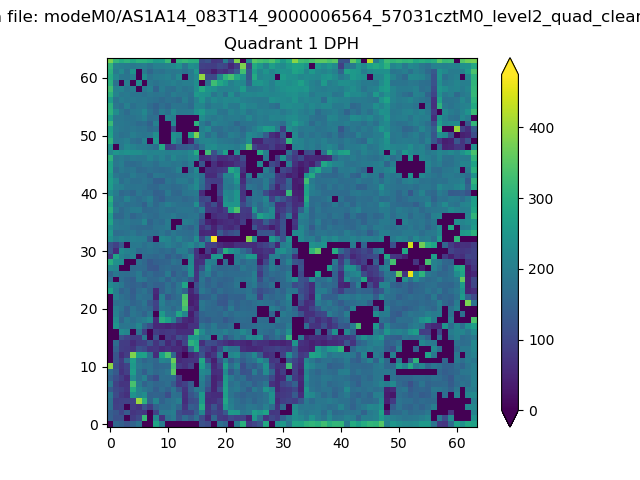 |
Quadrant B |
|---|---|---|---|
| Quadrant D | 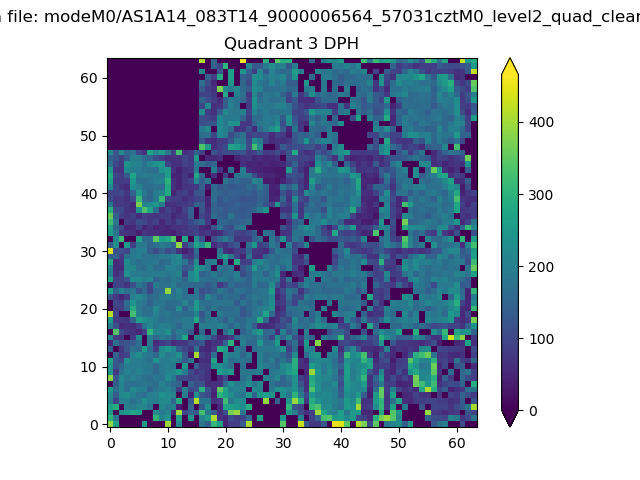 |
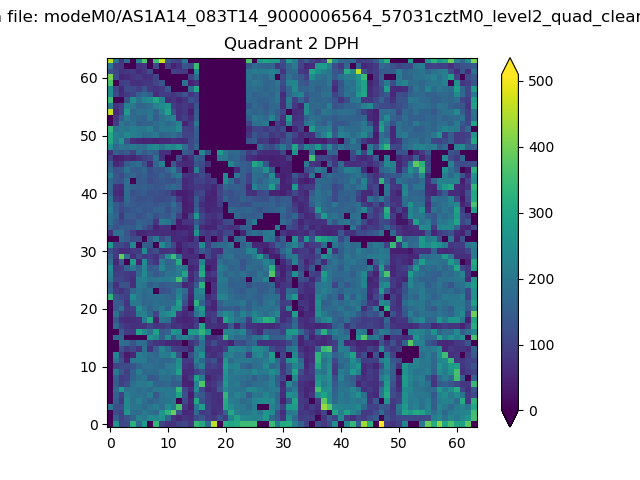 |
Quadrant C |
| Plot type | Count rate plots | Images |
|---|---|---|
| Comparison with Poisson distribution Blue bars denote a histogram of data divided into 1 sec bins. Red curve is a Poisson curve with rate = median count rate of data. |
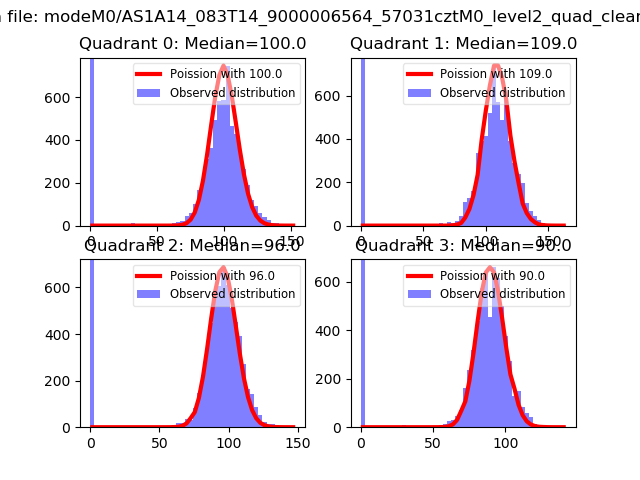 |
 |
| Quadrant-wise count rates Data is divided into 100 sec bins |
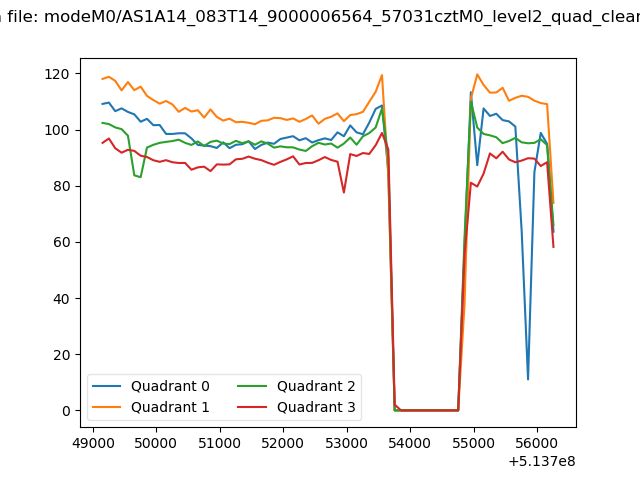 |
|
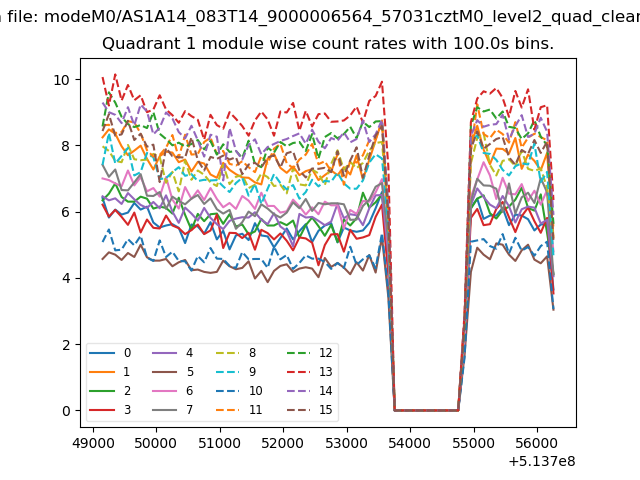
| Module-wise count rates for Quadrant A Data is divided into 100 sec bins |
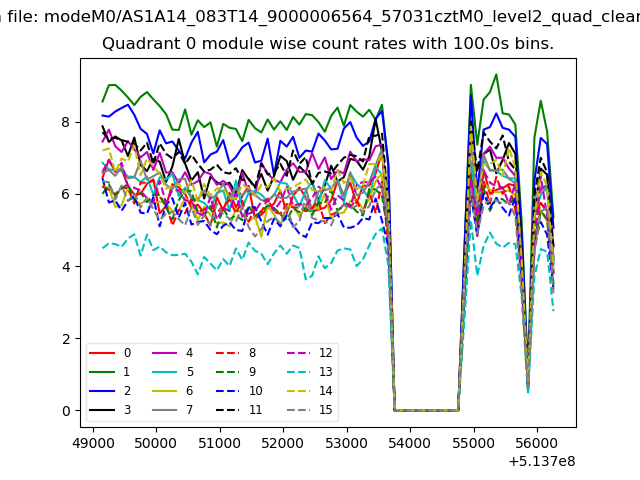 |
 |
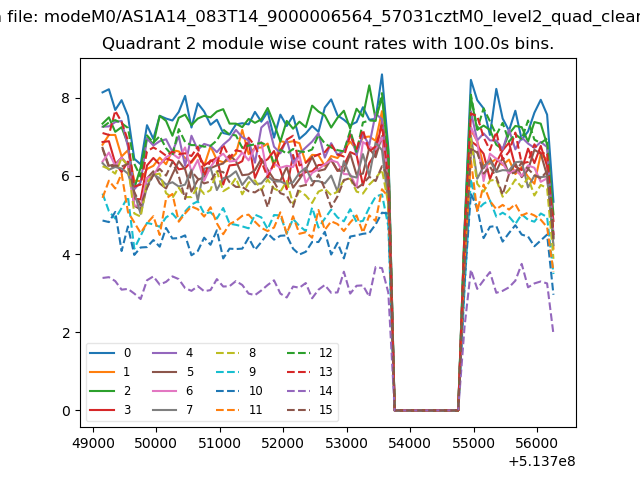
| Module-wise count rates for Quadrant B Data is divided into 100 sec bins |
 |
 |
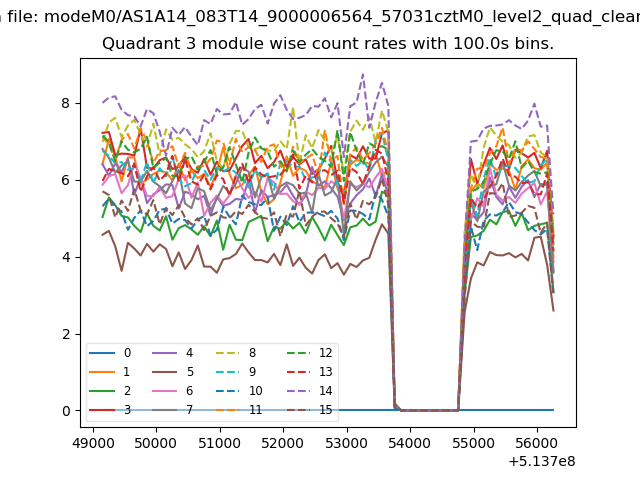
| Module-wise count rates for Quadrant C Data is divided into 100 sec bins |
 |
 |
| Module-wise count rates for Quadrant D Data is divided into 100 sec bins |
 |
 |
| Parameter | Plot |
|---|---|
| CZT HV Monitor | 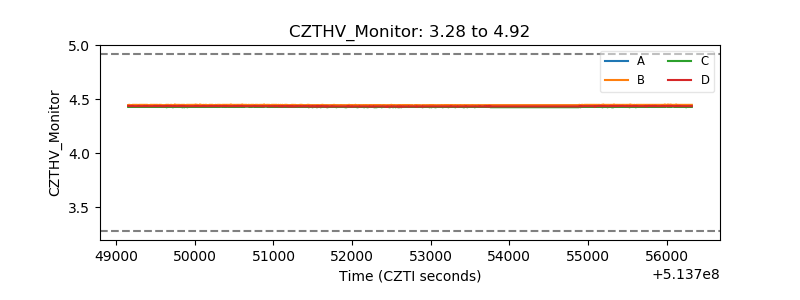 |
| D_VDD | 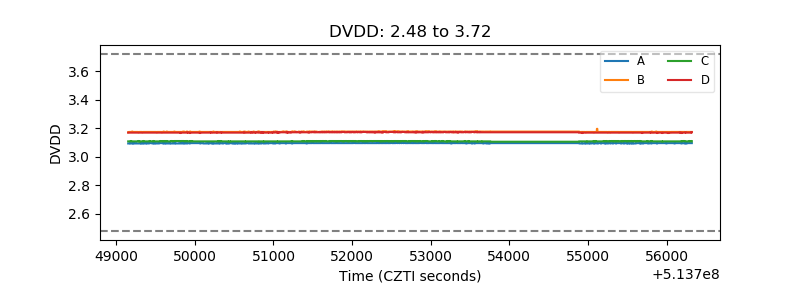 |
| Temperature 1 | 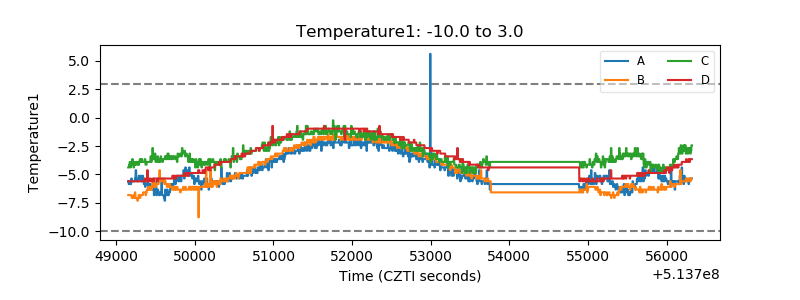 |
| Veto HV Monitor | 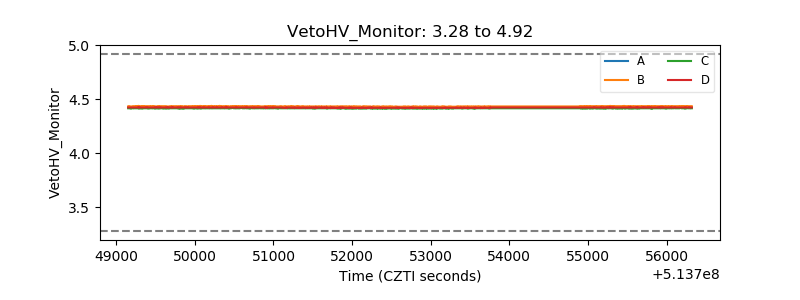 |
| Veto LLD | 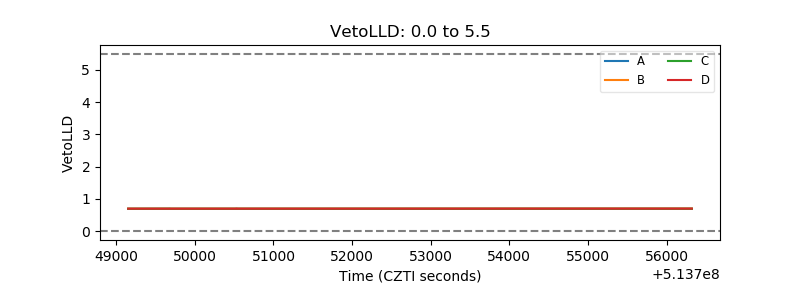 |
| Alpha Counter | 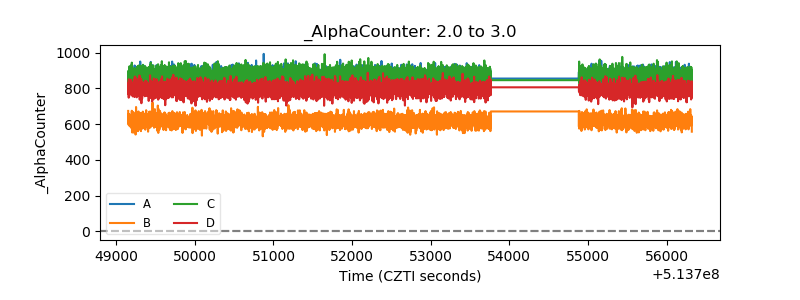 |
| _CPM_Rate | 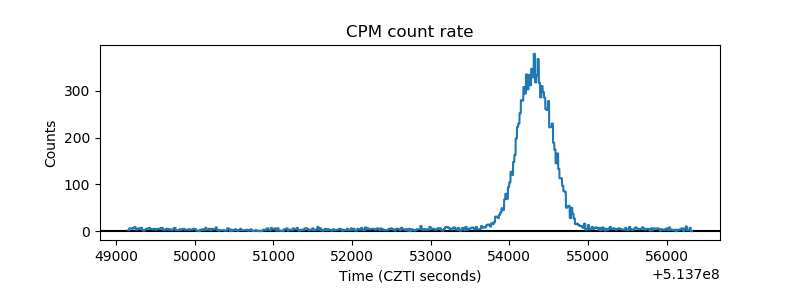 |
| CZT Counter | 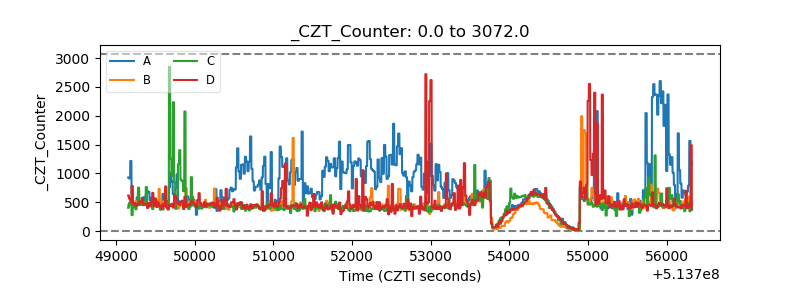 |
| +2.5 Volts monitor |  |
| +5 Volts monitor |  |
| _ROLL_ROT | 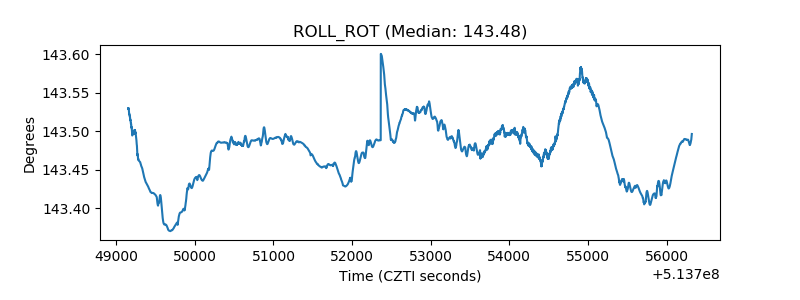 |
| _Roll_DEC | 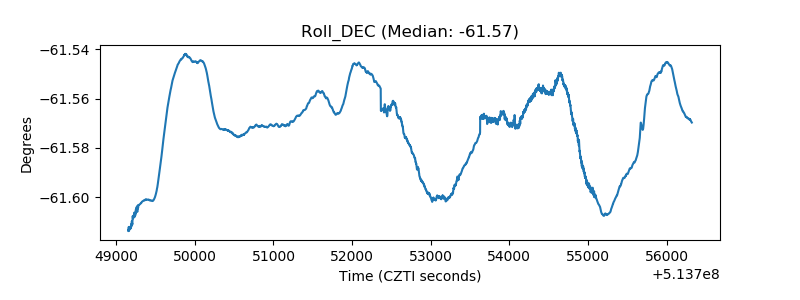 |
| _Roll_RA | 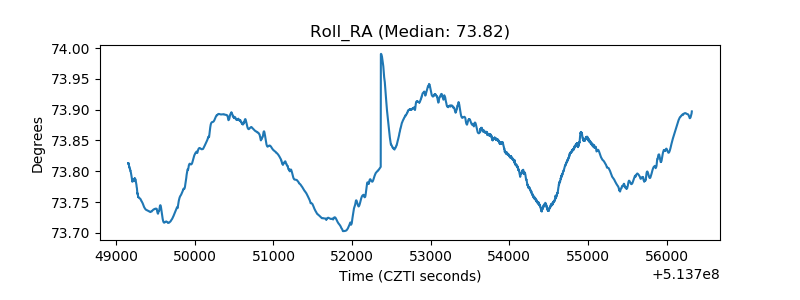 |
| Veto Counter | 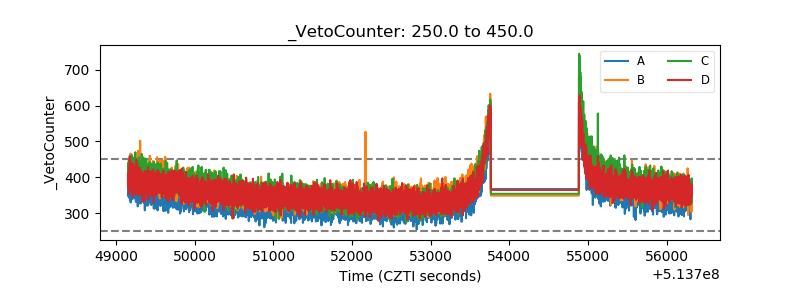 |