| Param | Original file | Final file |
|---|---|---|
| Filename | modeM0/AS1A14_083T14_9000006564_57032cztM0_level2.fits | modeM0/AS1A14_083T14_9000006564_57032cztM0_level2_quad_clean.evt |
| Size (bytes) | 489,240,000 | 86,077,440 |
| Size | 466.6 MB | 82.1 MB |
| Events in quadrant A | 7,687,313 | 480,620 |
| Events in quadrant B | 2,847,384 | 636,269 |
| Events in quadrant C | 3,757,928 | 545,063 |
| Events in quadrant D | 3,344,011 | 519,693 |
| Mode SS | |||
|---|---|---|---|
| Quadrant | BADHDUFLAG | Total packets | Discarded packets |
| A | 0 | 122 | 0 |
| B | 0 | 122 | 0 |
| C | 0 | 122 | 0 |
| D | 0 | 122 | 0 |
| Mode M9 | |||
|---|---|---|---|
| Quadrant | BADHDUFLAG | Total packets | Discarded packets |
| A | 0 | 10 | 0 |
| B | 0 | 10 | 0 |
| C | 0 | 10 | 0 |
| D | 0 | 10 | 0 |
| Mode M0 | |||
|---|---|---|---|
| Quadrant | BADHDUFLAG | Total packets | Discarded packets |
| A | 0 | 27026 | 1 |
| B | 0 | 12733 | 1 |
| C | 0 | 15473 | 1 |
| D | 0 | 14237 | 1 |
| Quadrant | Total seconds | Saturated seconds | Saturation percentage |
|---|---|---|---|
| A | 6087 | 1417 | 23.279119% |
| B | 6088 | 125 | 2.053219% |
| C | 6088 | 358 | 5.880420% |
| D | 6088 | 187 | 3.071616% |
Noise dominated data is calculated using 1-second bins in cleaned event files. If a bin has >2000 counts, and if more than 50% of those come from <1% of pixels, then it is considered to be noise-dominated and hence unusable.
| Quadrant | # 1 sec bins | Bins with >0 counts | Bins with >2000 counts | High rate bins dominated by noise | Noise dominated (total time) | Noise dominated (detector-on time) | Marked lightcurve |
|---|---|---|---|---|---|---|---|
| A | 7012 | 6088 | 1250 | 1250 | 17.83% | 20.53% |  |
| B | 7013 | 6089 | 10 | 10 | 0.14% | 0.16% | 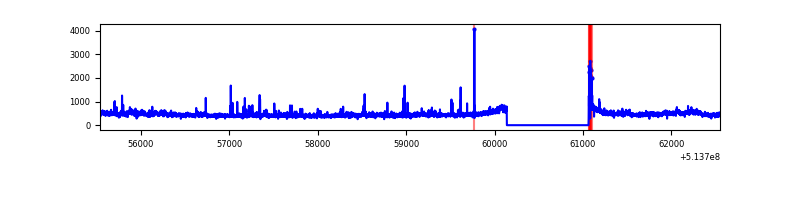 |
| C | 7013 | 6089 | 274 | 274 | 3.91% | 4.50% | 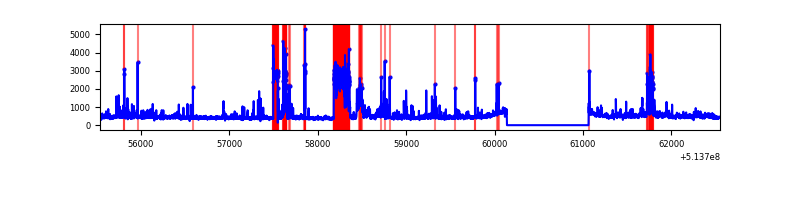 |
| D | 7013 | 6089 | 102 | 102 | 1.45% | 1.68% | 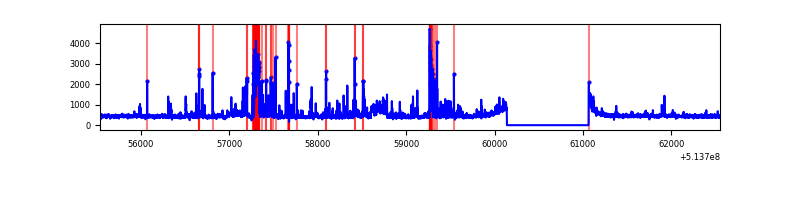 |
Top three noisy pixels from each quadrant. If the there are fewer than three noisy pixels in the level2.evt file, extra rows are filled as -1
| Pixel properties | Quadrant properties | ||||||
|---|---|---|---|---|---|---|---|
| Quadrant | DetID | PixID | Counts | Sigma | Mean | Median | Sigma |
| A | 3 | 14 | 5067411 | 33207.04 | 622 | 608 | 152.6 |
| A | 4 | 207 | 100553 | 655.02 | 622 | 608 | 152.6 |
| A | 3 | 245 | 39929 | 257.7 | 622 | 608 | 152.6 |
| B | 0 | 63 | 128409 | 917.09 | 656 | 631 | 139.3 |
| B | 10 | 16 | 38813 | 274.04 | 656 | 631 | 139.3 |
| B | 12 | 111 | 16843 | 116.36 | 656 | 631 | 139.3 |
| C | 12 | 252 | 756621 | 4366.83 | 636 | 630 | 173.1 |
| C | 12 | 249 | 141161 | 811.75 | 636 | 630 | 173.1 |
| C | 13 | 23 | 124368 | 714.75 | 636 | 630 | 173.1 |
| D | 12 | 251 | 232019 | 1285.45 | 641 | 613 | 180.0 |
| D | 2 | 249 | 217188 | 1203.06 | 641 | 613 | 180.0 |
| D | 3 | 12 | 137263 | 759.08 | 641 | 613 | 180.0 |
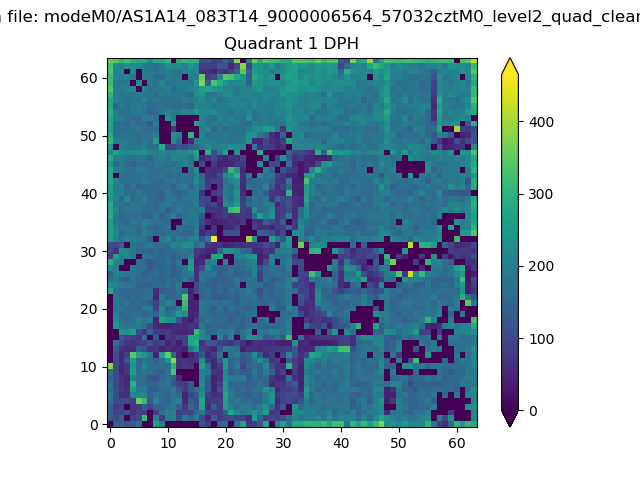
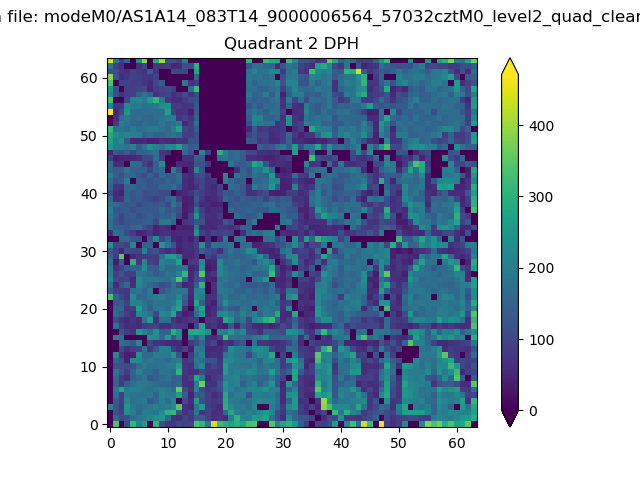
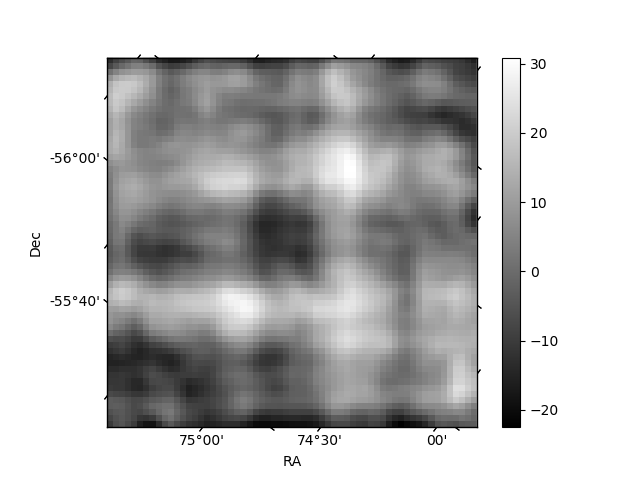
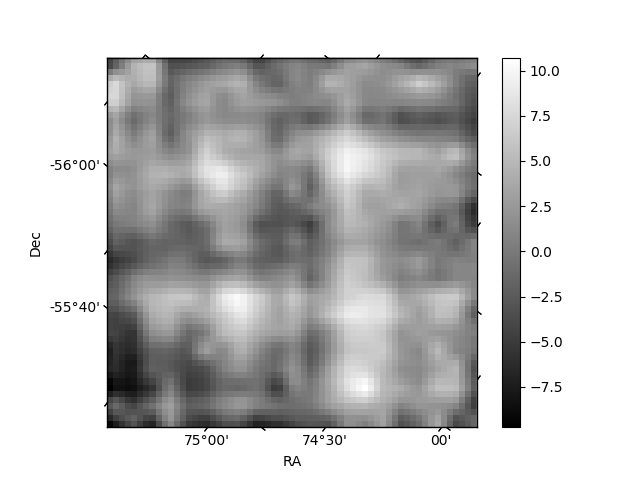
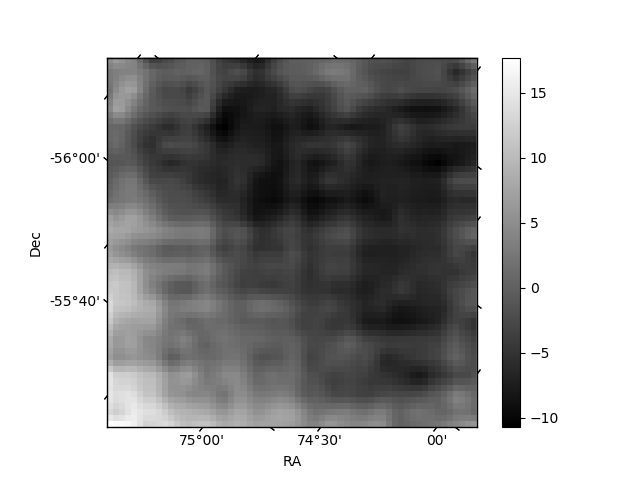
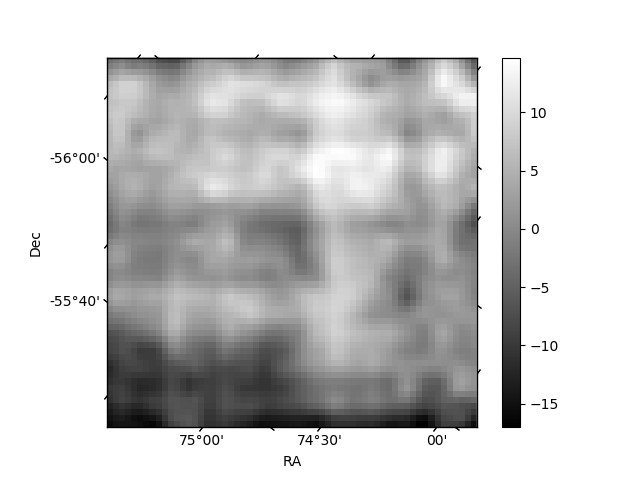
Histogram calculated using DETX and DETY for each event in the final _common_clean file
| Quadrant A | 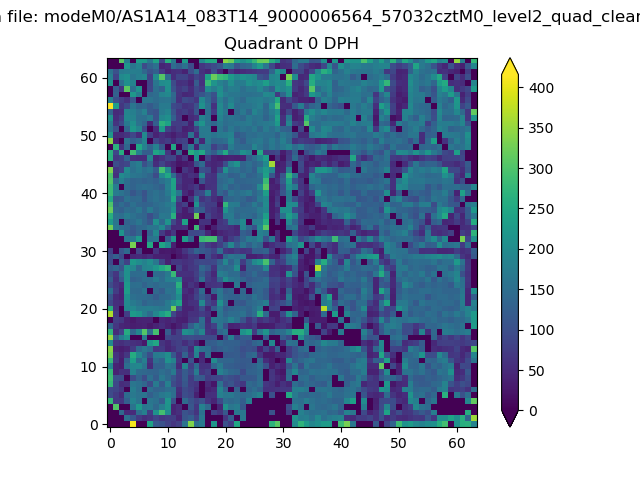 |
 |
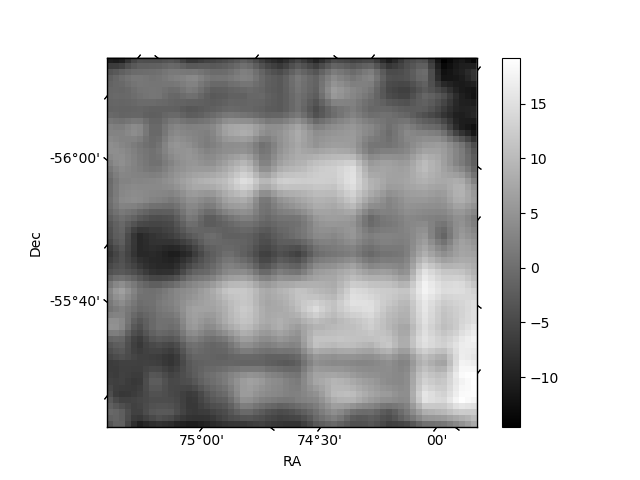
Quadrant B |
|---|---|---|---|
| Quadrant D | 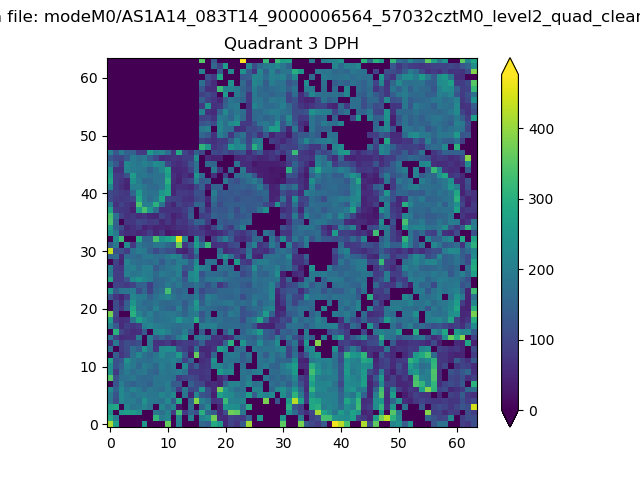 |
 |
Quadrant C |
| Plot type | Count rate plots | Images |
|---|---|---|
| Comparison with Poisson distribution Blue bars denote a histogram of data divided into 1 sec bins. Red curve is a Poisson curve with rate = median count rate of data. |
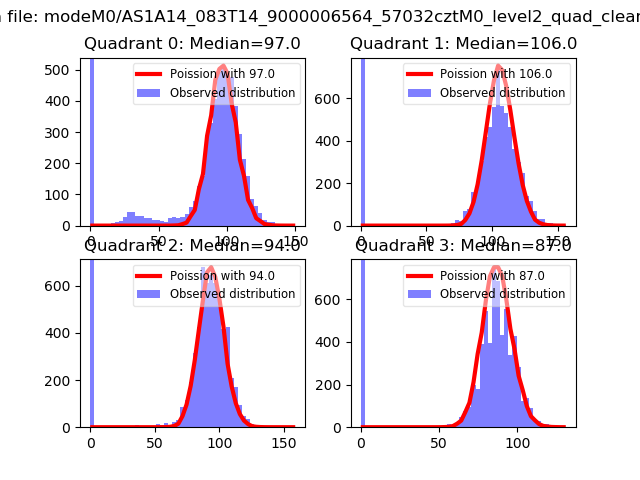 |
 |
| Quadrant-wise count rates Data is divided into 100 sec bins |
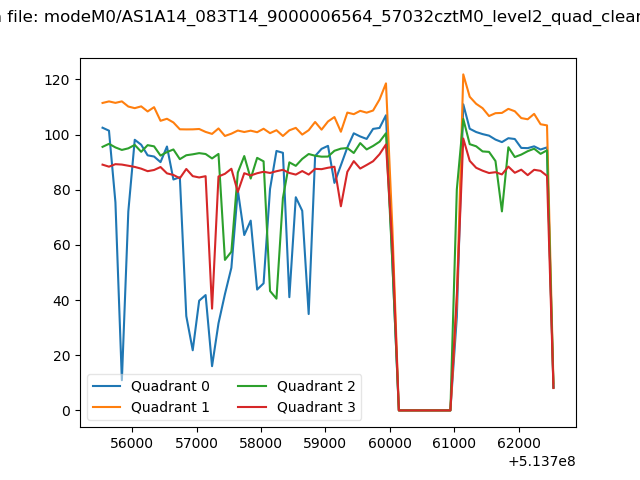 |
|
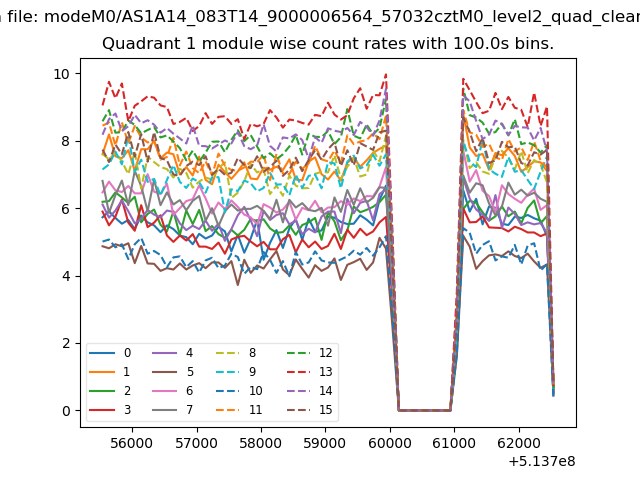
| Module-wise count rates for Quadrant A Data is divided into 100 sec bins |
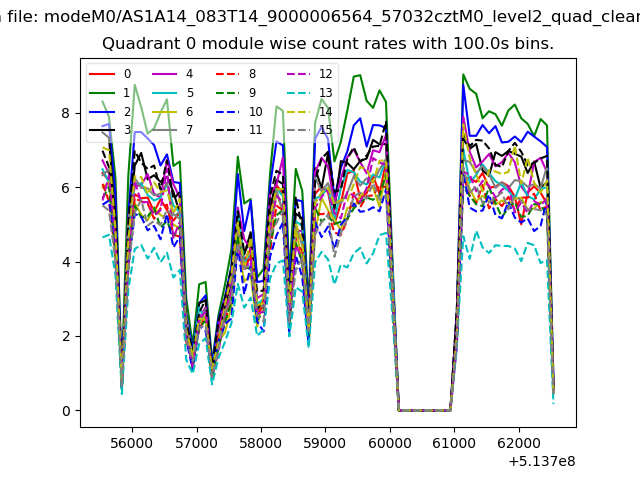 |
 |
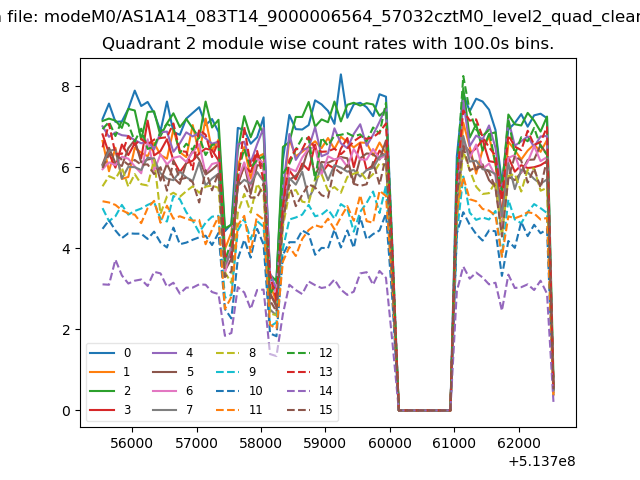
| Module-wise count rates for Quadrant B Data is divided into 100 sec bins |
 |
 |
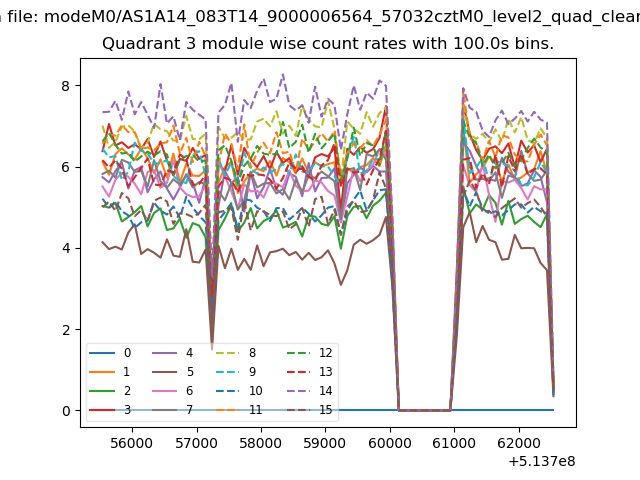
| Module-wise count rates for Quadrant C Data is divided into 100 sec bins |
 |
 |
| Module-wise count rates for Quadrant D Data is divided into 100 sec bins |
 |
 |
| Parameter | Plot |
|---|---|
| CZT HV Monitor | 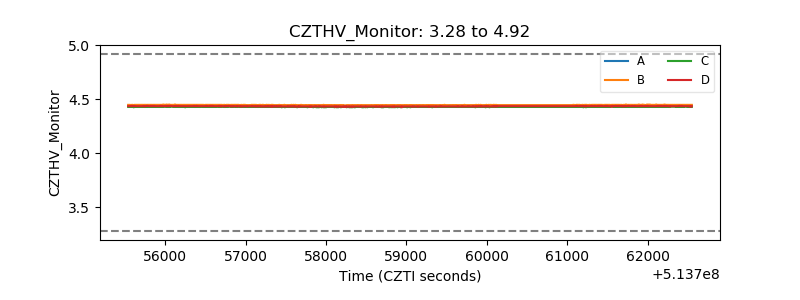 |
| D_VDD | 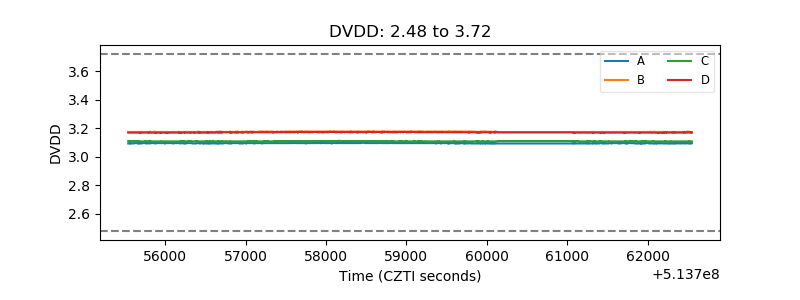 |
| Temperature 1 | 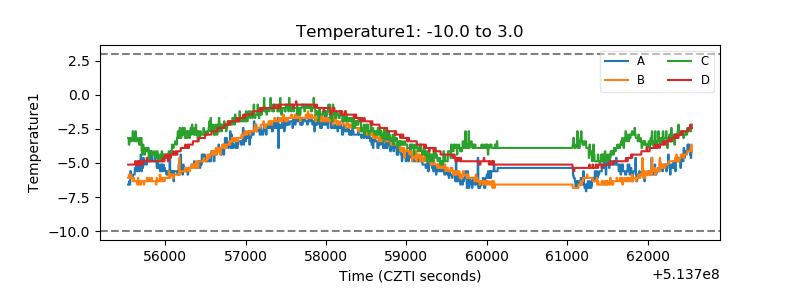 |
| Veto HV Monitor | 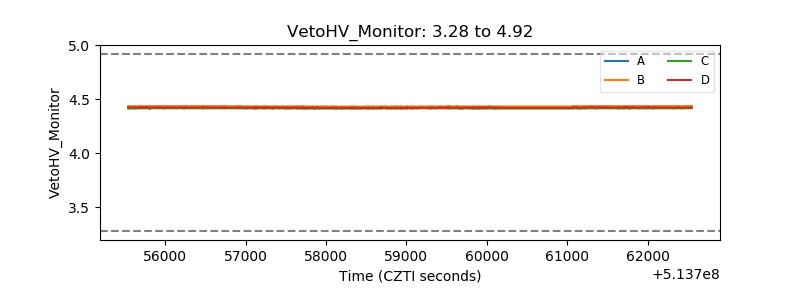 |
| Veto LLD | 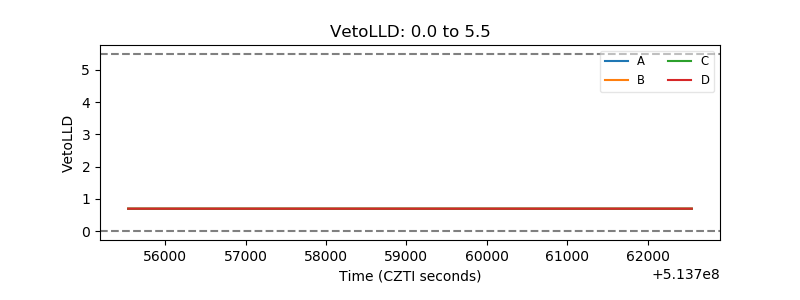 |
| Alpha Counter | 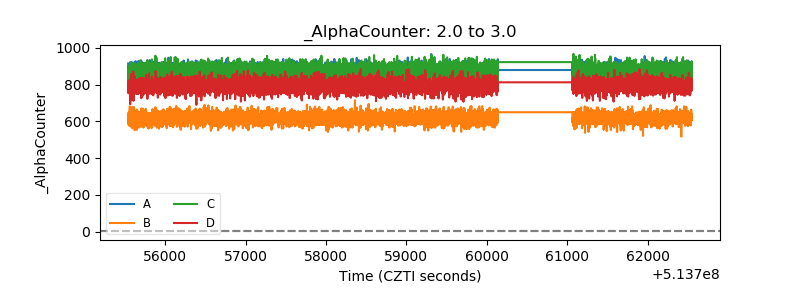 |
| _CPM_Rate | 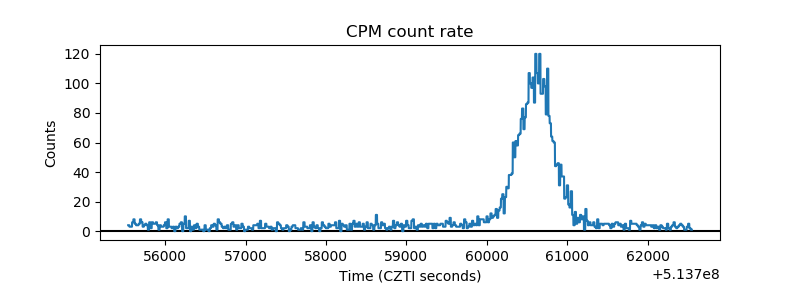 |
| CZT Counter | 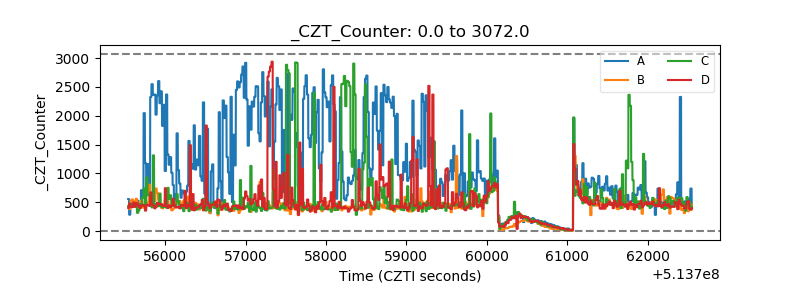 |
| +2.5 Volts monitor |  |
| +5 Volts monitor | 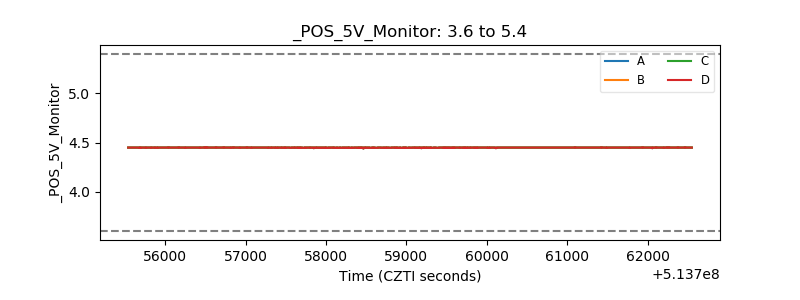 |
| _ROLL_ROT | 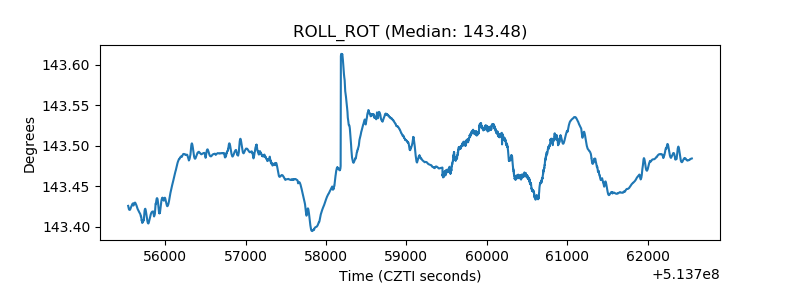 |
| _Roll_DEC | 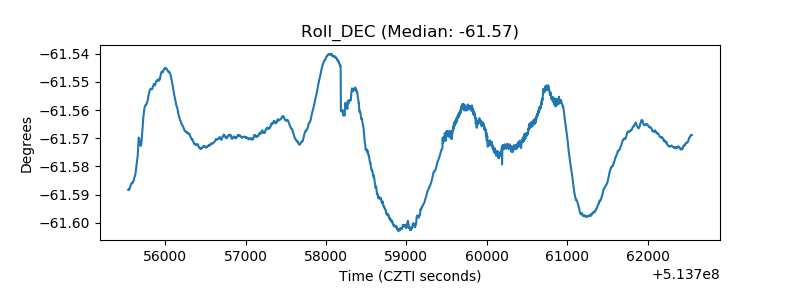 |
| _Roll_RA | 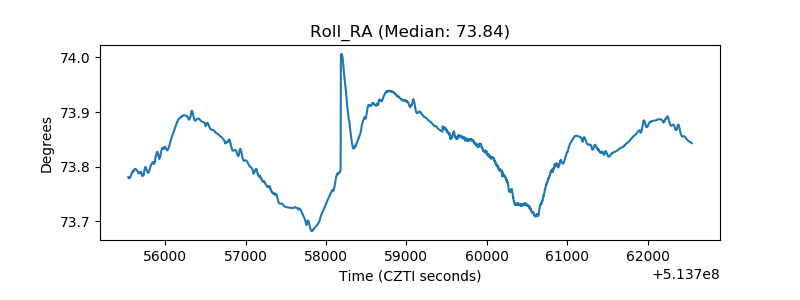 |
| Veto Counter | 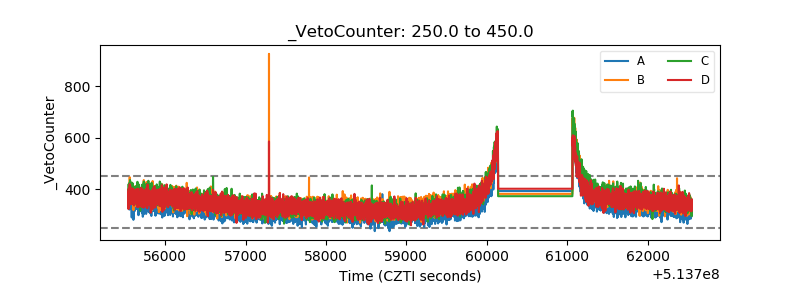 |