| Param | Original file | Final file |
|---|---|---|
| Filename | modeM0/AS1A14_083T14_9000006564_57033cztM0_level2.fits | modeM0/AS1A14_083T14_9000006564_57033cztM0_level2_quad_clean.evt |
| Size (bytes) | 506,675,520 | 94,999,680 |
| Size | 483.2 MB | 90.6 MB |
| Events in quadrant A | 3,858,661 | 634,864 |
| Events in quadrant B | 3,219,052 | 686,458 |
| Events in quadrant C | 4,247,565 | 606,509 |
| Events in quadrant D | 6,903,942 | 476,472 |
| Mode SS | |||
|---|---|---|---|
| Quadrant | BADHDUFLAG | Total packets | Discarded packets |
| A | 0 | 138 | 0 |
| B | 0 | 138 | 0 |
| C | 0 | 138 | 0 |
| D | 0 | 138 | 0 |
| Mode M9 | |||
|---|---|---|---|
| Quadrant | BADHDUFLAG | Total packets | Discarded packets |
| A | 0 | 5 | 0 |
| B | 0 | 5 | 0 |
| C | 0 | 5 | 0 |
| D | 0 | 5 | 0 |
| Mode M0 | |||
|---|---|---|---|
| Quadrant | BADHDUFLAG | Total packets | Discarded packets |
| A | 0 | 16077 | 1 |
| B | 0 | 14301 | 1 |
| C | 0 | 17329 | 1 |
| D | 0 | 25109 | 2 |
| Quadrant | Total seconds | Saturated seconds | Saturation percentage |
|---|---|---|---|
| A | 6771 | 226 | 3.337764% |
| B | 6772 | 204 | 3.012404% |
| C | 6772 | 239 | 3.529238% |
| D | 6771 | 1361 | 20.100428% |
Noise dominated data is calculated using 1-second bins in cleaned event files. If a bin has >2000 counts, and if more than 50% of those come from <1% of pixels, then it is considered to be noise-dominated and hence unusable.
| Quadrant | # 1 sec bins | Bins with >0 counts | Bins with >2000 counts | High rate bins dominated by noise | Noise dominated (total time) | Noise dominated (detector-on time) | Marked lightcurve |
|---|---|---|---|---|---|---|---|
| A | 7261 | 6772 | 43 | 43 | 0.59% | 0.63% | 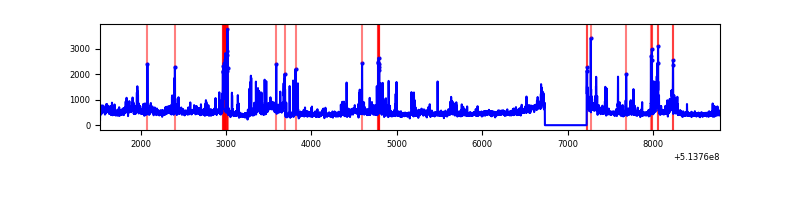 |
| B | 7262 | 6773 | 10 | 10 | 0.14% | 0.15% | 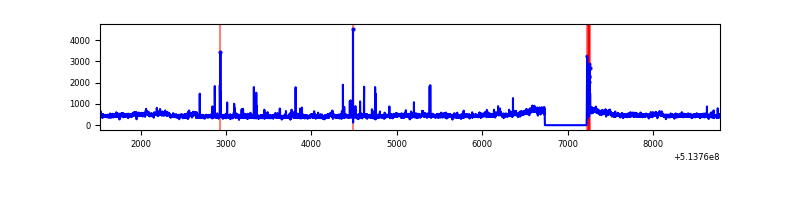 |
| C | 7262 | 6773 | 88 | 88 | 1.21% | 1.30% | 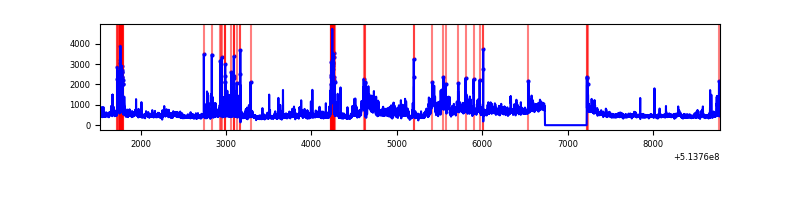 |
| D | 7261 | 6772 | 1065 | 1065 | 14.67% | 15.73% | 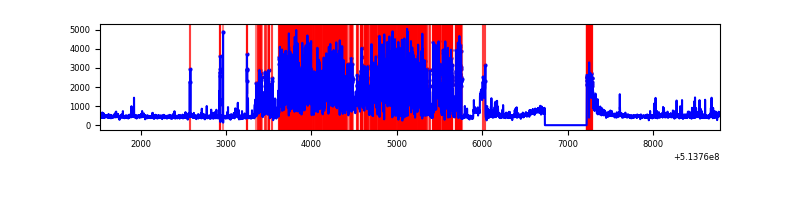 |
Top three noisy pixels from each quadrant. If the there are fewer than three noisy pixels in the level2.evt file, extra rows are filled as -1
| Pixel properties | Quadrant properties | ||||||
|---|---|---|---|---|---|---|---|
| Quadrant | DetID | PixID | Counts | Sigma | Mean | Median | Sigma |
| A | 3 | 14 | 887966 | 4930.78 | 734 | 716 | 179.9 |
| A | 4 | 207 | 47534 | 260.19 | 734 | 716 | 179.9 |
| A | 3 | 245 | 32306 | 175.56 | 734 | 716 | 179.9 |
| B | 0 | 63 | 162338 | 1036.5 | 727 | 700 | 155.9 |
| B | 10 | 16 | 40863 | 257.54 | 727 | 700 | 155.9 |
| B | 0 | 213 | 28710 | 179.61 | 727 | 700 | 155.9 |
| C | 15 | 209 | 715487 | 3692.42 | 714 | 706 | 193.6 |
| C | 12 | 249 | 215598 | 1110.09 | 714 | 706 | 193.6 |
| C | 13 | 23 | 133922 | 688.17 | 714 | 706 | 193.6 |
| D | 12 | 3 | 3369486 | 18245.1 | 657 | 629 | 184.6 |
| D | 11 | 129 | 232761 | 1257.18 | 657 | 629 | 184.6 |
| D | 15 | 142 | 224266 | 1211.18 | 657 | 629 | 184.6 |
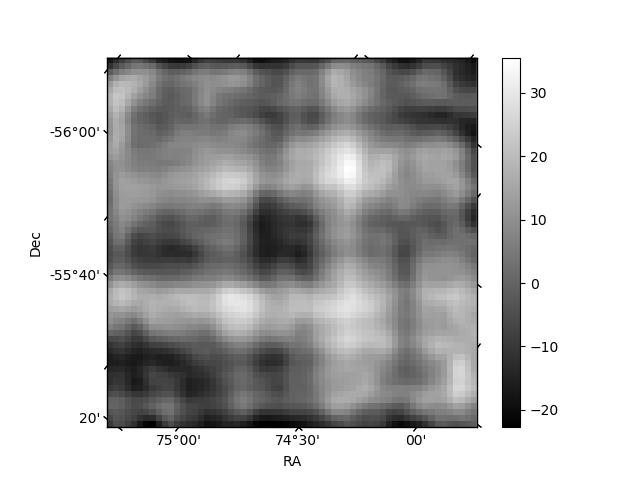
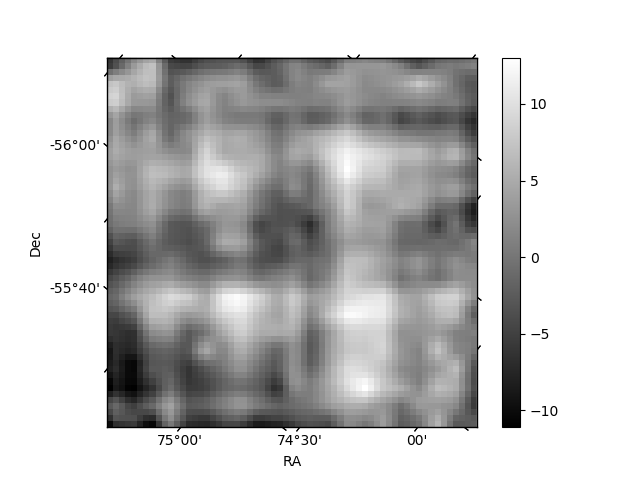
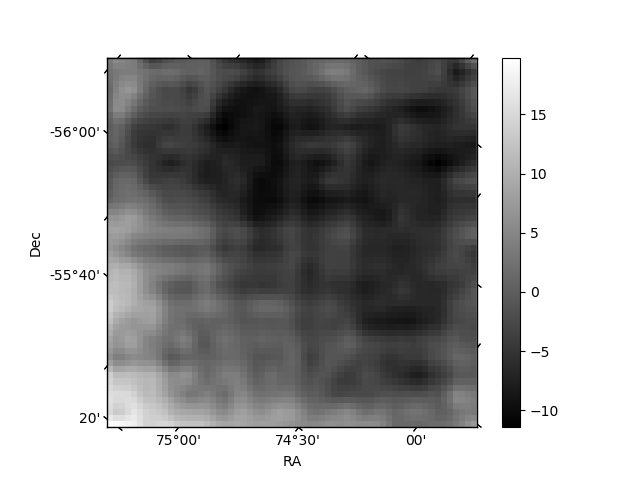
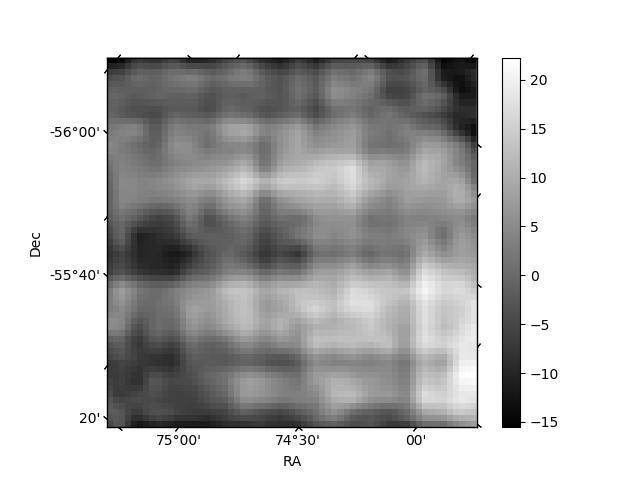
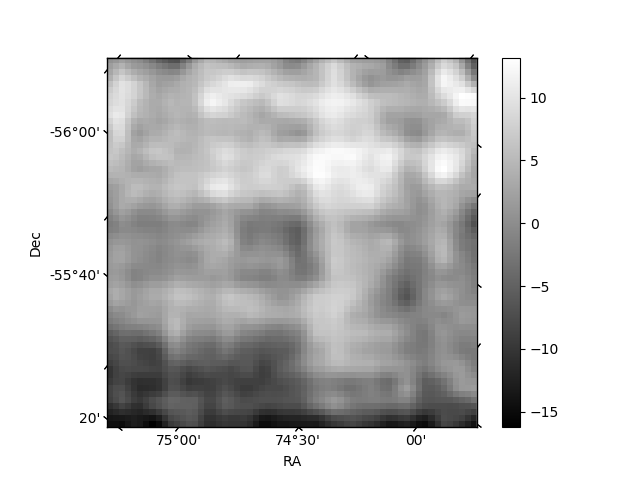
Histogram calculated using DETX and DETY for each event in the final _common_clean file
| Quadrant A | 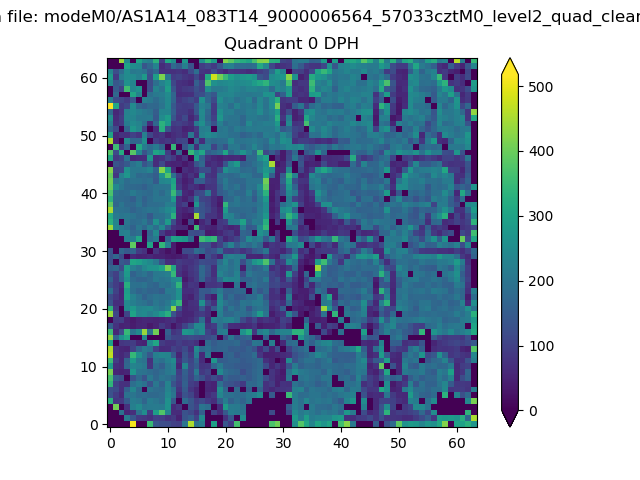 |
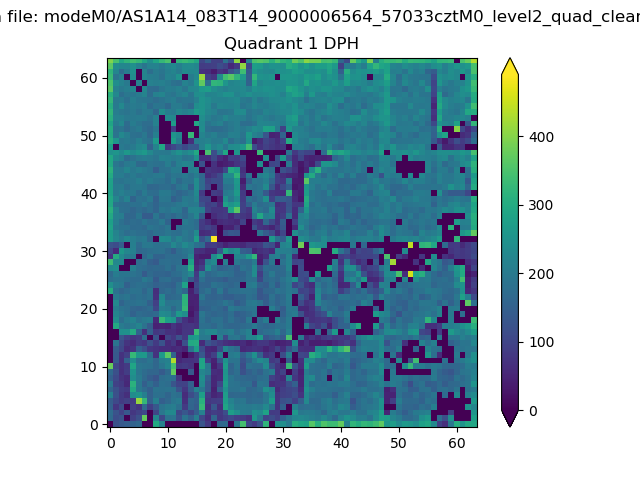 |
Quadrant B |
|---|---|---|---|
| Quadrant D | 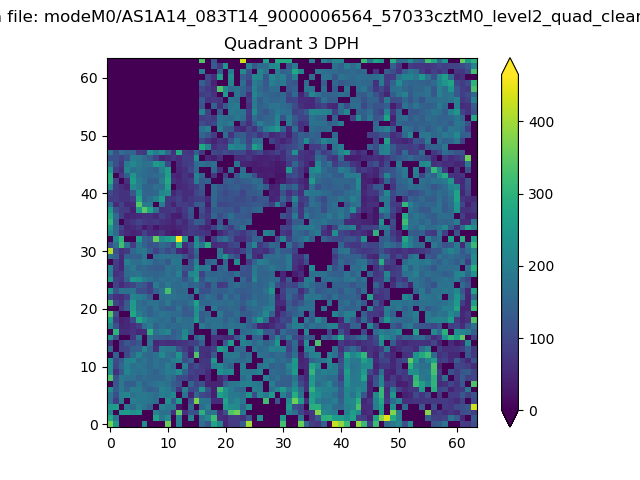 |
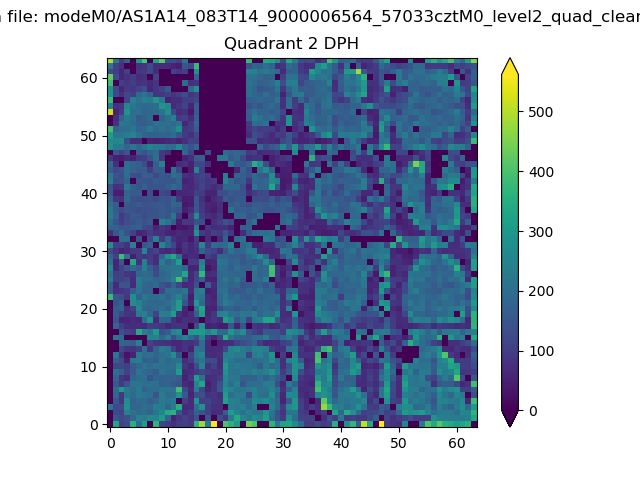 |
Quadrant C |
| Plot type | Count rate plots | Images |
|---|---|---|
| Comparison with Poisson distribution Blue bars denote a histogram of data divided into 1 sec bins. Red curve is a Poisson curve with rate = median count rate of data. |
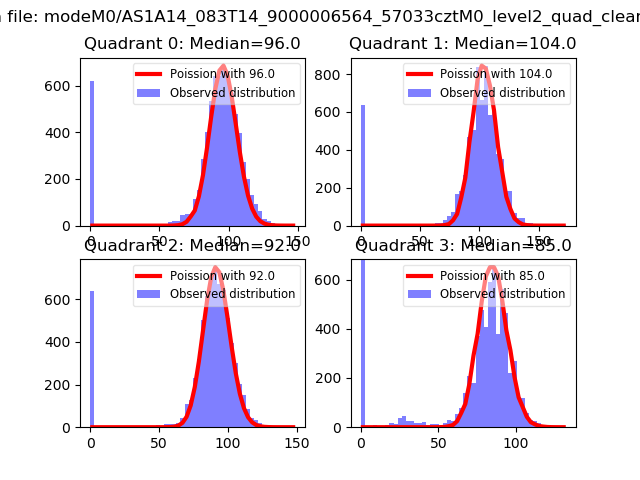 |
 |
| Quadrant-wise count rates Data is divided into 100 sec bins |
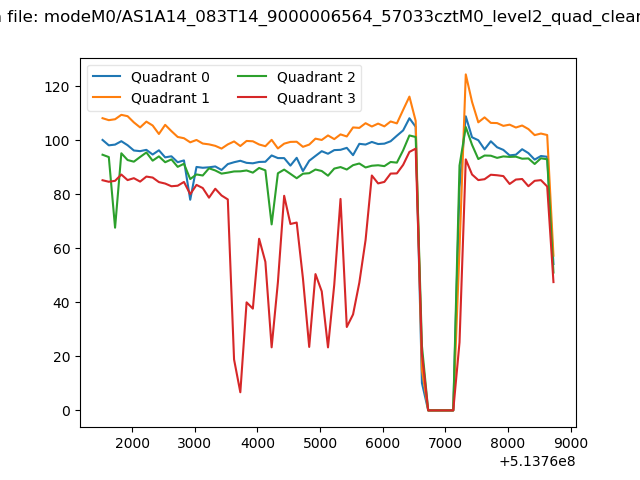 |
|
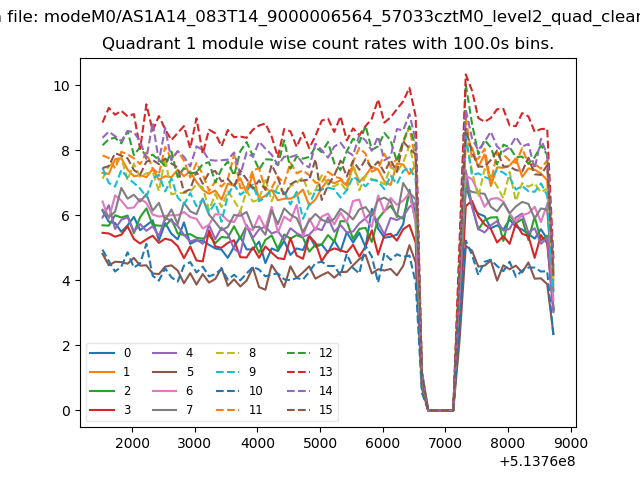
| Module-wise count rates for Quadrant A Data is divided into 100 sec bins |
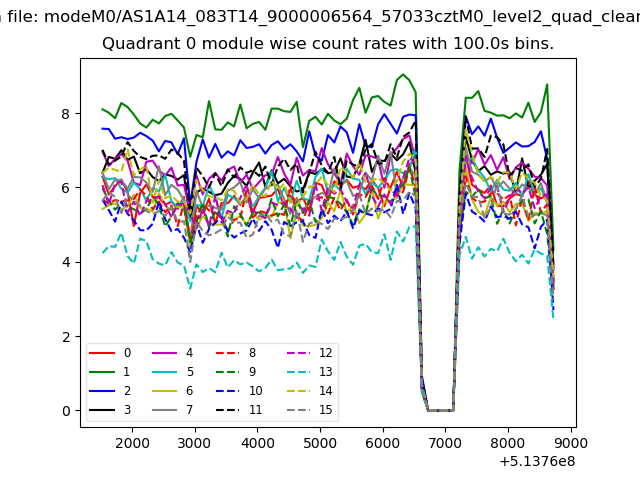 |
 |
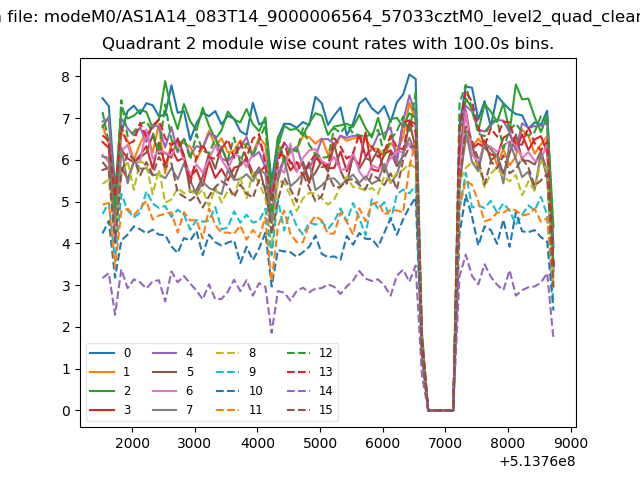
| Module-wise count rates for Quadrant B Data is divided into 100 sec bins |
 |
 |
| Module-wise count rates for Quadrant C Data is divided into 100 sec bins |
 |
 |
| Module-wise count rates for Quadrant D Data is divided into 100 sec bins |
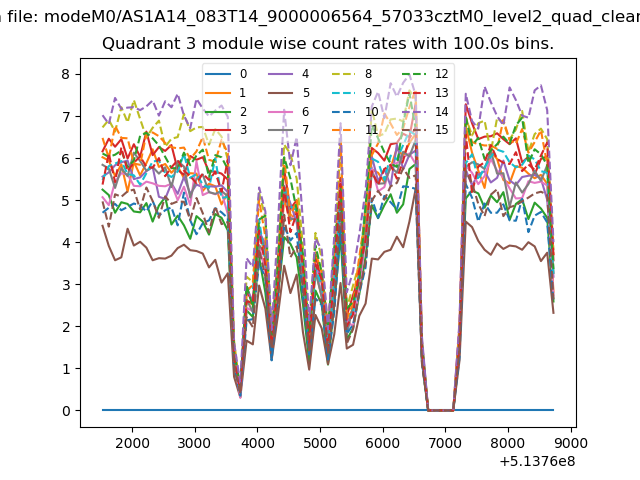 |
 |
| Parameter | Plot |
|---|---|
| CZT HV Monitor | 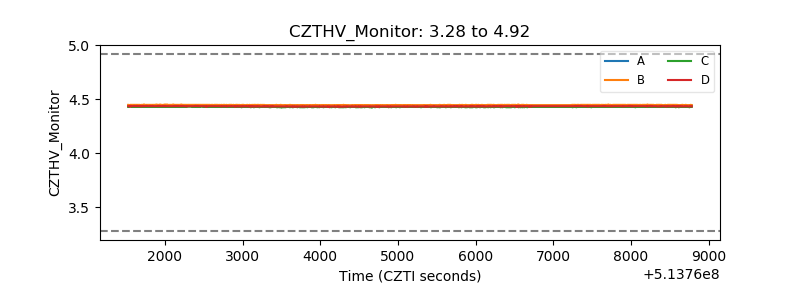 |
| D_VDD | 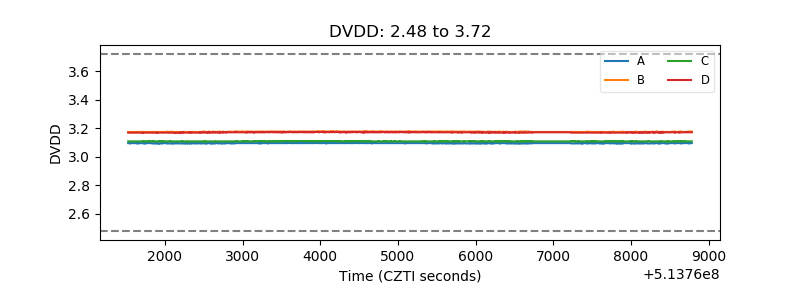 |
| Temperature 1 | 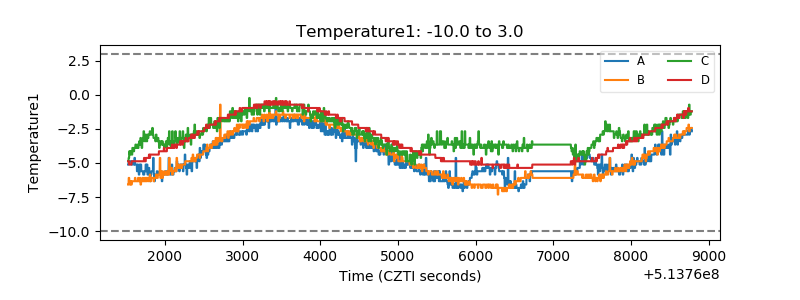 |
| Veto HV Monitor | 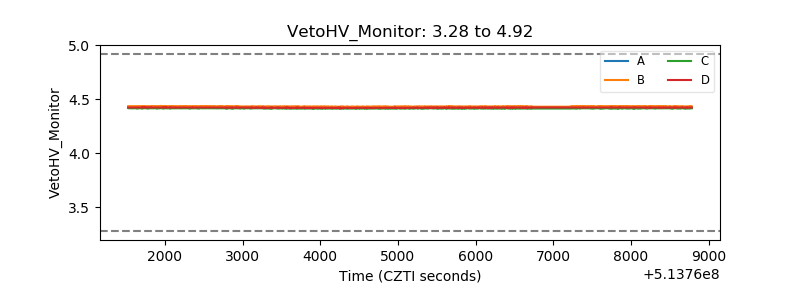 |
| Veto LLD | 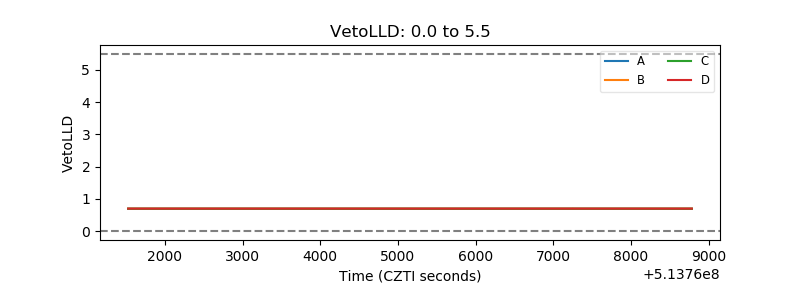 |
| Alpha Counter | 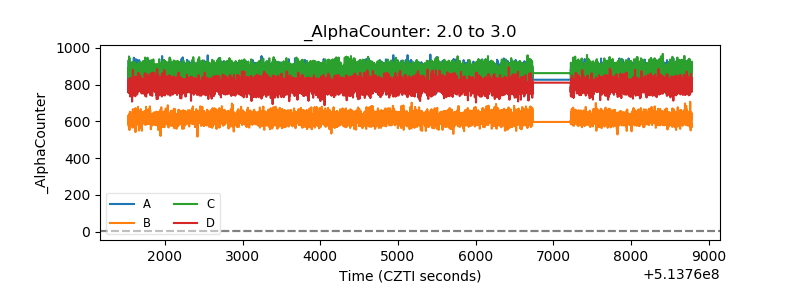 |
| _CPM_Rate | 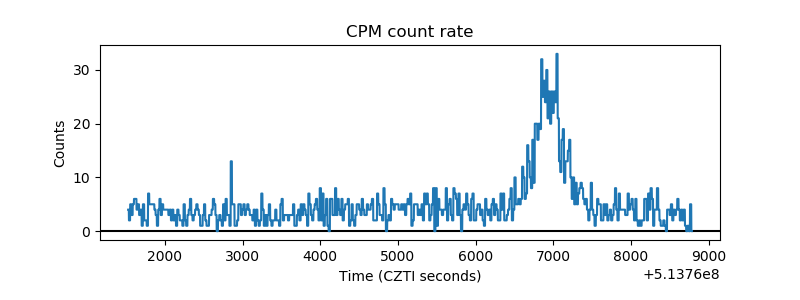 |
| CZT Counter | 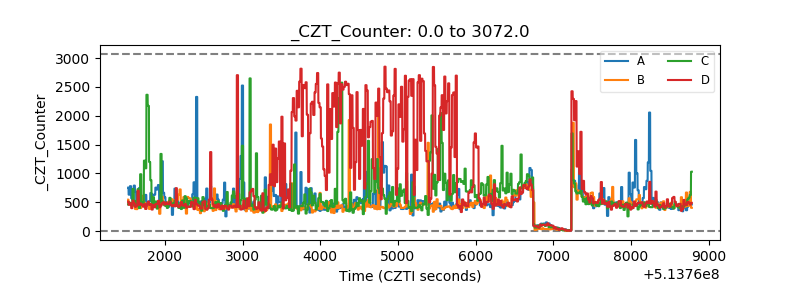 |
| +2.5 Volts monitor |  |
| +5 Volts monitor | 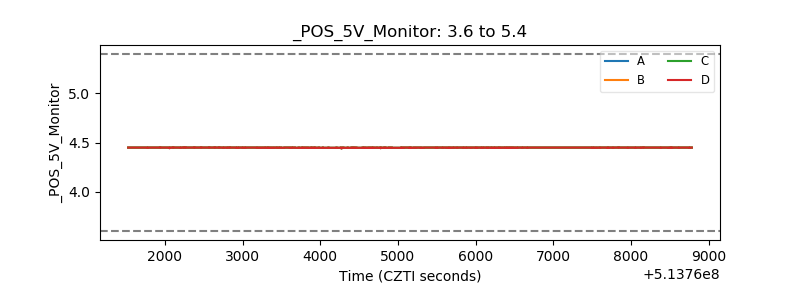 |
| _ROLL_ROT | 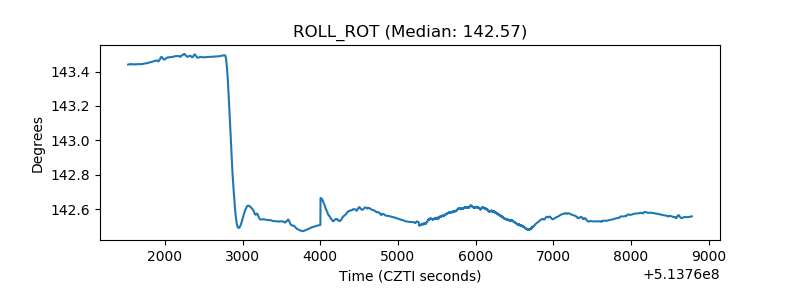 |
| _Roll_DEC | 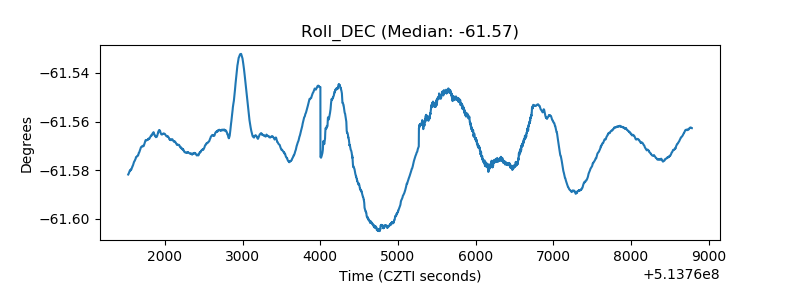 |
| _Roll_RA | 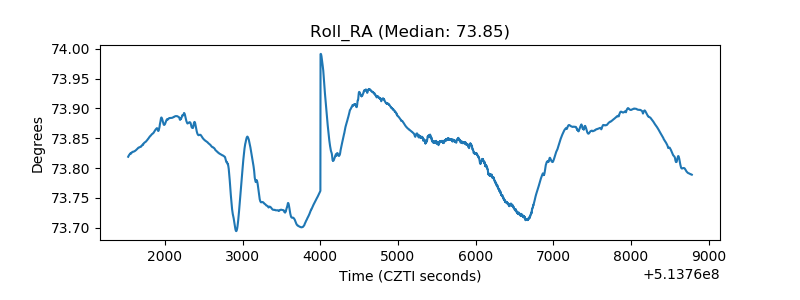 |
| Veto Counter | 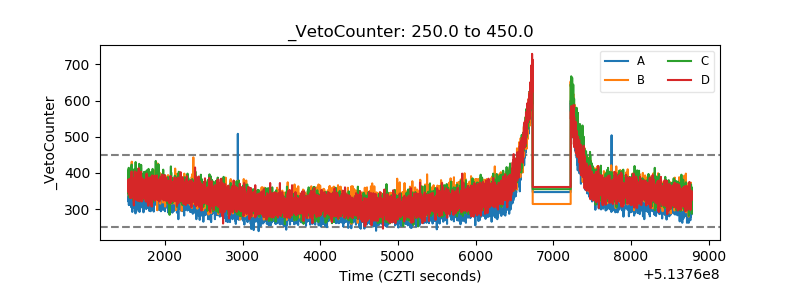 |