| Param | Original file | Final file |
|---|---|---|
| Filename | modeM0/AS1A14_083T14_9000006564_57034cztM0_level2.fits | modeM0/AS1A14_083T14_9000006564_57034cztM0_level2_quad_clean.evt |
| Size (bytes) | 494,193,600 | 111,640,320 |
| Size | 471.3 MB | 106.5 MB |
| Events in quadrant A | 3,822,886 | 739,409 |
| Events in quadrant B | 4,838,421 | 743,622 |
| Events in quadrant C | 3,757,874 | 712,302 |
| Events in quadrant D | 5,270,412 | 644,890 |
| Mode SS | |||
|---|---|---|---|
| Quadrant | BADHDUFLAG | Total packets | Discarded packets |
| A | 0 | 156 | 0 |
| B | 0 | 156 | 0 |
| C | 0 | 156 | 0 |
| D | 0 | 156 | 0 |
| Mode M0 | |||
|---|---|---|---|
| Quadrant | BADHDUFLAG | Total packets | Discarded packets |
| A | 0 | 16917 | 0 |
| B | 0 | 19879 | 0 |
| C | 0 | 16751 | 1 |
| D | 0 | 20924 | 0 |
| Quadrant | Total seconds | Saturated seconds | Saturation percentage |
|---|---|---|---|
| A | 7765 | 42 | 0.540889% |
| B | 7766 | 615 | 7.919135% |
| C | 7765 | 40 | 0.515132% |
| D | 7765 | 376 | 4.842241% |
Noise dominated data is calculated using 1-second bins in cleaned event files. If a bin has >2000 counts, and if more than 50% of those come from <1% of pixels, then it is considered to be noise-dominated and hence unusable.
| Quadrant | # 1 sec bins | Bins with >0 counts | Bins with >2000 counts | High rate bins dominated by noise | Noise dominated (total time) | Noise dominated (detector-on time) | Marked lightcurve |
|---|---|---|---|---|---|---|---|
| A | 7765 | 7765 | 17 | 17 | 0.22% | 0.22% | 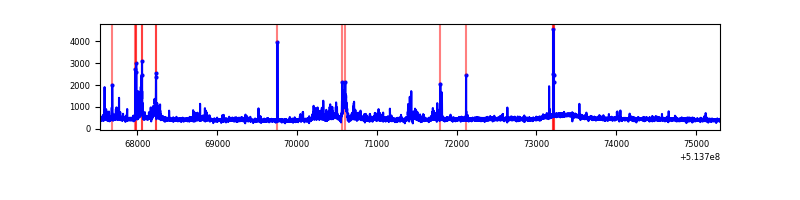 |
| B | 7766 | 7766 | 351 | 351 | 4.52% | 4.52% | 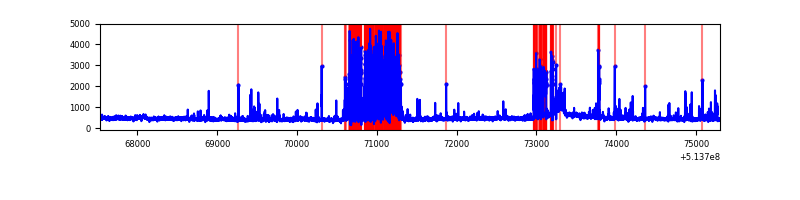 |
| C | 7765 | 7765 | 22 | 22 | 0.28% | 0.28% | 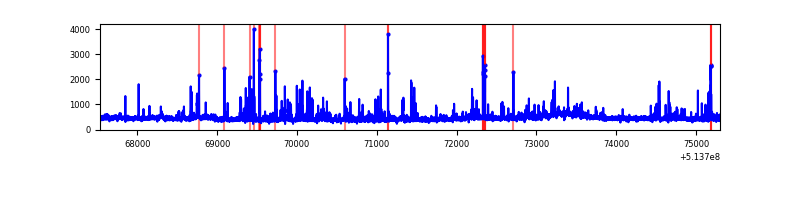 |
| D | 7765 | 7765 | 350 | 350 | 4.51% | 4.51% | 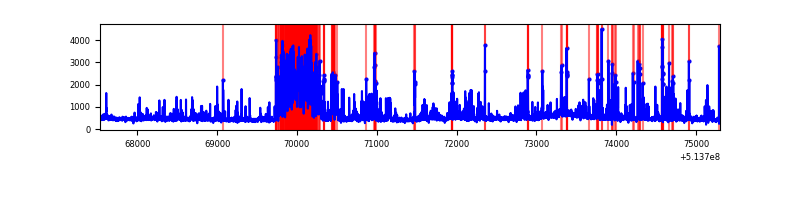 |
Top three noisy pixels from each quadrant. If the there are fewer than three noisy pixels in the level2.evt file, extra rows are filled as -1
| Pixel properties | Quadrant properties | ||||||
|---|---|---|---|---|---|---|---|
| Quadrant | DetID | PixID | Counts | Sigma | Mean | Median | Sigma |
| A | 3 | 14 | 477048 | 2304.07 | 842 | 820 | 206.7 |
| A | 3 | 245 | 22088 | 102.9 | 842 | 820 | 206.7 |
| A | 10 | 251 | 16980 | 78.18 | 842 | 820 | 206.7 |
| B | 1 | 207 | 984471 | 5692.11 | 806 | 773 | 172.8 |
| B | 5 | 185 | 331739 | 1915.12 | 806 | 773 | 172.8 |
| B | 7 | 129 | 93418 | 536.08 | 806 | 773 | 172.8 |
| C | 12 | 254 | 137359 | 612.22 | 819 | 808 | 223.0 |
| C | 12 | 252 | 92420 | 410.74 | 819 | 808 | 223.0 |
| C | 6 | 223 | 75479 | 334.78 | 819 | 808 | 223.0 |
| D | 2 | 120 | 1029937 | 4536.59 | 806 | 770 | 226.9 |
| D | 2 | 249 | 364386 | 1602.83 | 806 | 770 | 226.9 |
| D | 7 | 96 | 155255 | 680.97 | 806 | 770 | 226.9 |
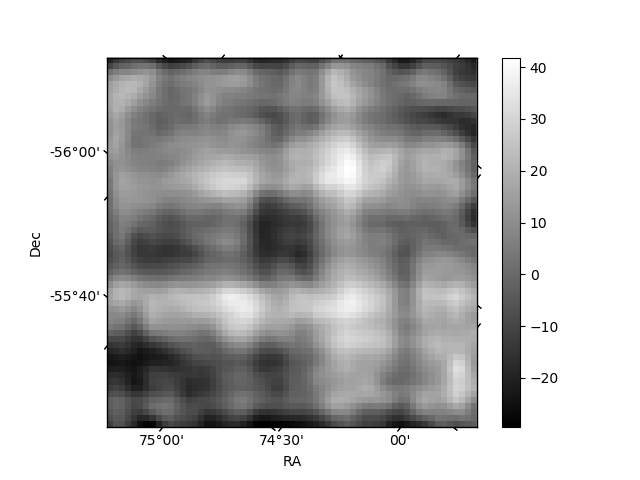
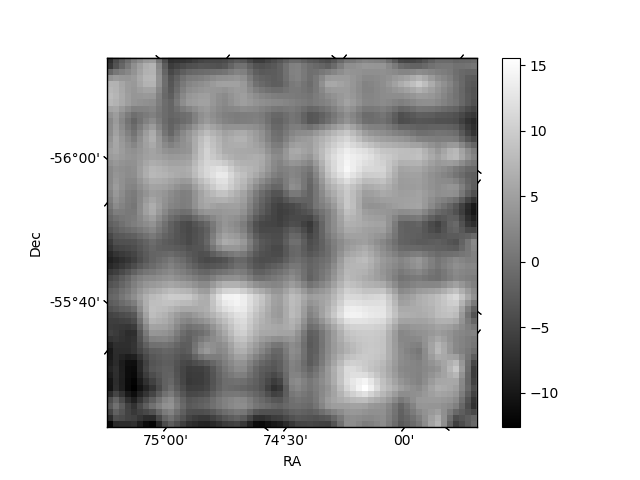
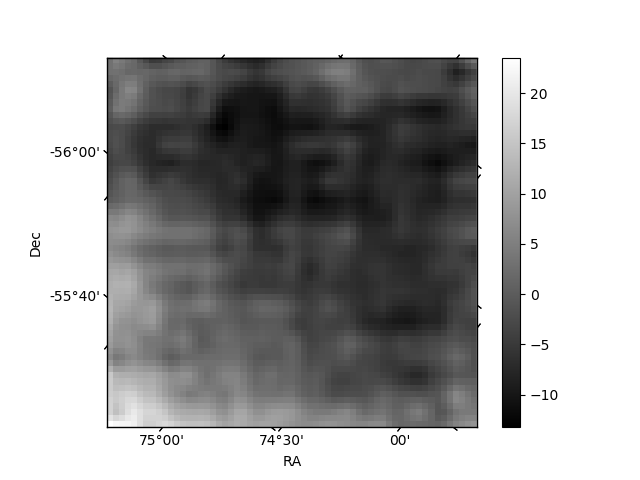
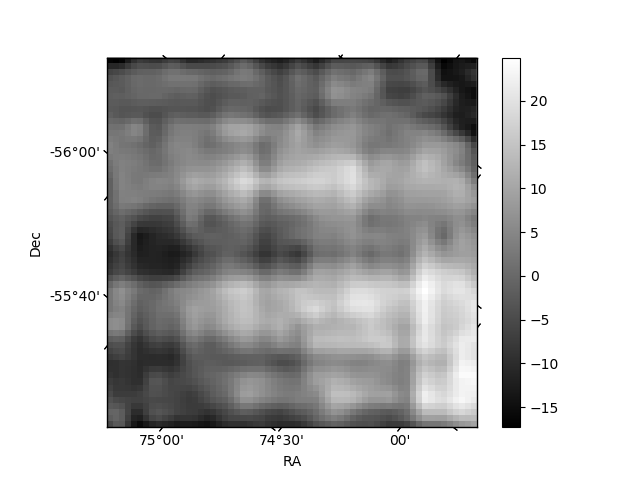
Histogram calculated using DETX and DETY for each event in the final _common_clean file
| Quadrant A | 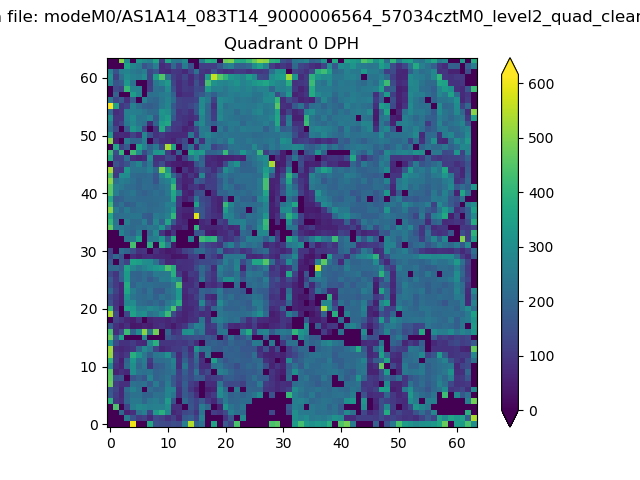 |
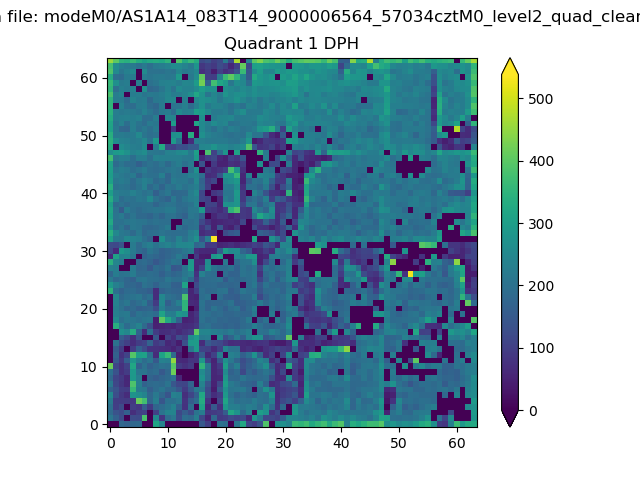 |
Quadrant B |
|---|---|---|---|
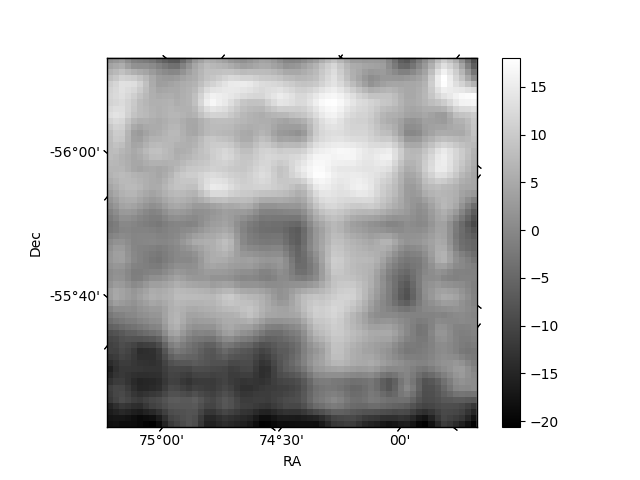
| Quadrant D | 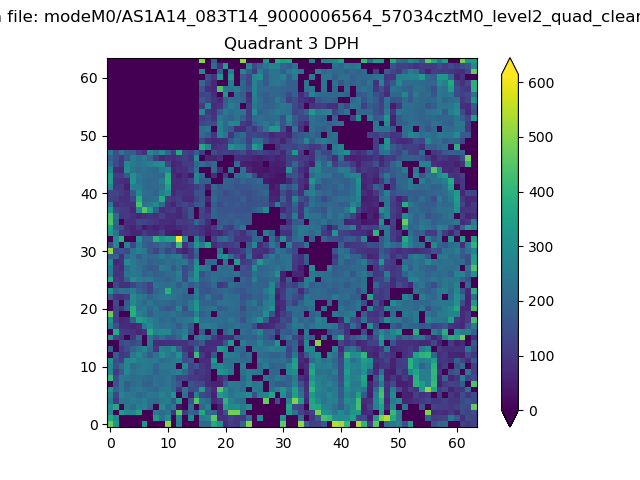 |
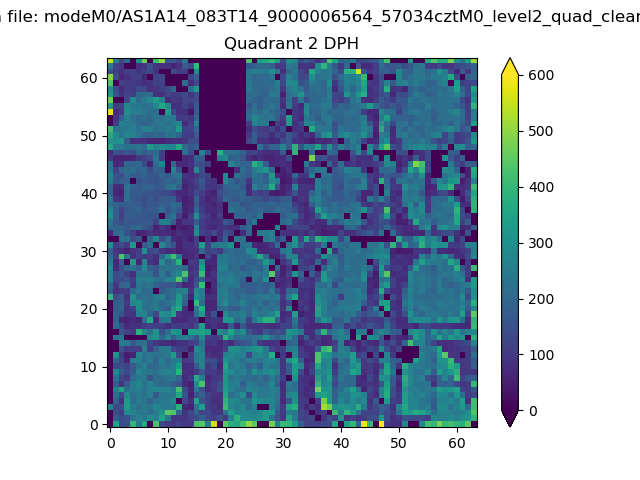 |
Quadrant C |
| Plot type | Count rate plots | Images |
|---|---|---|
| Comparison with Poisson distribution Blue bars denote a histogram of data divided into 1 sec bins. Red curve is a Poisson curve with rate = median count rate of data. |
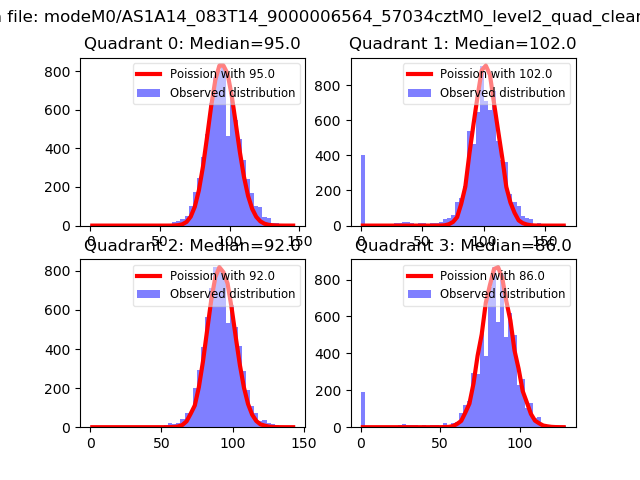 |
 |
| Quadrant-wise count rates Data is divided into 100 sec bins |
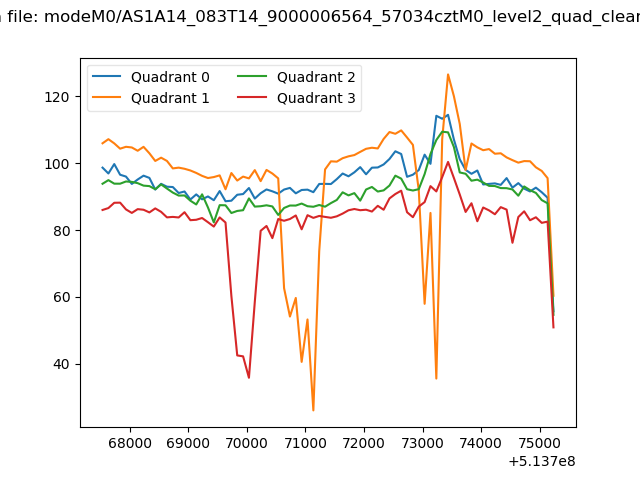 |
|
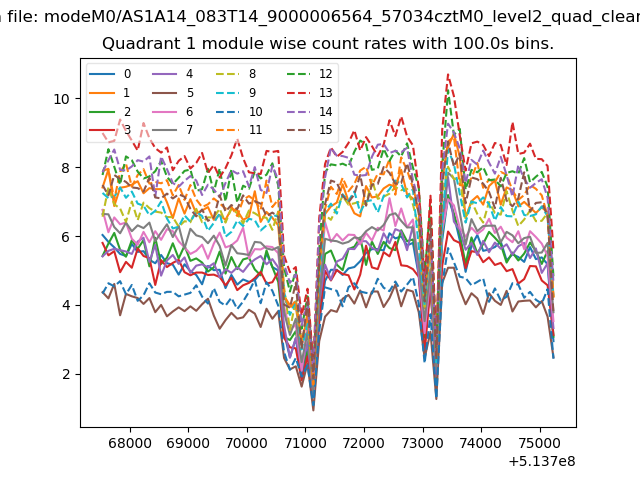
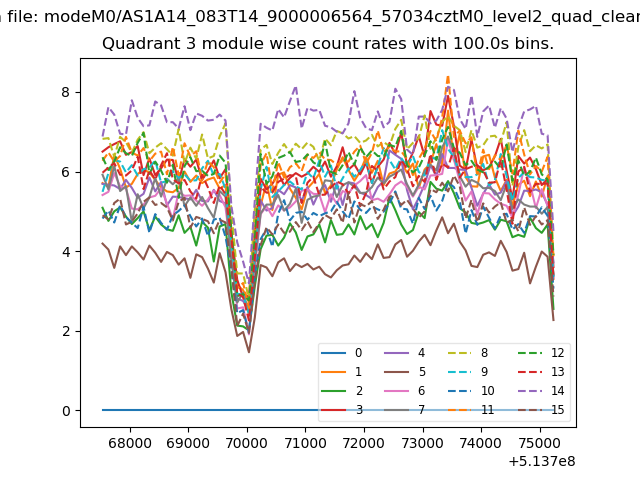
| Module-wise count rates for Quadrant A Data is divided into 100 sec bins |
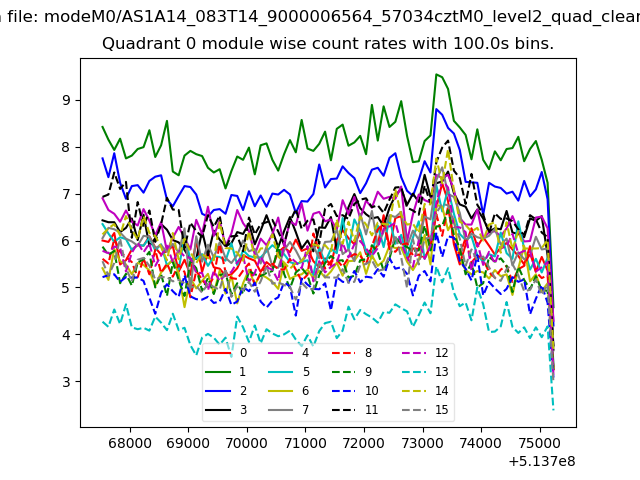 |
 |
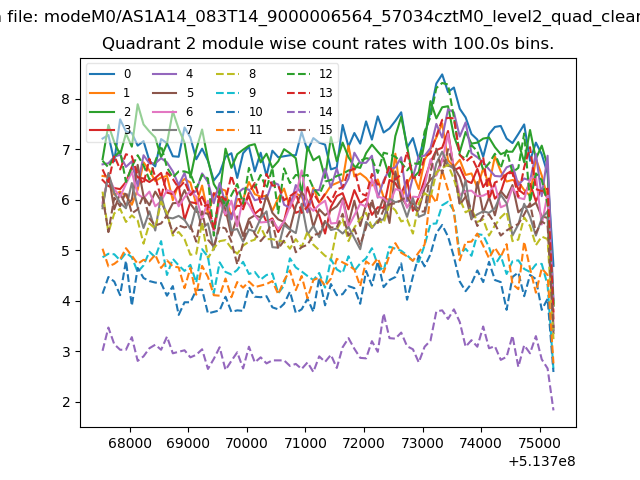
| Module-wise count rates for Quadrant B Data is divided into 100 sec bins |
 |
 |
| Module-wise count rates for Quadrant C Data is divided into 100 sec bins |
 |
 |
| Module-wise count rates for Quadrant D Data is divided into 100 sec bins |
 |
 |
| Parameter | Plot |
|---|---|
| CZT HV Monitor | 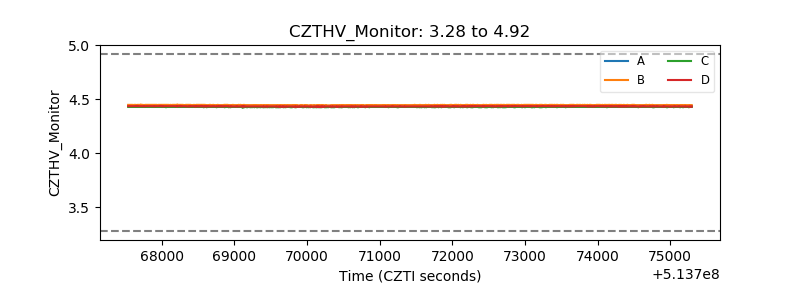 |
| D_VDD | 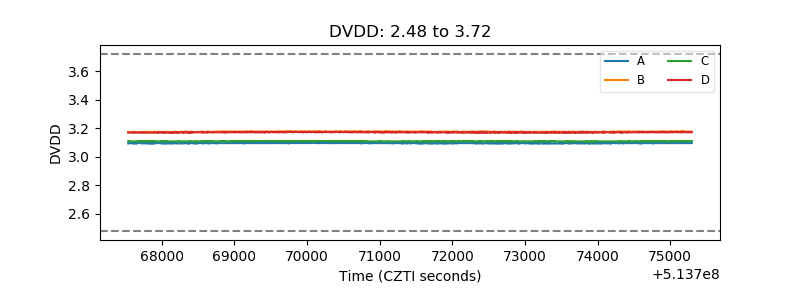 |
| Temperature 1 | 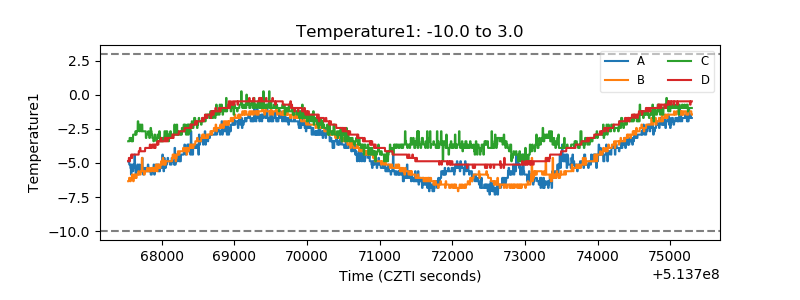 |
| Veto HV Monitor | 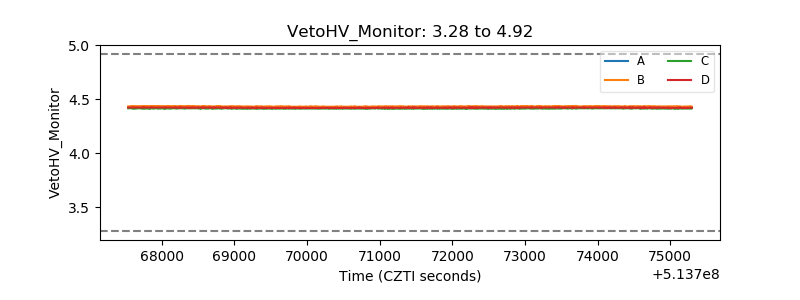 |
| Veto LLD | 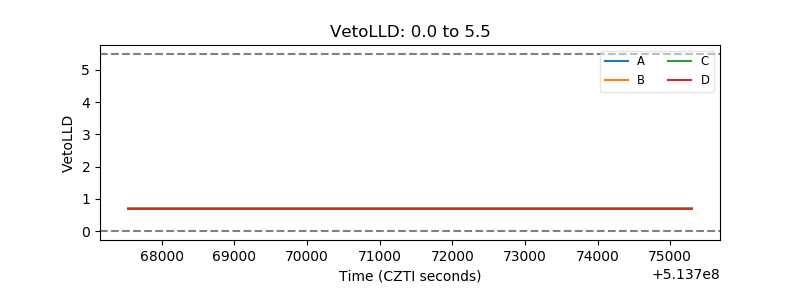 |
| Alpha Counter | 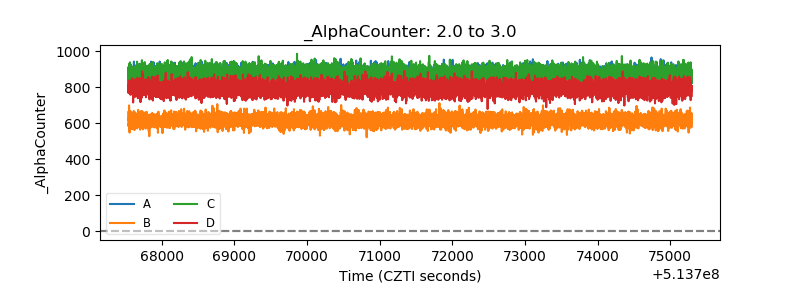 |
| _CPM_Rate | 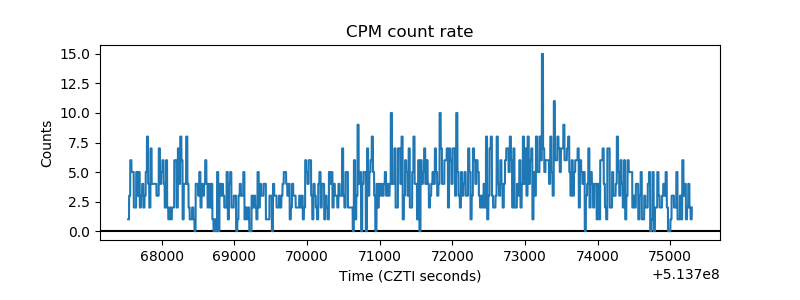 |
| CZT Counter | 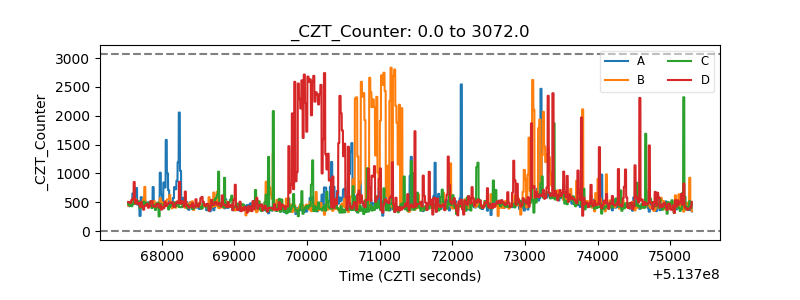 |
| +2.5 Volts monitor |  |
| +5 Volts monitor |  |
| _ROLL_ROT | 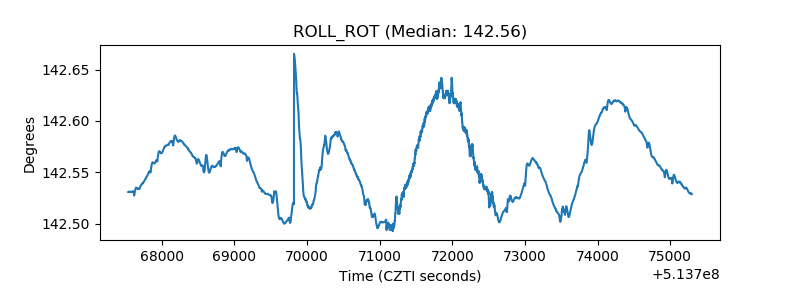 |
| _Roll_DEC | 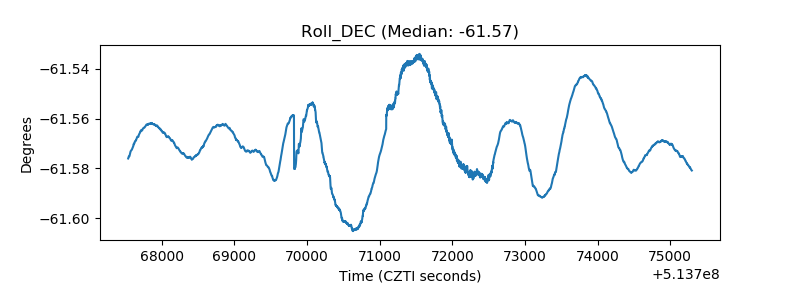 |
| _Roll_RA | 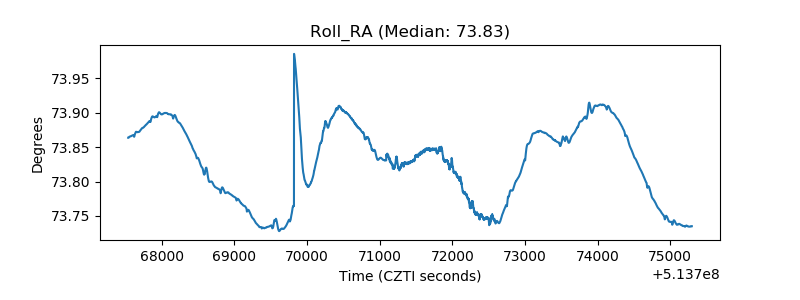 |
| Veto Counter | 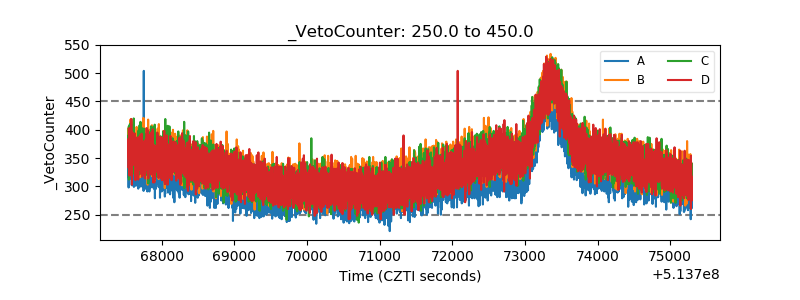 |