| Param | Original file | Final file |
|---|---|---|
| Filename | modeM0/AS1A14_083T14_9000006564_57035cztM0_level2.fits | modeM0/AS1A14_083T14_9000006564_57035cztM0_level2_quad_clean.evt |
| Size (bytes) | 429,753,600 | 101,240,640 |
| Size | 409.8 MB | 96.6 MB |
| Events in quadrant A | 3,839,239 | 655,969 |
| Events in quadrant B | 3,580,626 | 708,075 |
| Events in quadrant C | 3,799,153 | 626,541 |
| Events in quadrant D | 4,144,731 | 587,298 |
| Mode SS | |||
|---|---|---|---|
| Quadrant | BADHDUFLAG | Total packets | Discarded packets |
| A | 0 | 140 | 0 |
| B | 0 | 140 | 0 |
| C | 0 | 140 | 0 |
| D | 0 | 140 | 0 |
| Mode M0 | |||
|---|---|---|---|
| Quadrant | BADHDUFLAG | Total packets | Discarded packets |
| A | 0 | 16324 | 2 |
| B | 0 | 15586 | 0 |
| C | 0 | 16506 | 0 |
| D | 0 | 17178 | 0 |
| Quadrant | Total seconds | Saturated seconds | Saturation percentage |
|---|---|---|---|
| A | 6997 | 119 | 1.700729% |
| B | 6998 | 87 | 1.243212% |
| C | 6998 | 149 | 2.129180% |
| D | 6998 | 178 | 2.543584% |
Noise dominated data is calculated using 1-second bins in cleaned event files. If a bin has >2000 counts, and if more than 50% of those come from <1% of pixels, then it is considered to be noise-dominated and hence unusable.
| Quadrant | # 1 sec bins | Bins with >0 counts | Bins with >2000 counts | High rate bins dominated by noise | Noise dominated (total time) | Noise dominated (detector-on time) | Marked lightcurve |
|---|---|---|---|---|---|---|---|
| A | 6997 | 6997 | 95 | 95 | 1.36% | 1.36% | 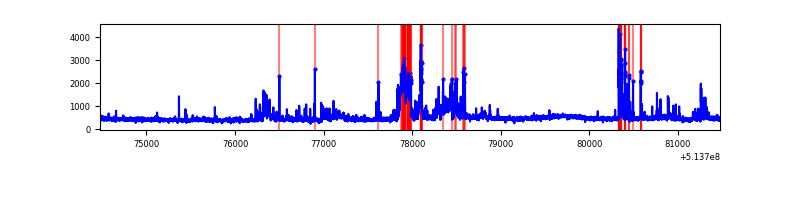 |
| B | 6998 | 6998 | 62 | 62 | 0.89% | 0.89% | 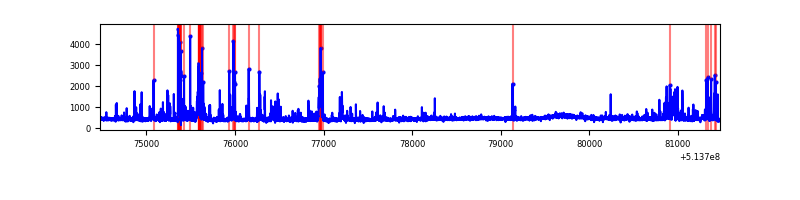 |
| C | 6998 | 6998 | 149 | 149 | 2.13% | 2.13% | 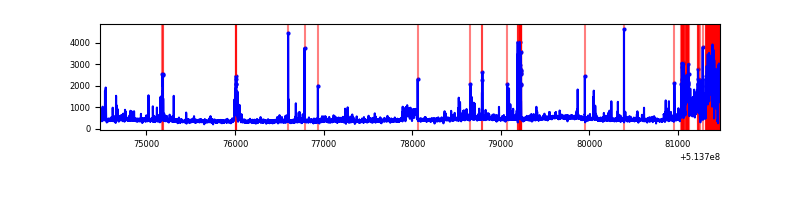 |
| D | 6998 | 6998 | 189 | 189 | 2.70% | 2.70% | 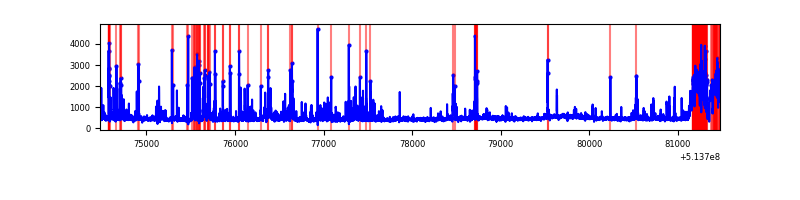 |
Top three noisy pixels from each quadrant. If the there are fewer than three noisy pixels in the level2.evt file, extra rows are filled as -1
| Pixel properties | Quadrant properties | ||||||
|---|---|---|---|---|---|---|---|
| Quadrant | DetID | PixID | Counts | Sigma | Mean | Median | Sigma |
| A | 3 | 14 | 677283 | 3674.84 | 743 | 723 | 184.1 |
| A | 4 | 13 | 162872 | 880.74 | 743 | 723 | 184.1 |
| A | 4 | 236 | 23303 | 122.65 | 743 | 723 | 184.1 |
| B | 10 | 247 | 257533 | 1614.13 | 737 | 709 | 159.1 |
| B | 0 | 213 | 92372 | 576.1 | 737 | 709 | 159.1 |
| B | 1 | 207 | 92254 | 575.36 | 737 | 709 | 159.1 |
| C | 12 | 252 | 566226 | 2868.57 | 720 | 712 | 197.1 |
| C | 6 | 223 | 113735 | 573.31 | 720 | 712 | 197.1 |
| C | 12 | 254 | 99471 | 500.96 | 720 | 712 | 197.1 |
| D | 12 | 251 | 435288 | 2138.54 | 717 | 684 | 203.2 |
| D | 2 | 249 | 378466 | 1858.94 | 717 | 684 | 203.2 |
| D | 12 | 3 | 108392 | 529.99 | 717 | 684 | 203.2 |
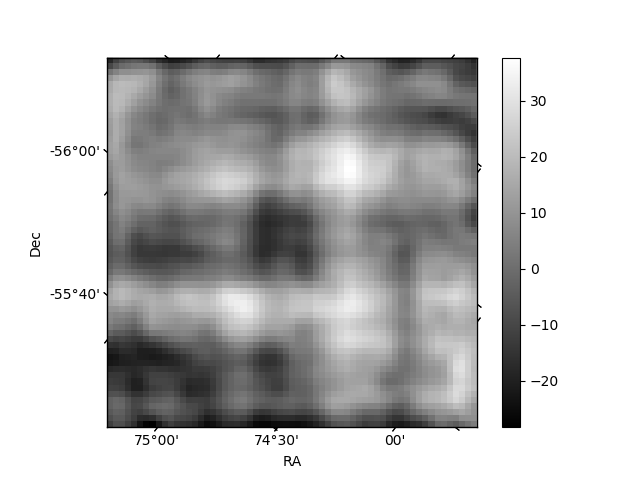
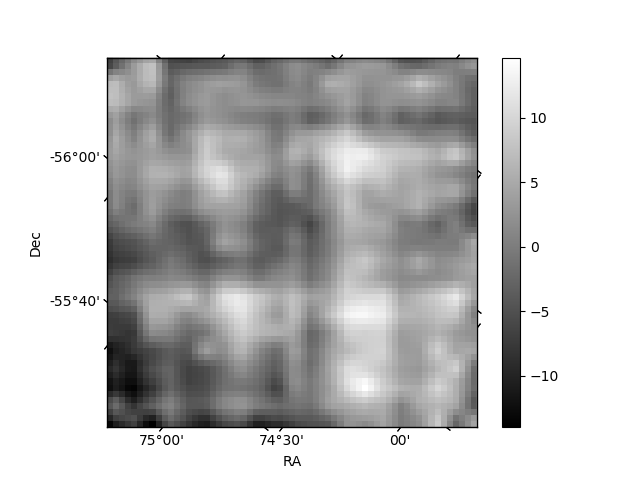
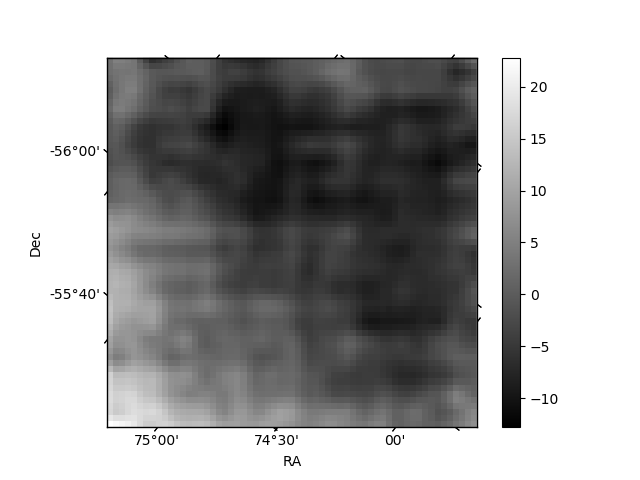
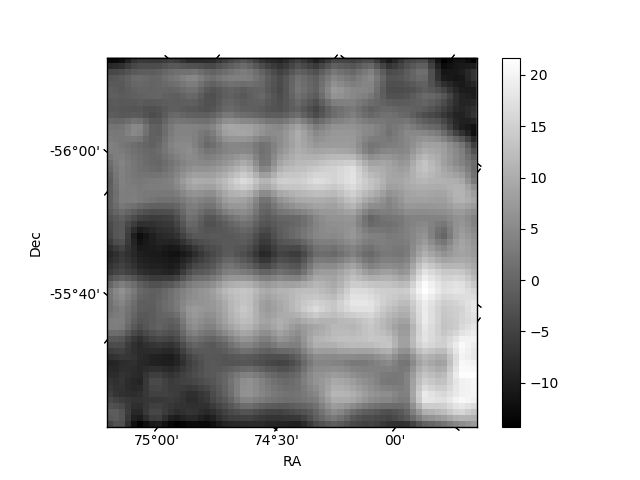
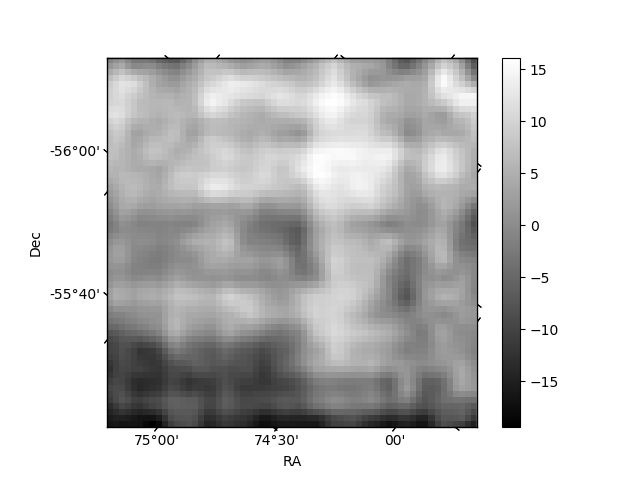
Histogram calculated using DETX and DETY for each event in the final _common_clean file
| Quadrant A | 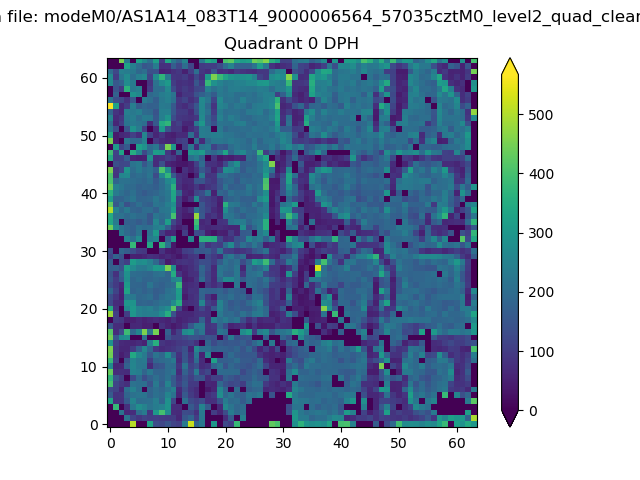 |
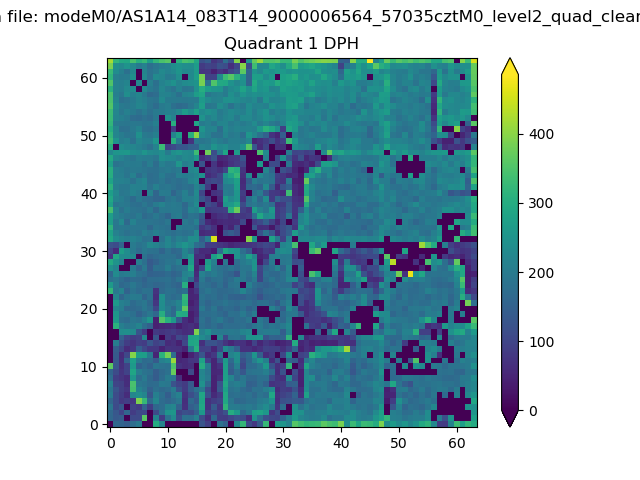 |
Quadrant B |
|---|---|---|---|
| Quadrant D | 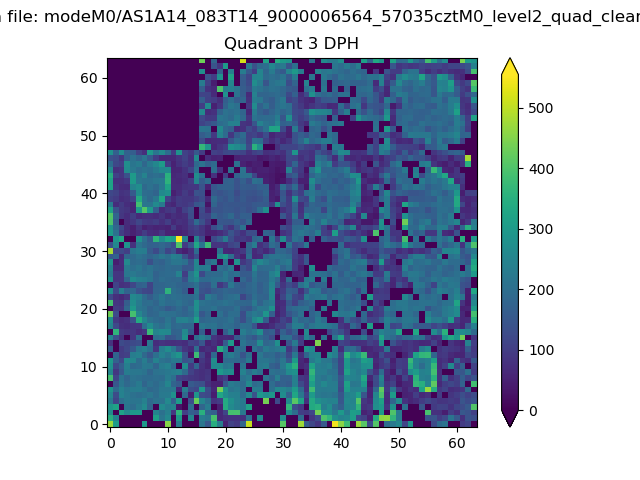 |
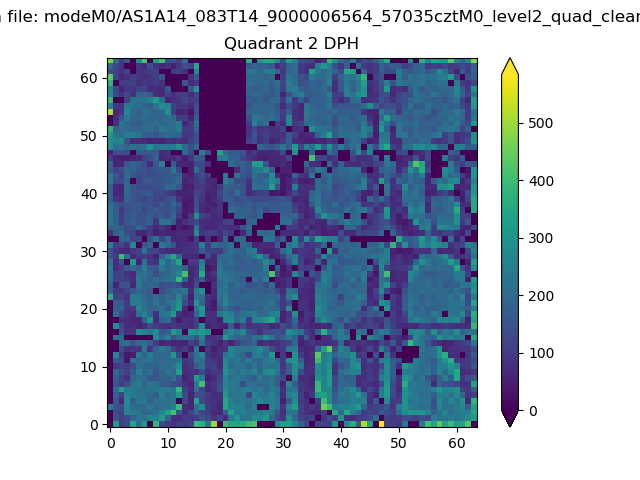 |
Quadrant C |
| Plot type | Count rate plots | Images |
|---|---|---|
| Comparison with Poisson distribution Blue bars denote a histogram of data divided into 1 sec bins. Red curve is a Poisson curve with rate = median count rate of data. |
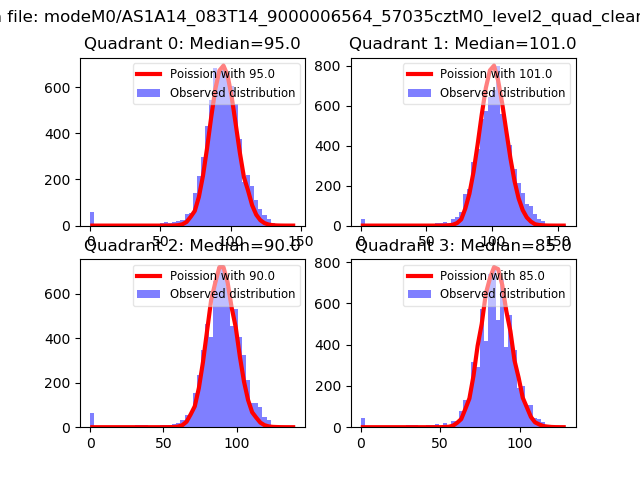 |
 |
| Quadrant-wise count rates Data is divided into 100 sec bins |
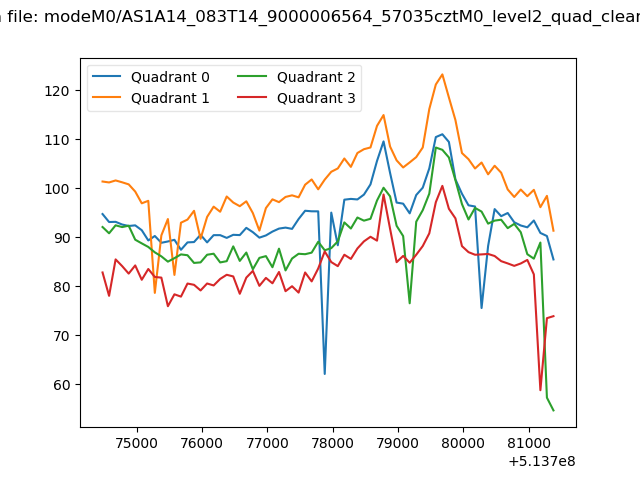 |
|
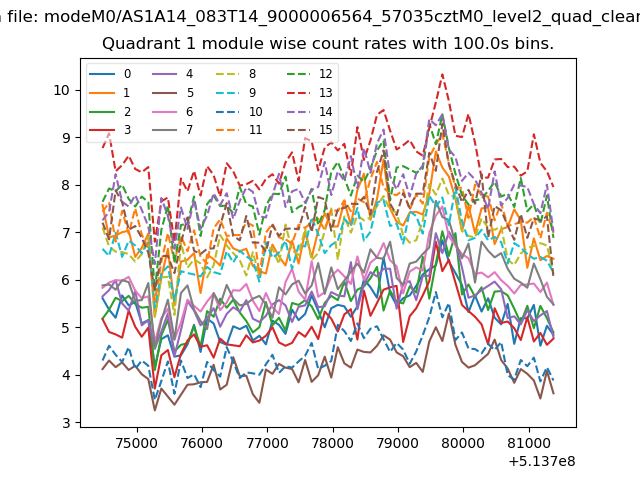
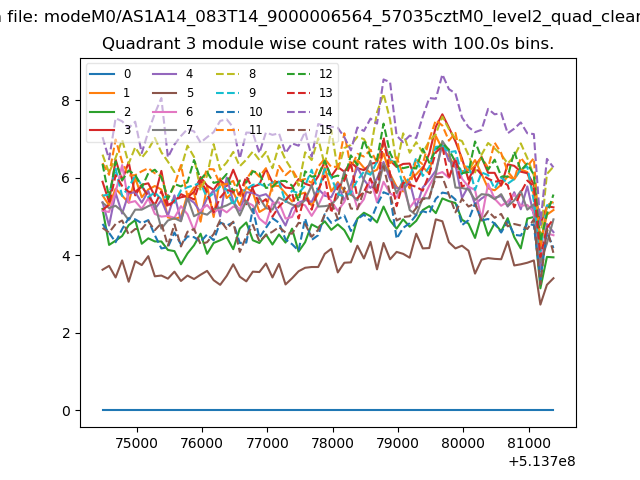
| Module-wise count rates for Quadrant A Data is divided into 100 sec bins |
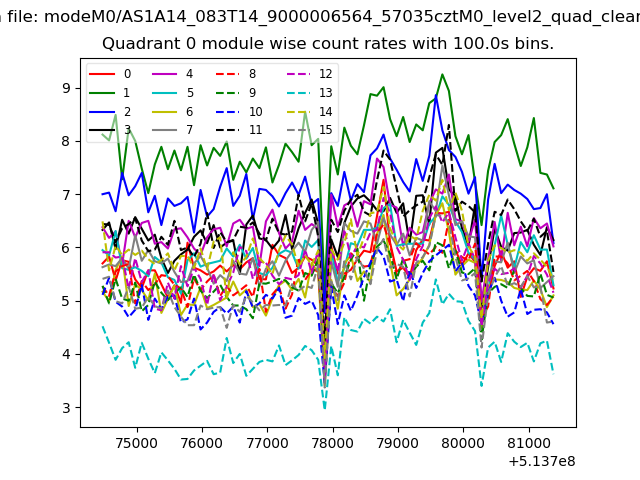 |
 |
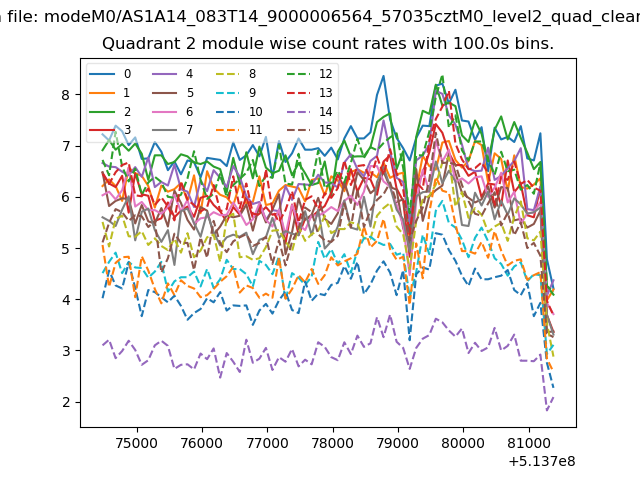
| Module-wise count rates for Quadrant B Data is divided into 100 sec bins |
 |
 |
| Module-wise count rates for Quadrant C Data is divided into 100 sec bins |
 |
 |
| Module-wise count rates for Quadrant D Data is divided into 100 sec bins |
 |
 |
| Parameter | Plot |
|---|---|
| CZT HV Monitor | 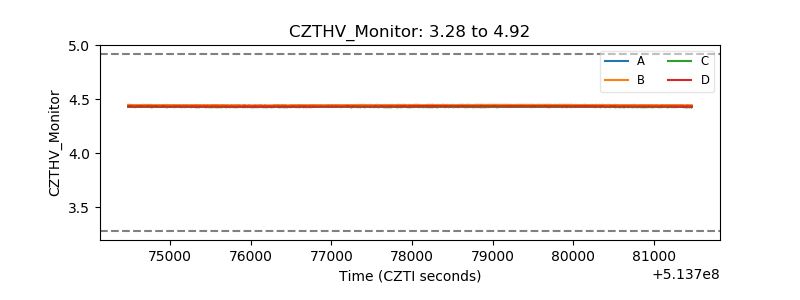 |
| D_VDD | 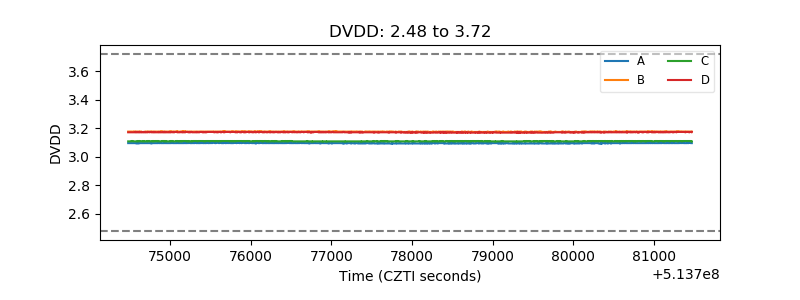 |
| Temperature 1 | 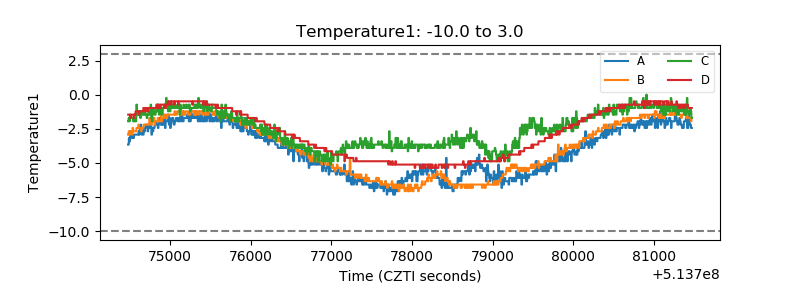 |
| Veto HV Monitor | 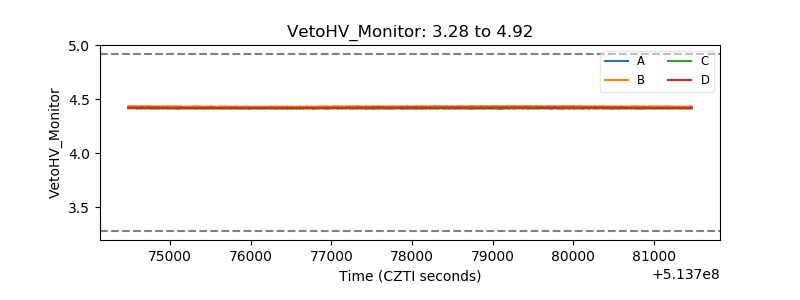 |
| Veto LLD | 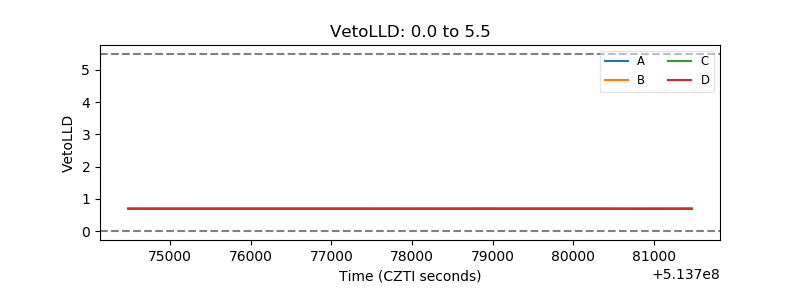 |
| Alpha Counter | 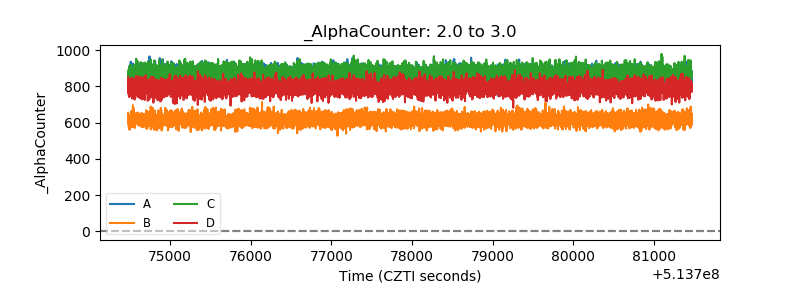 |
| _CPM_Rate | 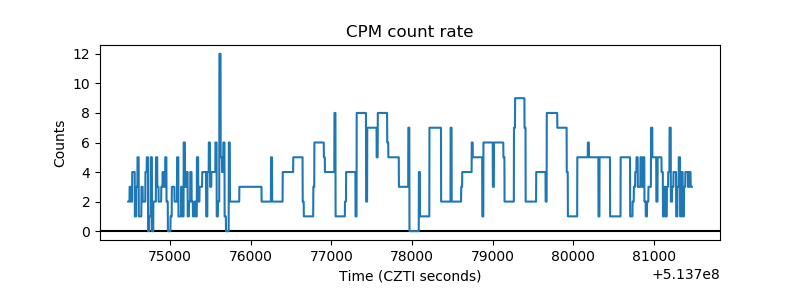 |
| CZT Counter | 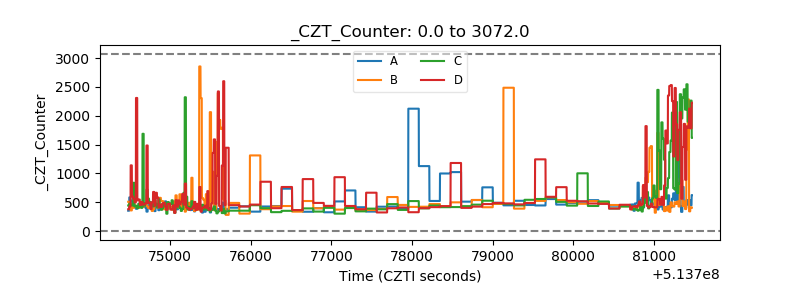 |
| +2.5 Volts monitor | 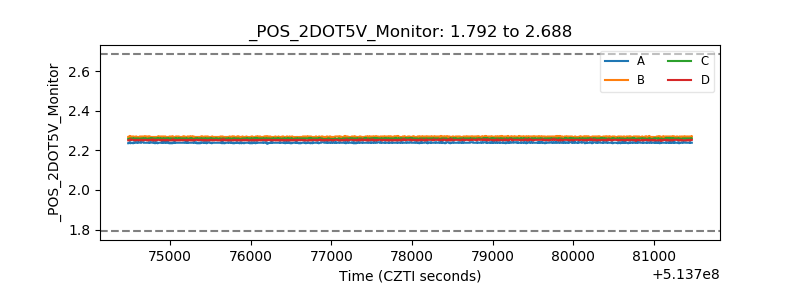 |
| +5 Volts monitor |  |
| _ROLL_ROT | 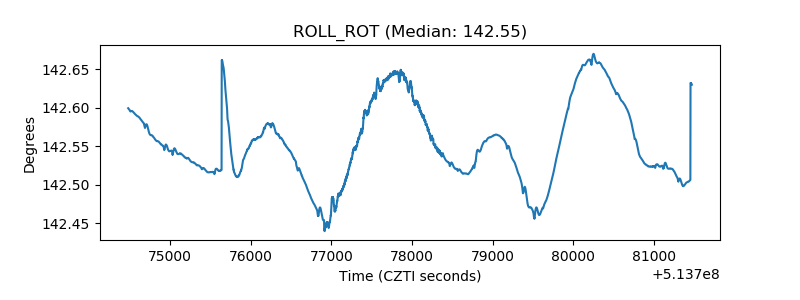 |
| _Roll_DEC | 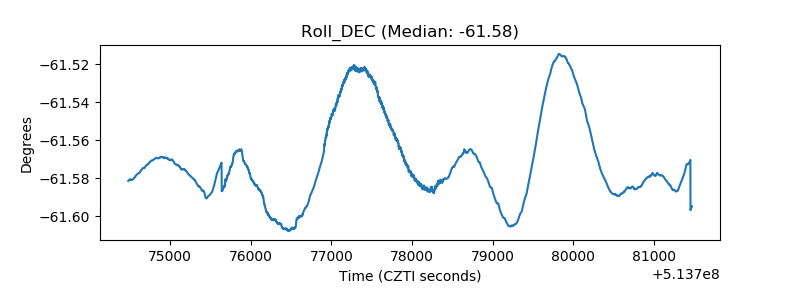 |
| _Roll_RA | 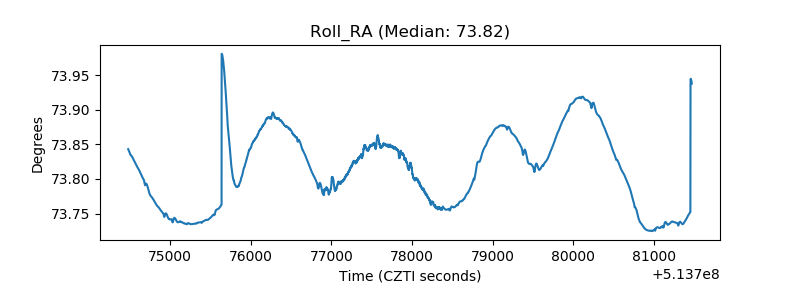 |
| Veto Counter | 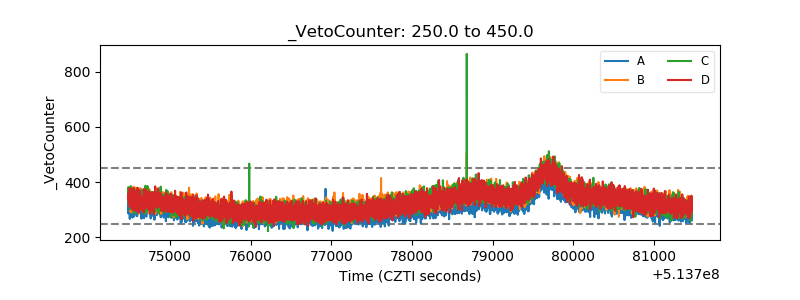 |