| Param | Original file | Final file |
|---|---|---|
| Filename | modeM0/AS1A14_083T14_9000006564_57039cztM0_level2.fits | modeM0/AS1A14_083T14_9000006564_57039cztM0_level2_quad_clean.evt |
| Size (bytes) | 1,630,926,720 | 344,142,720 |
| Size | 1.5 GB | 328.2 MB |
| Events in quadrant A | 17,157,139 | 2,194,434 |
| Events in quadrant B | 13,356,108 | 2,414,551 |
| Events in quadrant C | 11,939,611 | 2,154,989 |
| Events in quadrant D | 16,049,442 | 1,991,773 |
| Mode SS | |||
|---|---|---|---|
| Quadrant | BADHDUFLAG | Total packets | Discarded packets |
| A | 0 | 492 | 0 |
| B | 0 | 492 | 0 |
| C | 0 | 492 | 0 |
| D | 0 | 492 | 0 |
| Mode M9 | |||
|---|---|---|---|
| Quadrant | BADHDUFLAG | Total packets | Discarded packets |
| A | 0 | 15 | 0 |
| B | 0 | 15 | 0 |
| C | 0 | 15 | 0 |
| D | 0 | 15 | 0 |
| Mode M0 | |||
|---|---|---|---|
| Quadrant | BADHDUFLAG | Total packets | Discarded packets |
| A | 0 | 67908 | 3 |
| B | 0 | 56948 | 3 |
| C | 0 | 53861 | 3 |
| D | 0 | 64834 | 3 |
| Quadrant | Total seconds | Saturated seconds | Saturation percentage |
|---|---|---|---|
| A | 24170 | 1288 | 5.328920% |
| B | 24170 | 718 | 2.970625% |
| C | 24170 | 420 | 1.737691% |
| D | 24170 | 912 | 3.773273% |
Noise dominated data is calculated using 1-second bins in cleaned event files. If a bin has >2000 counts, and if more than 50% of those come from <1% of pixels, then it is considered to be noise-dominated and hence unusable.
| Quadrant | # 1 sec bins | Bins with >0 counts | Bins with >2000 counts | High rate bins dominated by noise | Noise dominated (total time) | Noise dominated (detector-on time) | Marked lightcurve |
|---|---|---|---|---|---|---|---|
| A | 25760 | 24173 | 863 | 863 | 3.35% | 3.57% | 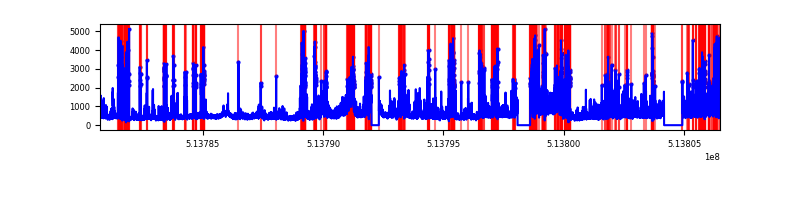 |
| B | 25760 | 24173 | 376 | 376 | 1.46% | 1.56% | 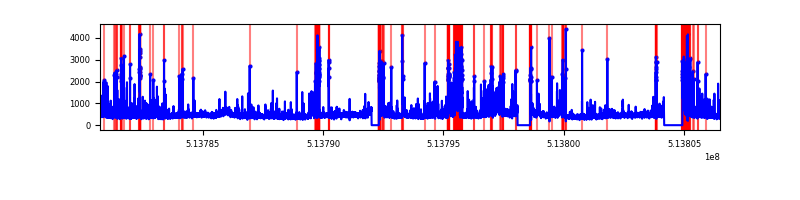 |
| C | 25760 | 24173 | 332 | 332 | 1.29% | 1.37% | 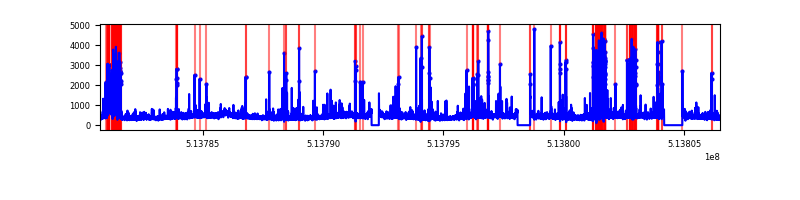 |
| D | 25760 | 24173 | 829 | 829 | 3.22% | 3.43% | 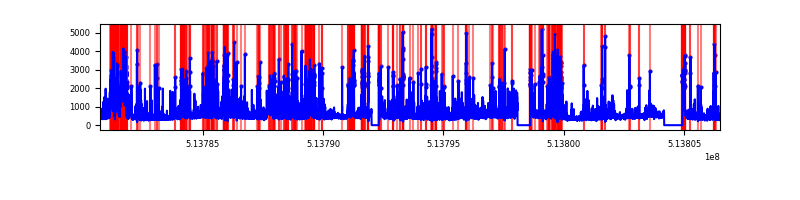 |
Top three noisy pixels from each quadrant. If the there are fewer than three noisy pixels in the level2.evt file, extra rows are filled as -1
| Pixel properties | Quadrant properties | ||||||
|---|---|---|---|---|---|---|---|
| Quadrant | DetID | PixID | Counts | Sigma | Mean | Median | Sigma |
| A | 4 | 249 | 4378549 | 7013.54 | 2531 | 2468 | 623.9 |
| A | 4 | 159 | 1073522 | 1716.58 | 2531 | 2468 | 623.9 |
| A | 4 | 13 | 571936 | 912.69 | 2531 | 2468 | 623.9 |
| B | 5 | 185 | 1637455 | 3043.25 | 2528 | 2435 | 537.3 |
| B | 0 | 213 | 535777 | 992.7 | 2528 | 2435 | 537.3 |
| B | 10 | 16 | 453593 | 839.74 | 2528 | 2435 | 537.3 |
| C | 12 | 252 | 801229 | 1181.53 | 2484 | 2466 | 676.0 |
| C | 15 | 198 | 518741 | 763.67 | 2484 | 2466 | 676.0 |
| C | 14 | 254 | 407143 | 598.6 | 2484 | 2466 | 676.0 |
| D | 12 | 33 | 1538477 | 2221.21 | 2445 | 2339 | 691.6 |
| D | 2 | 249 | 1047958 | 1511.93 | 2445 | 2339 | 691.6 |
| D | 12 | 251 | 867324 | 1250.74 | 2445 | 2339 | 691.6 |
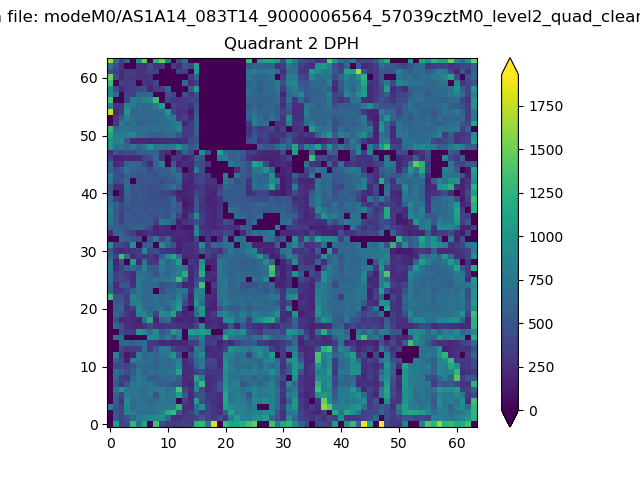
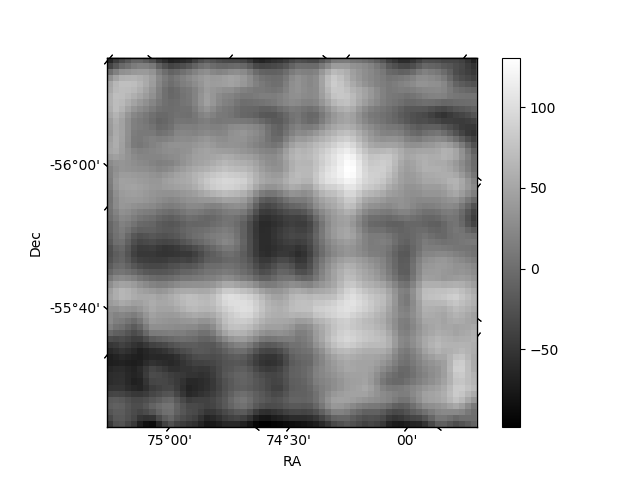
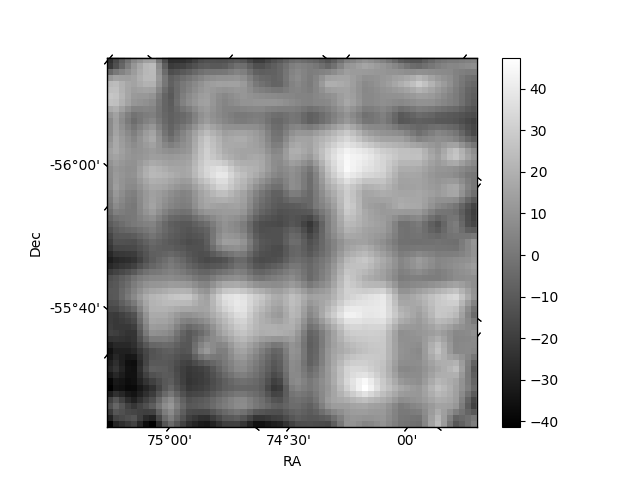
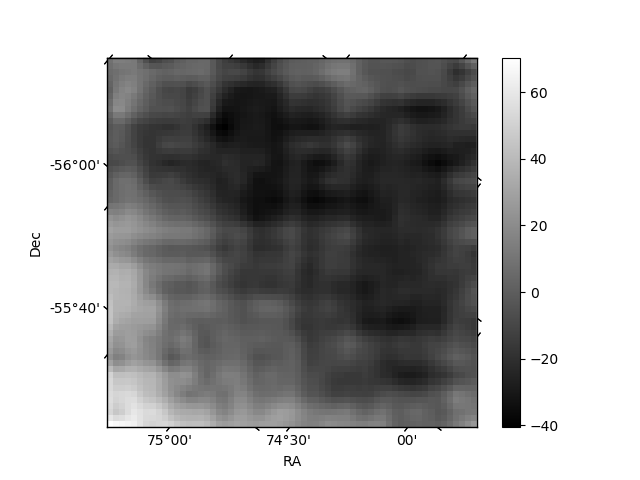
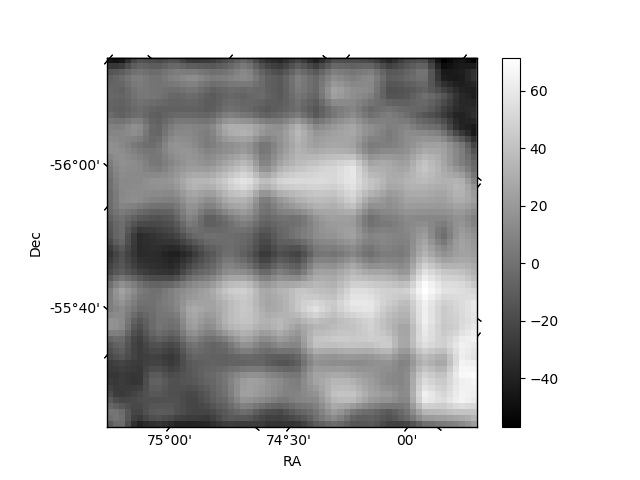
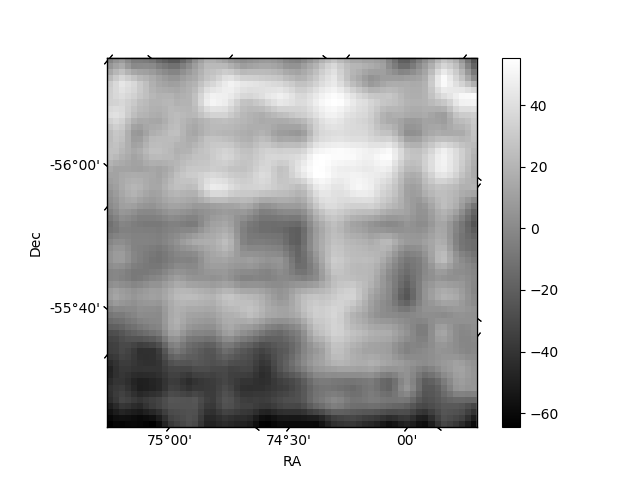
Histogram calculated using DETX and DETY for each event in the final _common_clean file
| Quadrant A | 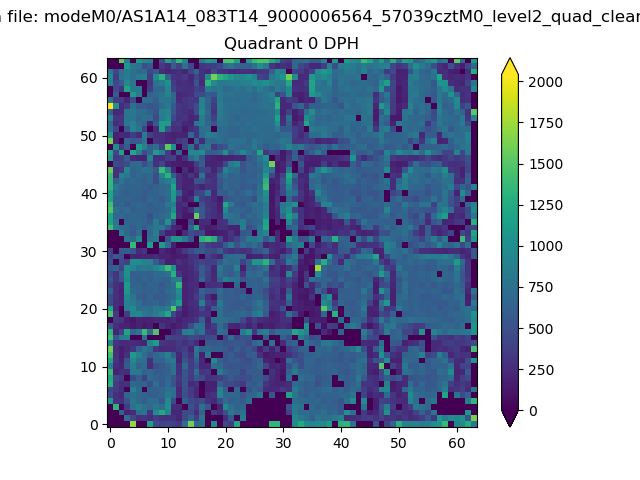 |
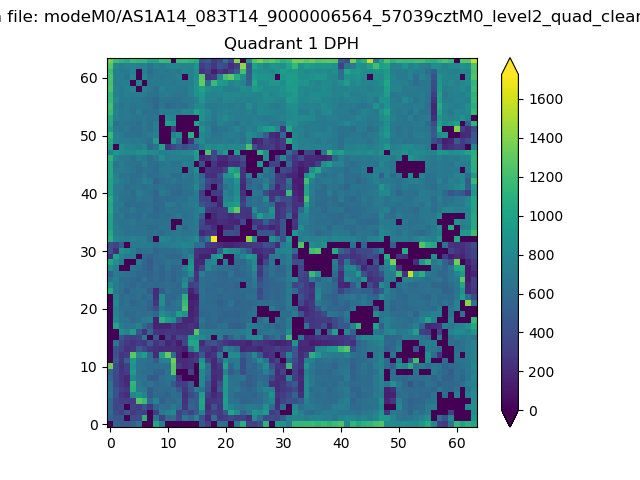 |
Quadrant B |
|---|---|---|---|
| Quadrant D | 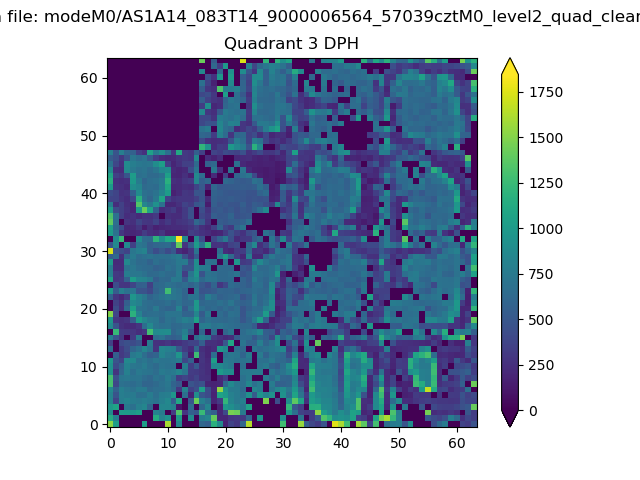 |
 |
Quadrant C |
| Plot type | Count rate plots | Images |
|---|---|---|
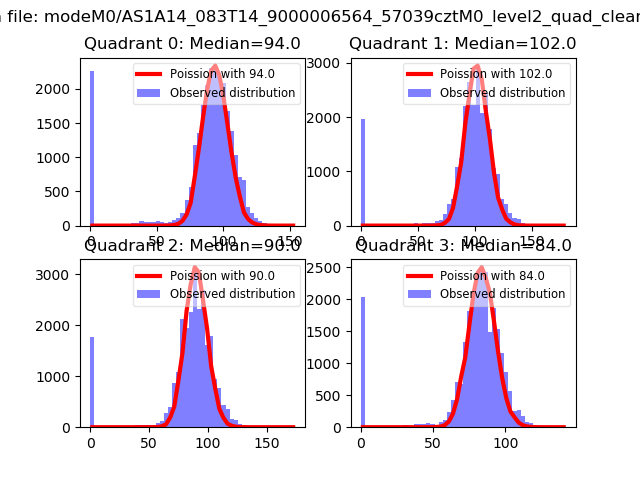
| Comparison with Poisson distribution Blue bars denote a histogram of data divided into 1 sec bins. Red curve is a Poisson curve with rate = median count rate of data. |
 |
 |
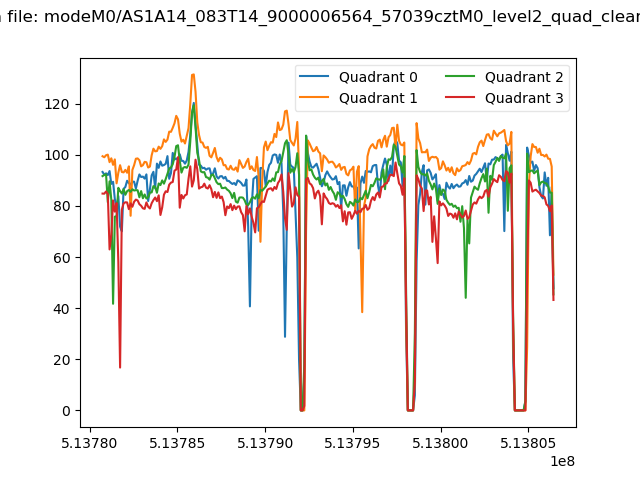
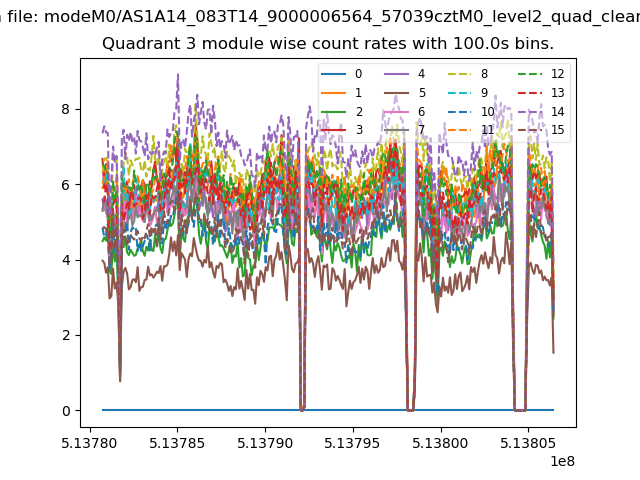
| Quadrant-wise count rates Data is divided into 100 sec bins |
 |
|
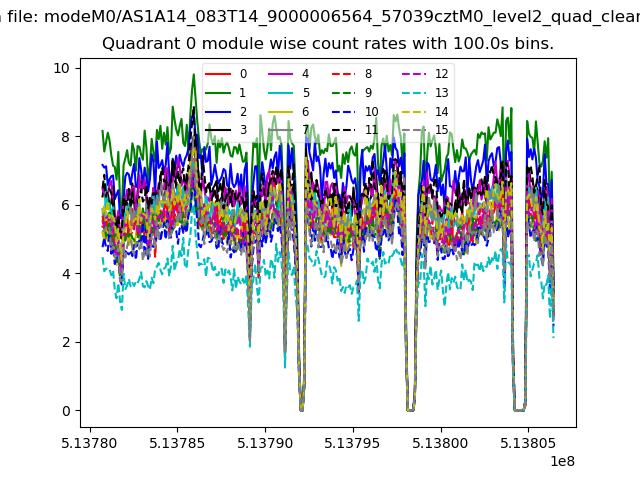
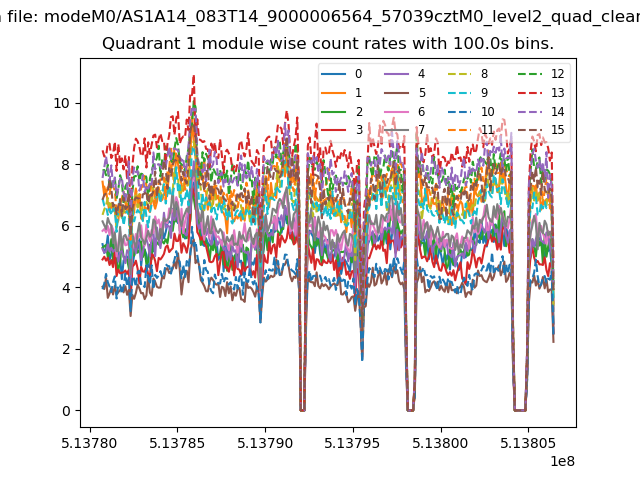
| Module-wise count rates for Quadrant A Data is divided into 100 sec bins |
 |
 |
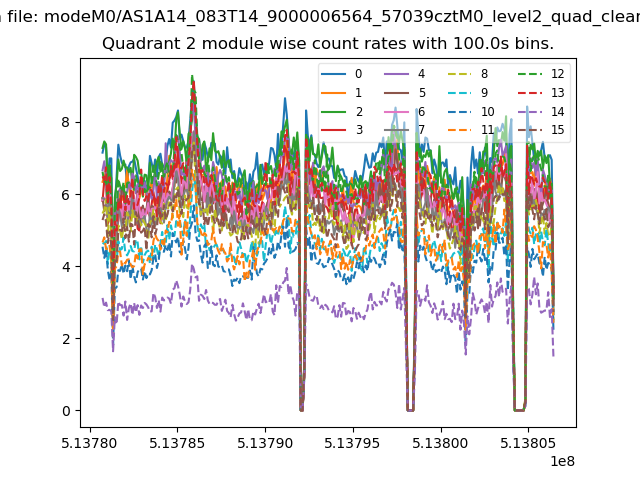
| Module-wise count rates for Quadrant B Data is divided into 100 sec bins |
 |
 |
| Module-wise count rates for Quadrant C Data is divided into 100 sec bins |
 |
 |
| Module-wise count rates for Quadrant D Data is divided into 100 sec bins |
 |
 |
| Parameter | Plot |
|---|---|
| CZT HV Monitor | 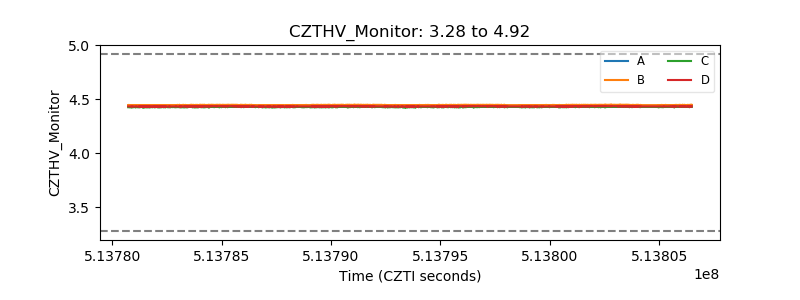 |
| D_VDD | 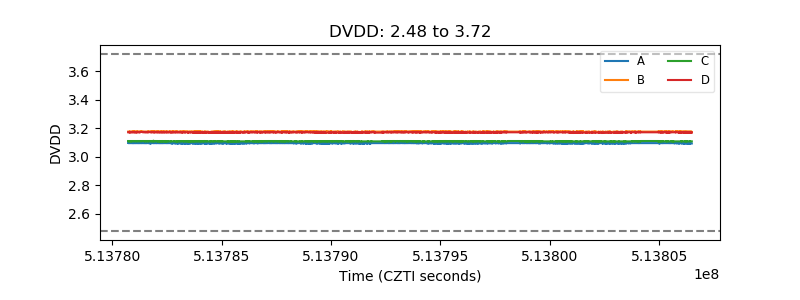 |
| Temperature 1 | 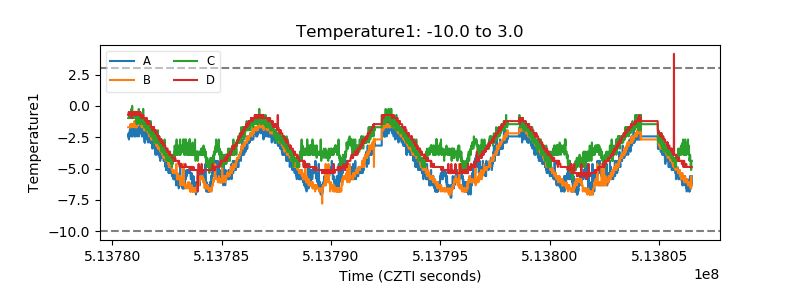 |
| Veto HV Monitor | 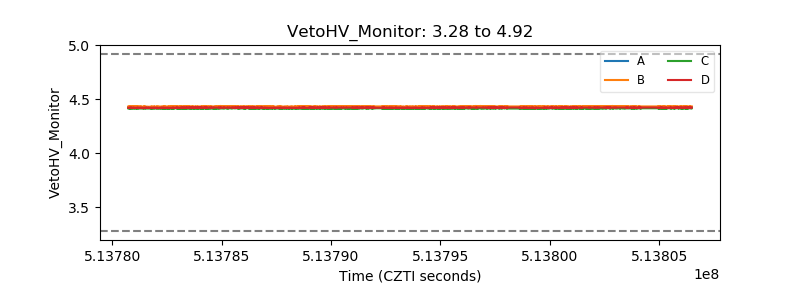 |
| Veto LLD | 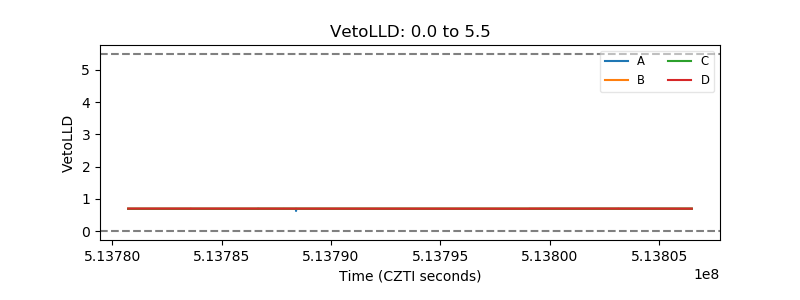 |
| Alpha Counter | 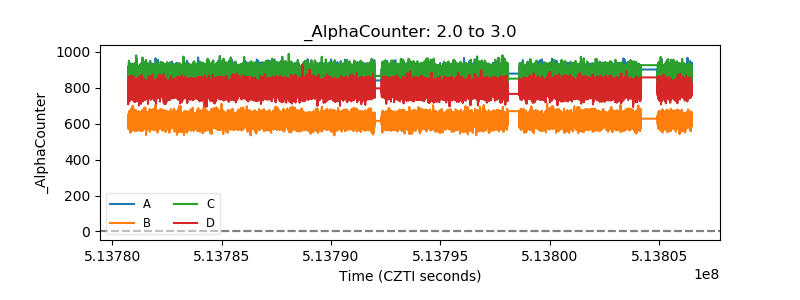 |
| _CPM_Rate | 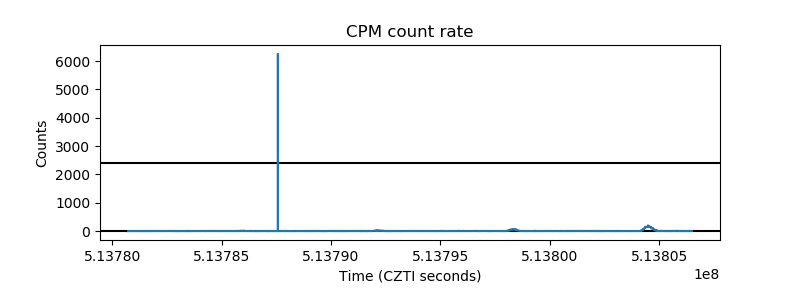 |
| CZT Counter | 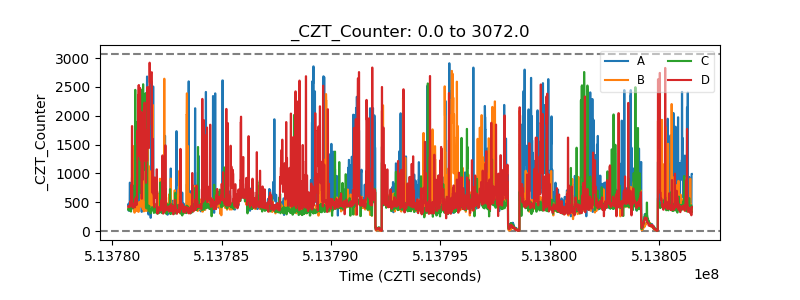 |
| +2.5 Volts monitor |  |
| +5 Volts monitor | 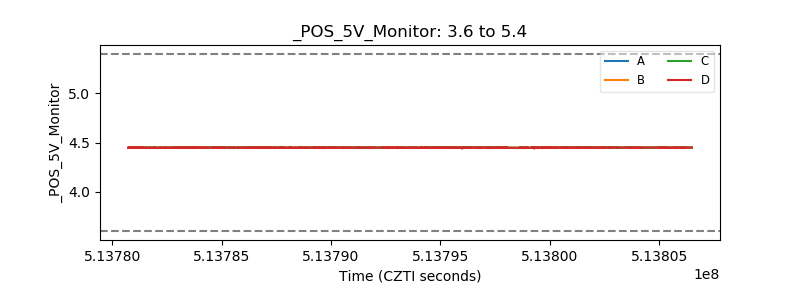 |
| _ROLL_ROT | 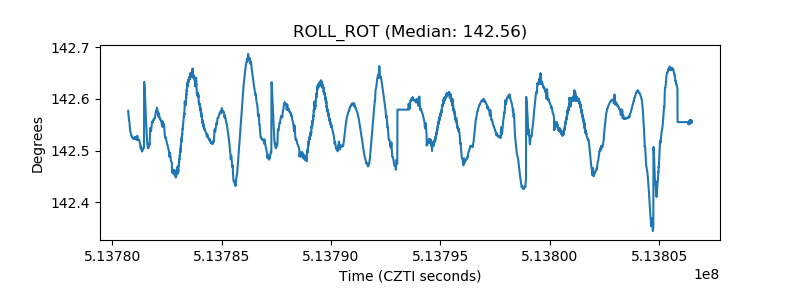 |
| _Roll_DEC | 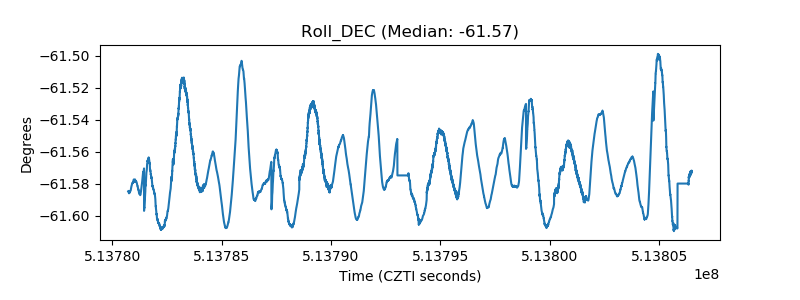 |
| _Roll_RA | 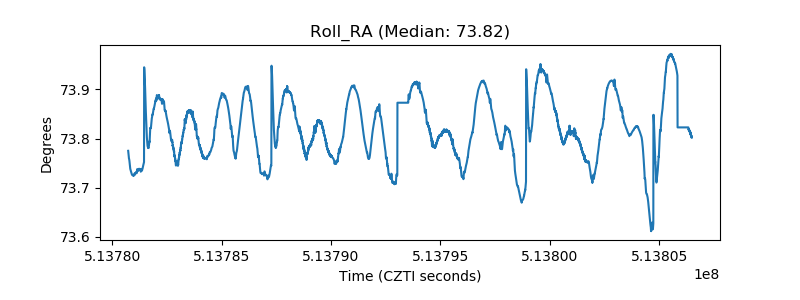 |
| Veto Counter | 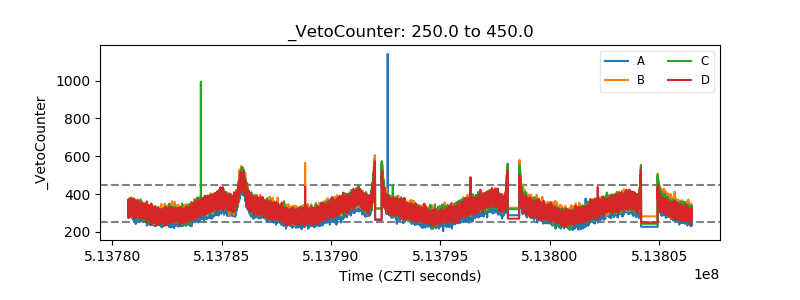 |