| Param | Original file | Final file |
|---|---|---|
| Filename | modeM0/AS1A14_083T14_9000006564_57040cztM0_level2.fits | modeM0/AS1A14_083T14_9000006564_57040cztM0_level2_quad_clean.evt |
| Size (bytes) | 520,225,920 | 95,564,160 |
| Size | 496.1 MB | 91.1 MB |
| Events in quadrant A | 6,756,798 | 594,618 |
| Events in quadrant B | 4,424,005 | 658,619 |
| Events in quadrant C | 3,540,256 | 606,599 |
| Events in quadrant D | 4,009,623 | 560,782 |
| Mode SS | |||
|---|---|---|---|
| Quadrant | BADHDUFLAG | Total packets | Discarded packets |
| A | 0 | 138 | 0 |
| B | 0 | 138 | 0 |
| C | 0 | 138 | 0 |
| D | 0 | 138 | 0 |
| Mode M9 | |||
|---|---|---|---|
| Quadrant | BADHDUFLAG | Total packets | Discarded packets |
| A | 0 | 12 | 0 |
| B | 0 | 13 | 0 |
| C | 0 | 13 | 0 |
| D | 0 | 13 | 0 |
| Mode M0 | |||
|---|---|---|---|
| Quadrant | BADHDUFLAG | Total packets | Discarded packets |
| A | 0 | 24836 | 2 |
| B | 0 | 17856 | 2 |
| C | 0 | 15403 | 2 |
| D | 0 | 16697 | 2 |
| Quadrant | Total seconds | Saturated seconds | Saturation percentage |
|---|---|---|---|
| A | 6784 | 698 | 10.288915% |
| B | 6784 | 441 | 6.500590% |
| C | 6783 | 47 | 0.692909% |
| D | 6783 | 169 | 2.491523% |
Noise dominated data is calculated using 1-second bins in cleaned event files. If a bin has >2000 counts, and if more than 50% of those come from <1% of pixels, then it is considered to be noise-dominated and hence unusable.
| Quadrant | # 1 sec bins | Bins with >0 counts | Bins with >2000 counts | High rate bins dominated by noise | Noise dominated (total time) | Noise dominated (detector-on time) | Marked lightcurve |
|---|---|---|---|---|---|---|---|
| A | 7699 | 6785 | 582 | 582 | 7.56% | 8.58% | 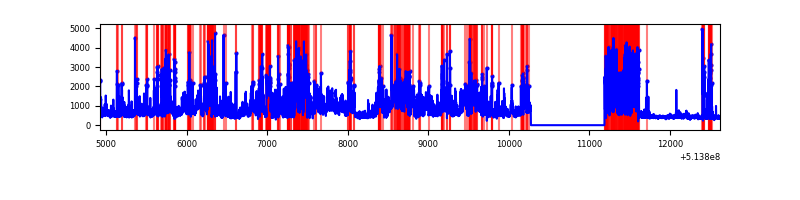 |
| B | 7699 | 6785 | 245 | 245 | 3.18% | 3.61% | 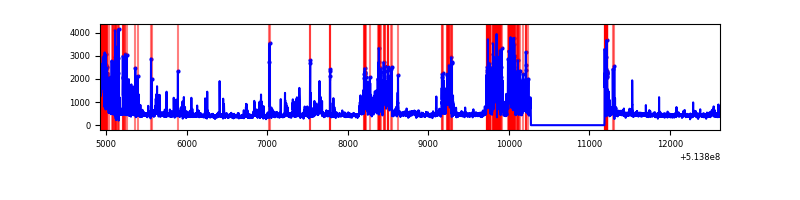 |
| C | 7698 | 6784 | 27 | 27 | 0.35% | 0.40% | 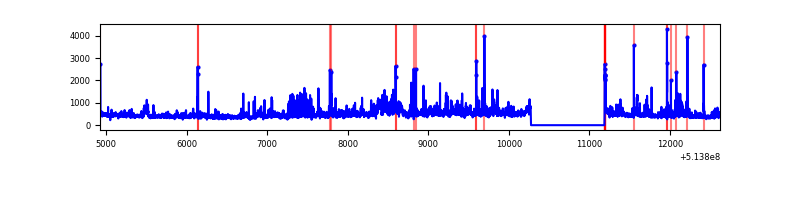 |
| D | 7698 | 6784 | 118 | 118 | 1.53% | 1.74% | 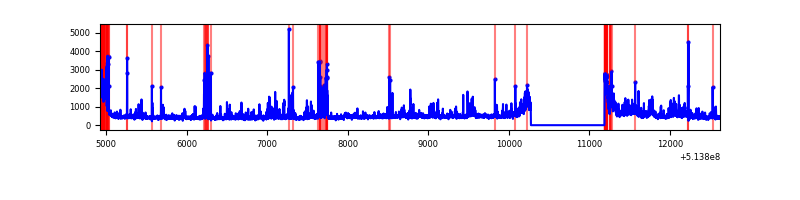 |
Top three noisy pixels from each quadrant. If the there are fewer than three noisy pixels in the level2.evt file, extra rows are filled as -1
| Pixel properties | Quadrant properties | ||||||
|---|---|---|---|---|---|---|---|
| Quadrant | DetID | PixID | Counts | Sigma | Mean | Median | Sigma |
| A | 4 | 249 | 3507646 | 20457.71 | 689 | 672 | 171.4 |
| A | 4 | 13 | 298756 | 1738.85 | 689 | 672 | 171.4 |
| A | 3 | 14 | 147352 | 855.65 | 689 | 672 | 171.4 |
| B | 5 | 185 | 983067 | 6582.2 | 693 | 669 | 149.3 |
| B | 10 | 16 | 386478 | 2584.97 | 693 | 669 | 149.3 |
| B | 0 | 63 | 99452 | 661.86 | 693 | 669 | 149.3 |
| C | 13 | 3 | 224959 | 1185.46 | 691 | 687 | 189.2 |
| C | 9 | 38 | 205347 | 1081.8 | 691 | 687 | 189.2 |
| C | 1 | 16 | 169448 | 892.04 | 691 | 687 | 189.2 |
| D | 15 | 142 | 647622 | 3330.91 | 679 | 645 | 194.2 |
| D | 2 | 249 | 197042 | 1011.13 | 679 | 645 | 194.2 |
| D | 7 | 96 | 134915 | 691.28 | 679 | 645 | 194.2 |
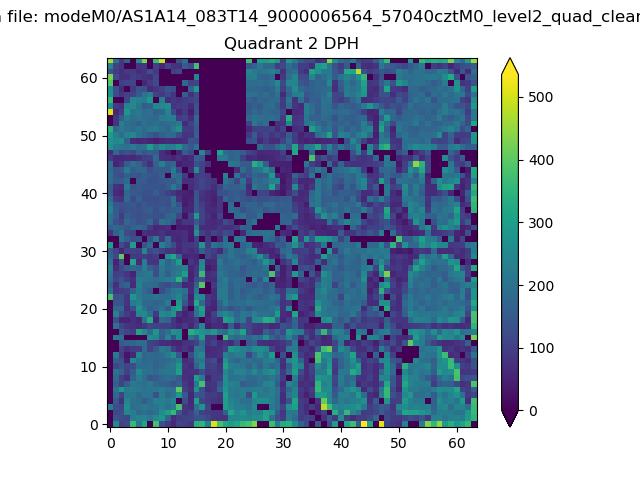
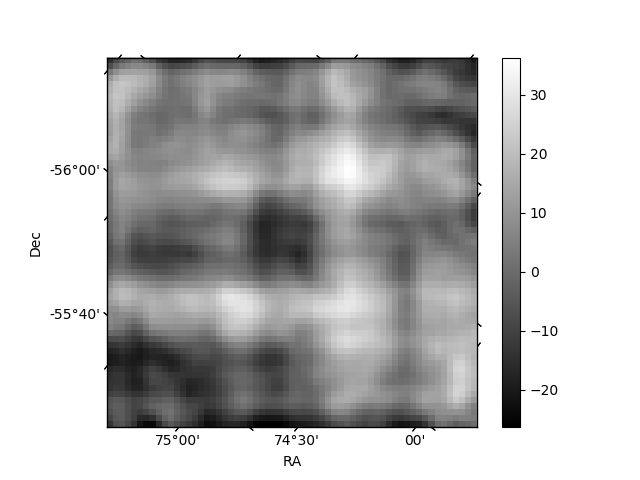
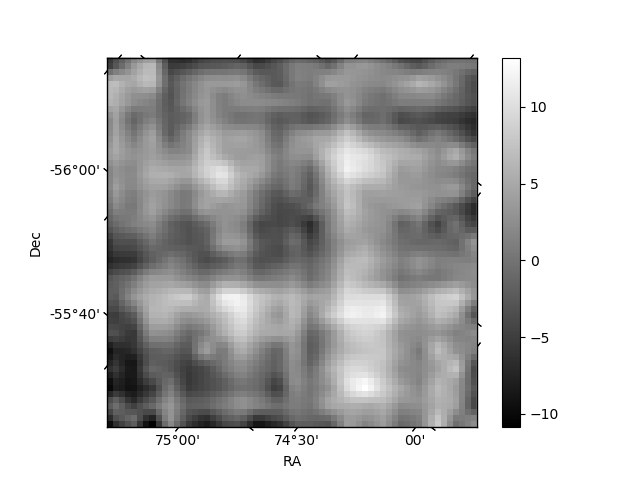
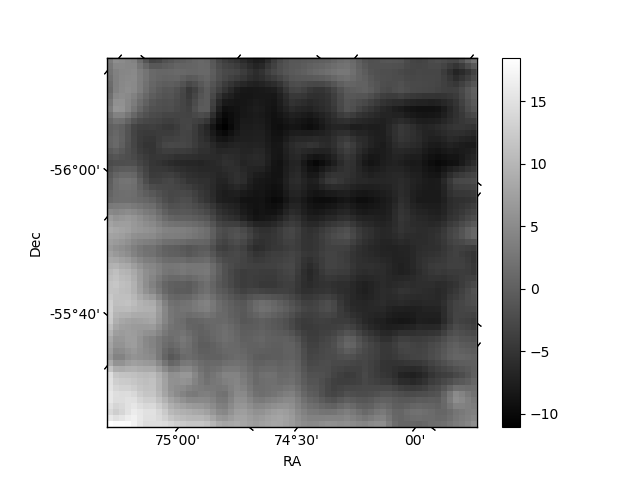
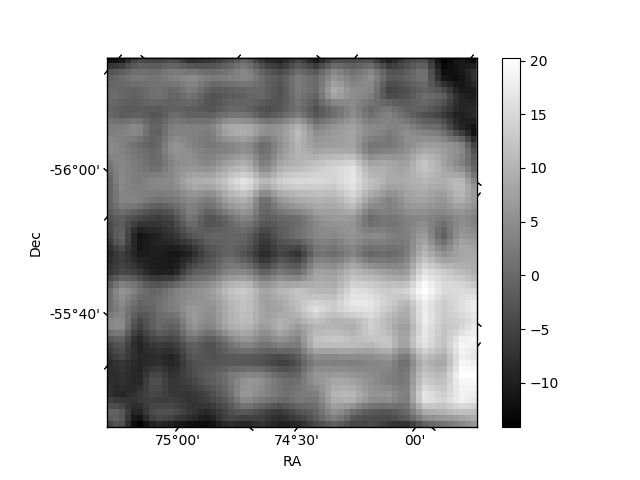
Histogram calculated using DETX and DETY for each event in the final _common_clean file
| Quadrant A | 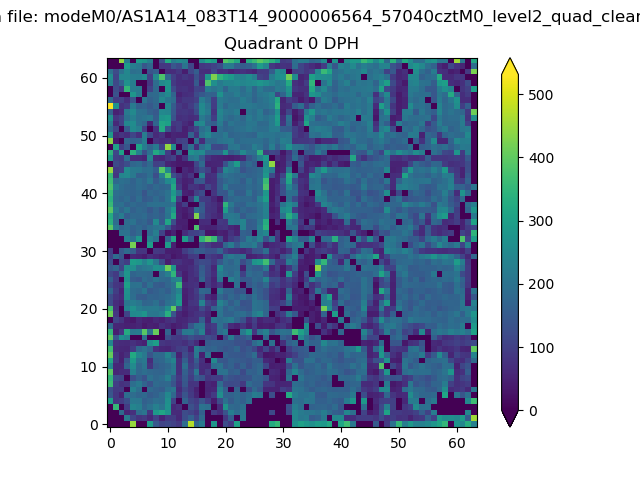 |
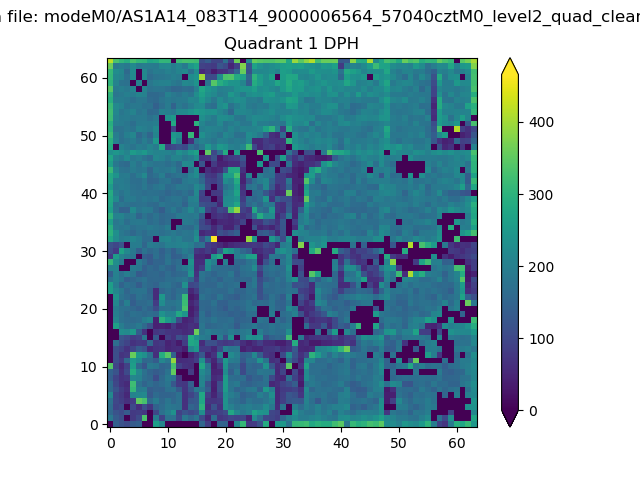 |
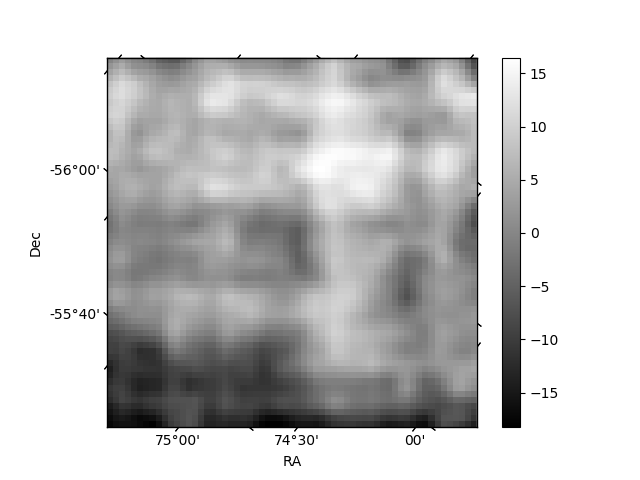
Quadrant B |
|---|---|---|---|
| Quadrant D | 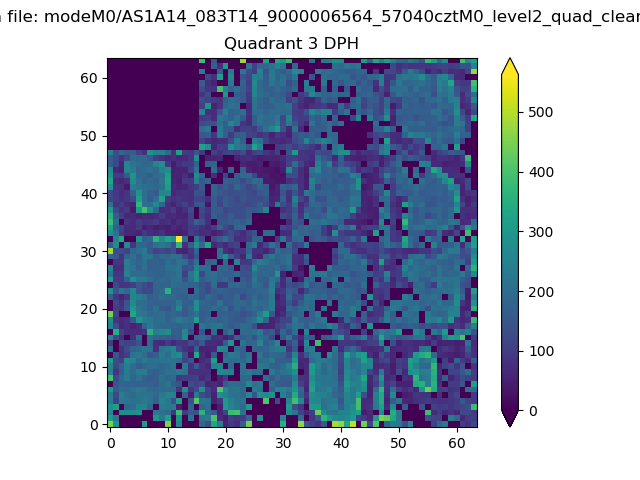 |
 |
Quadrant C |
| Plot type | Count rate plots | Images |
|---|---|---|
| Comparison with Poisson distribution Blue bars denote a histogram of data divided into 1 sec bins. Red curve is a Poisson curve with rate = median count rate of data. |
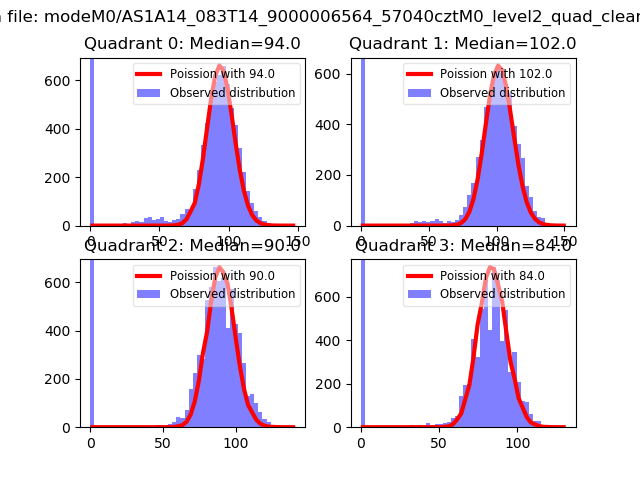 |
 |
| Quadrant-wise count rates Data is divided into 100 sec bins |
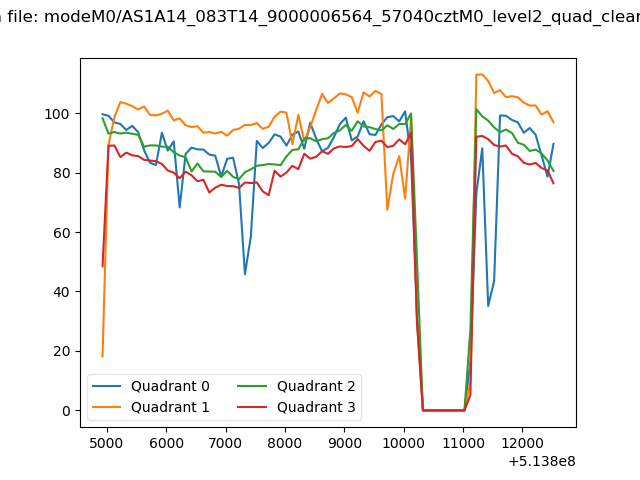 |
|
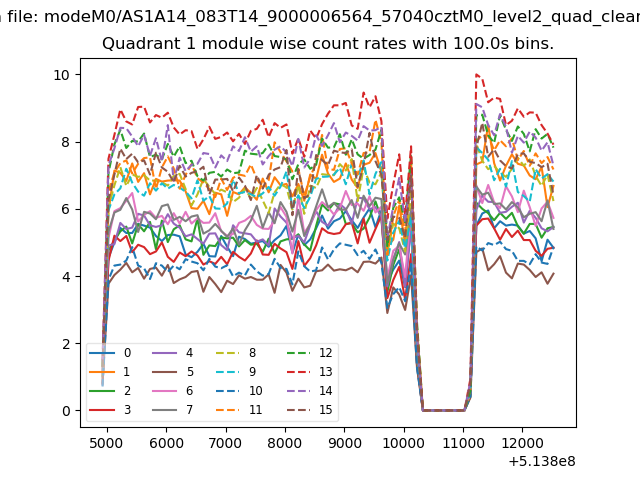
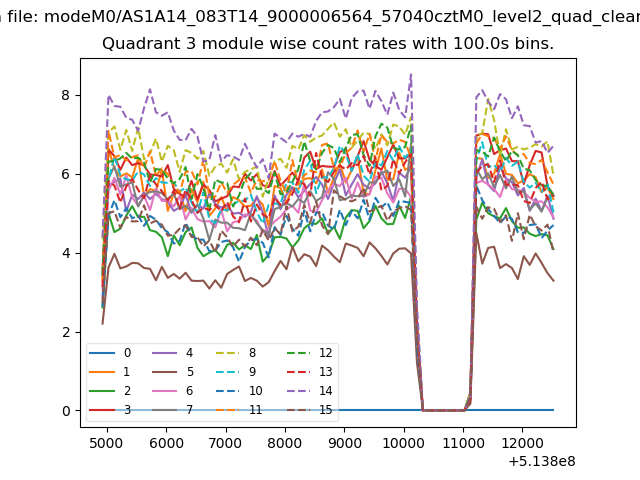
| Module-wise count rates for Quadrant A Data is divided into 100 sec bins |
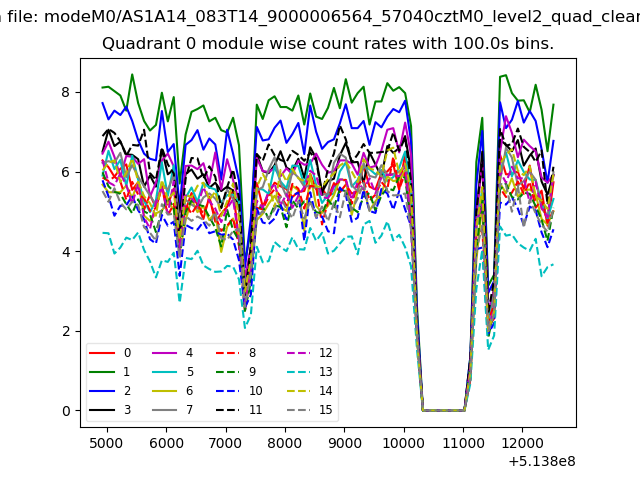 |
 |
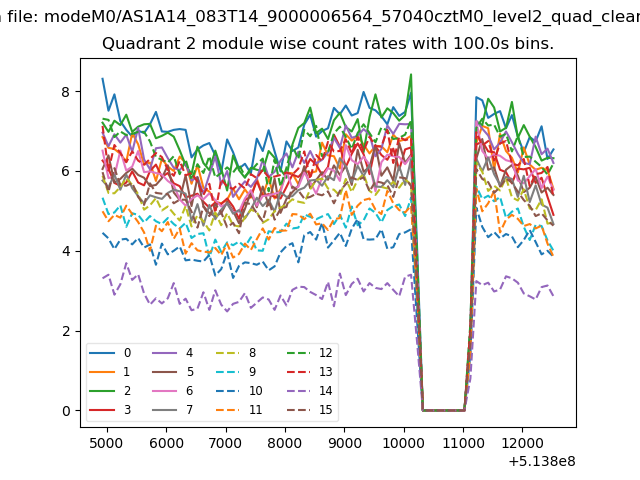
| Module-wise count rates for Quadrant B Data is divided into 100 sec bins |
 |
 |
| Module-wise count rates for Quadrant C Data is divided into 100 sec bins |
 |
 |
| Module-wise count rates for Quadrant D Data is divided into 100 sec bins |
 |
 |
| Parameter | Plot |
|---|---|
| CZT HV Monitor | 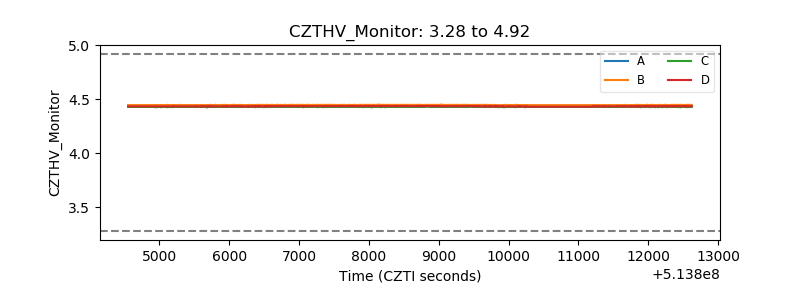 |
| D_VDD | 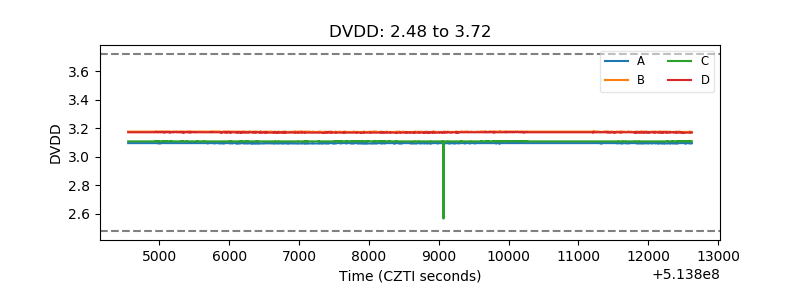 |
| Temperature 1 | 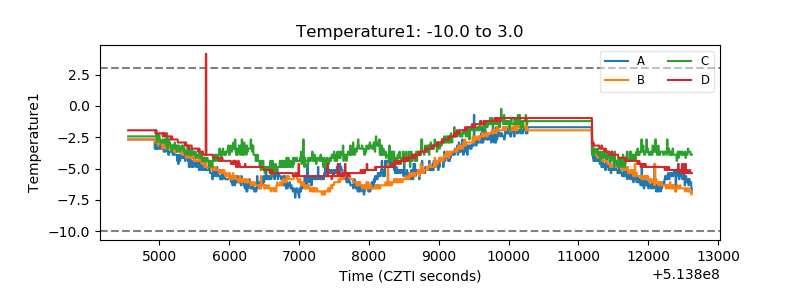 |
| Veto HV Monitor | 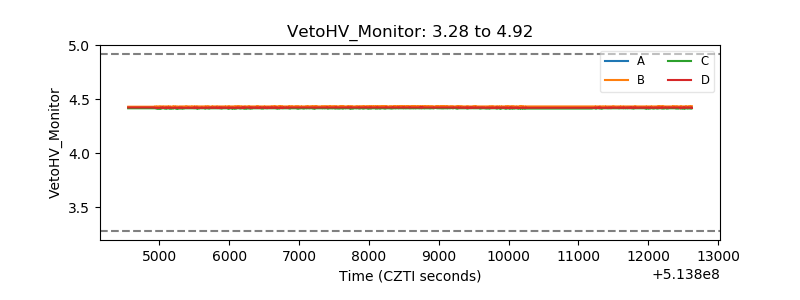 |
| Veto LLD | 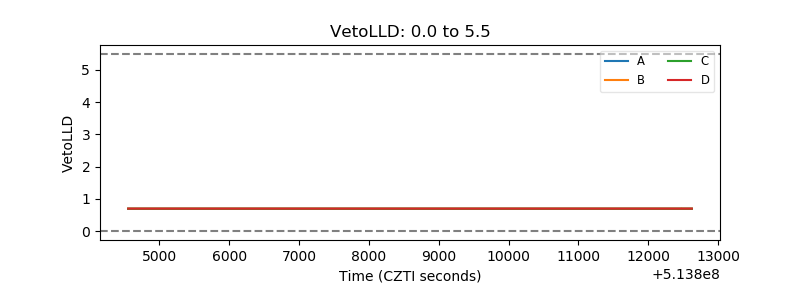 |
| Alpha Counter | 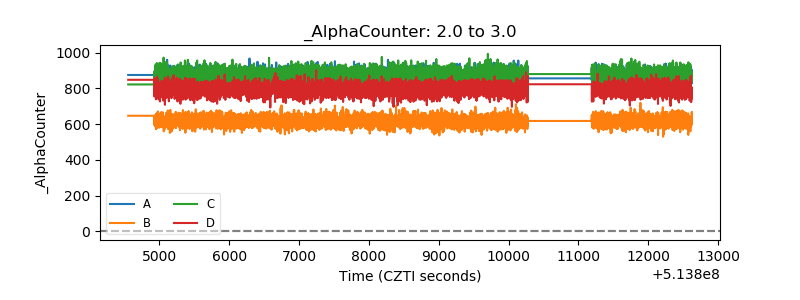 |
| _CPM_Rate | 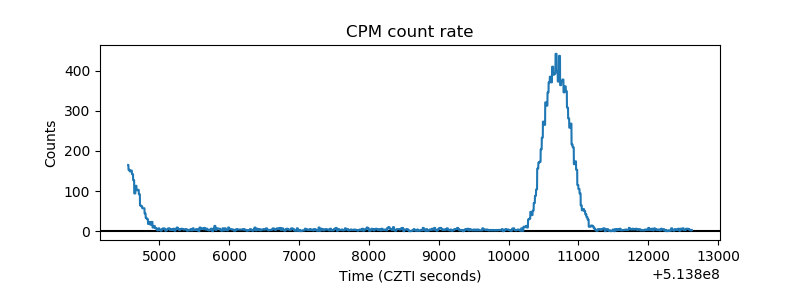 |
| CZT Counter | 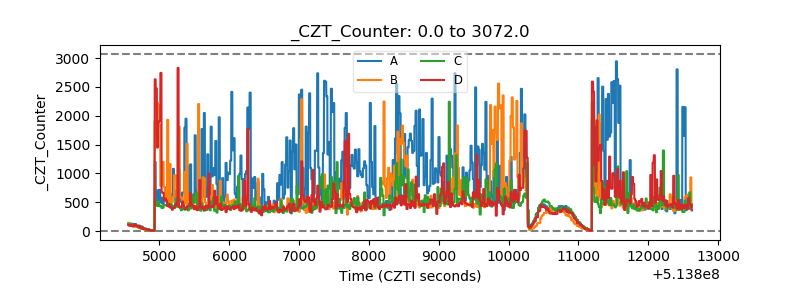 |
| +2.5 Volts monitor |  |
| +5 Volts monitor |  |
| _ROLL_ROT | 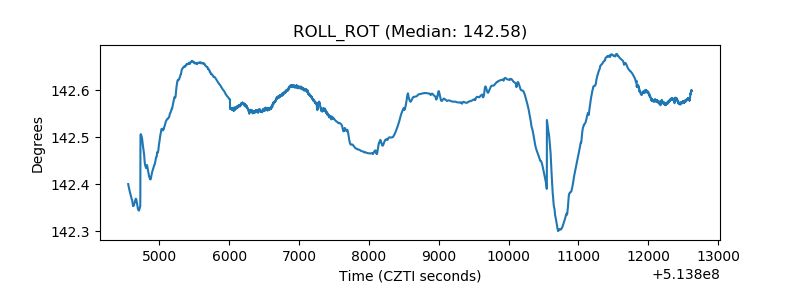 |
| _Roll_DEC | 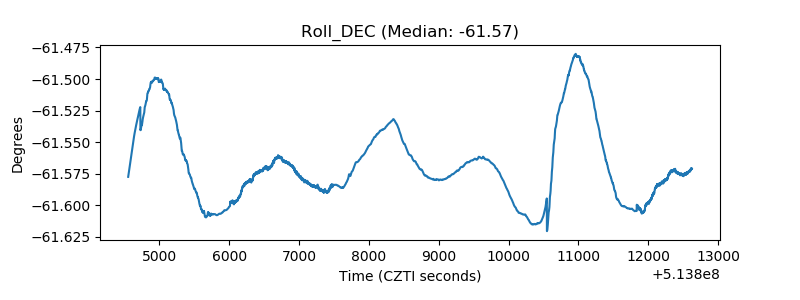 |
| _Roll_RA | 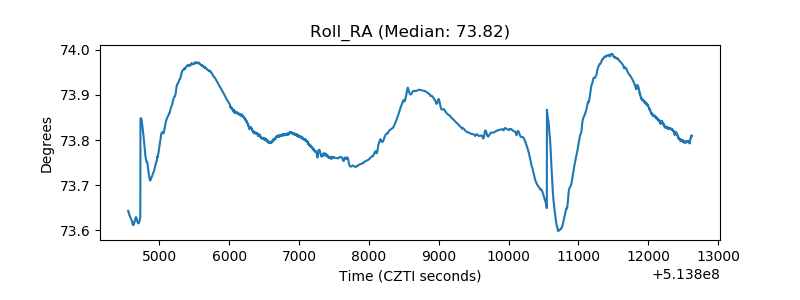 |
| Veto Counter | 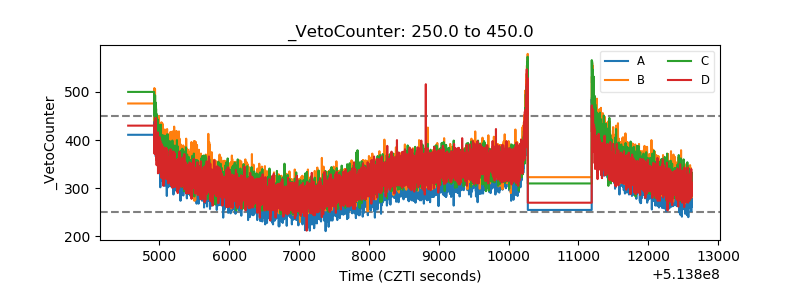 |