| Param | Original file | Final file |
|---|---|---|
| Filename | modeM0/AS1A14_083T14_9000006564_57042cztM0_level2.fits | modeM0/AS1A14_083T14_9000006564_57042cztM0_level2_quad_clean.evt |
| Size (bytes) | 546,560,640 | 89,424,000 |
| Size | 521.2 MB | 85.3 MB |
| Events in quadrant A | 5,575,835 | 540,476 |
| Events in quadrant B | 5,807,495 | 585,167 |
| Events in quadrant C | 3,320,312 | 592,683 |
| Events in quadrant D | 5,024,141 | 536,404 |
| Mode SS | |||
|---|---|---|---|
| Quadrant | BADHDUFLAG | Total packets | Discarded packets |
| A | 0 | 132 | 0 |
| B | 0 | 132 | 0 |
| C | 0 | 132 | 0 |
| D | 0 | 132 | 0 |
| Mode M9 | |||
|---|---|---|---|
| Quadrant | BADHDUFLAG | Total packets | Discarded packets |
| A | 0 | 15 | 0 |
| B | 0 | 16 | 0 |
| C | 0 | 16 | 0 |
| D | 0 | 16 | 0 |
| Mode M0 | |||
|---|---|---|---|
| Quadrant | BADHDUFLAG | Total packets | Discarded packets |
| A | 0 | 21100 | 2 |
| B | 0 | 21877 | 6 |
| C | 0 | 14396 | 2 |
| D | 0 | 19549 | 2 |
| Quadrant | Total seconds | Saturated seconds | Saturation percentage |
|---|---|---|---|
| A | 6491 | 1003 | 15.452165% |
| B | 6490 | 1058 | 16.302003% |
| C | 6490 | 56 | 0.862866% |
| D | 6490 | 307 | 4.730354% |
Noise dominated data is calculated using 1-second bins in cleaned event files. If a bin has >2000 counts, and if more than 50% of those come from <1% of pixels, then it is considered to be noise-dominated and hence unusable.
| Quadrant | # 1 sec bins | Bins with >0 counts | Bins with >2000 counts | High rate bins dominated by noise | Noise dominated (total time) | Noise dominated (detector-on time) | Marked lightcurve |
|---|---|---|---|---|---|---|---|
| A | 7541 | 6492 | 828 | 828 | 10.98% | 12.75% | 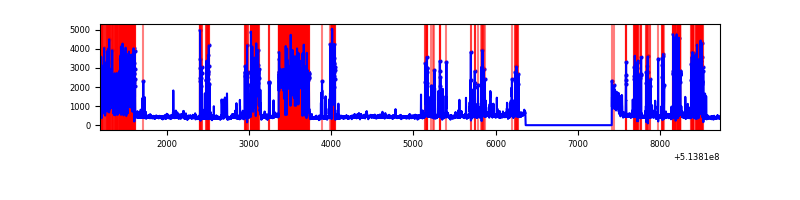 |
| B | 7540 | 6491 | 678 | 678 | 8.99% | 10.45% | 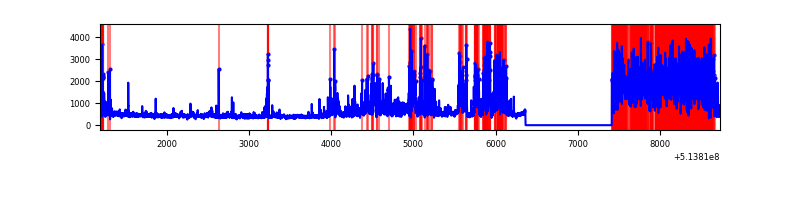 |
| C | 7540 | 6491 | 32 | 32 | 0.42% | 0.49% | 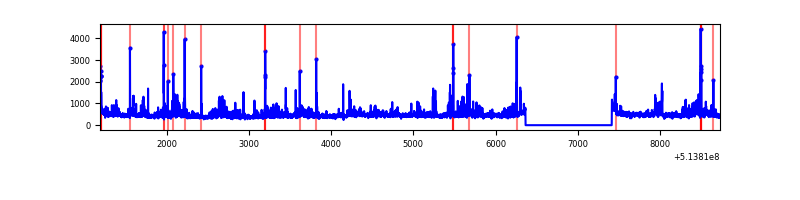 |
| D | 7540 | 6491 | 300 | 300 | 3.98% | 4.62% | 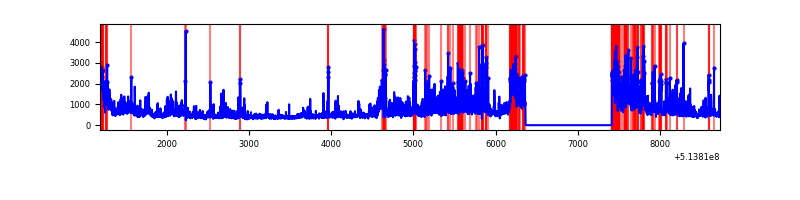 |
Top three noisy pixels from each quadrant. If the there are fewer than three noisy pixels in the level2.evt file, extra rows are filled as -1
| Pixel properties | Quadrant properties | ||||||
|---|---|---|---|---|---|---|---|
| Quadrant | DetID | PixID | Counts | Sigma | Mean | Median | Sigma |
| A | 4 | 249 | 1620101 | 10100.04 | 644 | 628 | 160.3 |
| A | 4 | 13 | 978274 | 6097.21 | 644 | 628 | 160.3 |
| A | 7 | 64 | 195810 | 1217.28 | 644 | 628 | 160.3 |
| B | 5 | 185 | 2776399 | 20161.9 | 648 | 624 | 137.7 |
| B | 10 | 16 | 223888 | 1621.68 | 648 | 624 | 137.7 |
| B | 0 | 63 | 120998 | 874.34 | 648 | 624 | 137.7 |
| C | 1 | 16 | 223869 | 1217.53 | 671 | 665 | 183.3 |
| C | 14 | 254 | 137462 | 746.2 | 671 | 665 | 183.3 |
| C | 9 | 38 | 116066 | 629.49 | 671 | 665 | 183.3 |
| D | 15 | 142 | 1777771 | 9530.18 | 650 | 618 | 186.5 |
| D | 7 | 96 | 317871 | 1701.3 | 650 | 618 | 186.5 |
| D | 3 | 12 | 53302 | 282.52 | 650 | 618 | 186.5 |
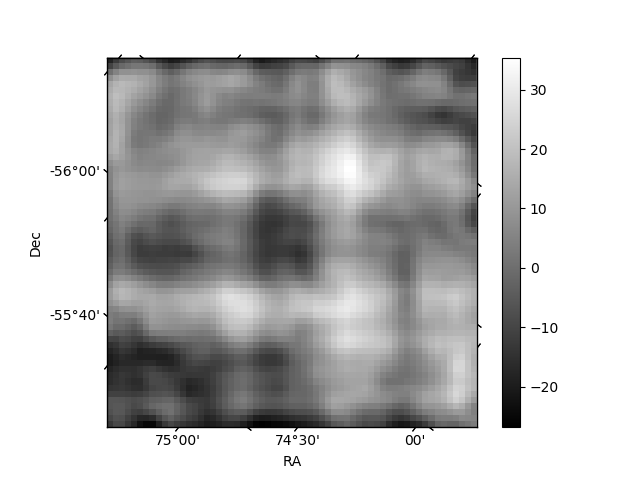
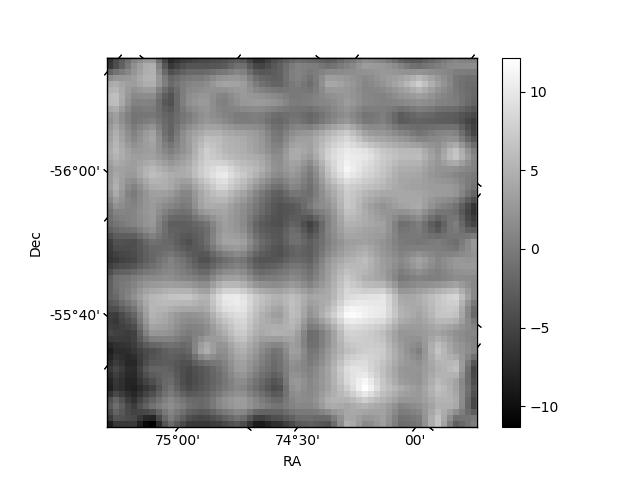
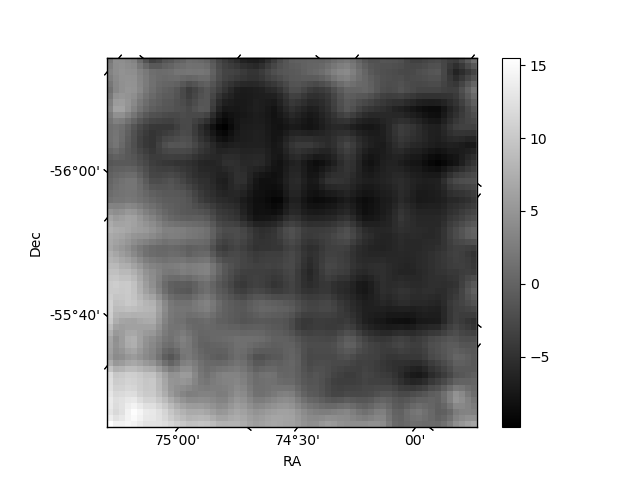
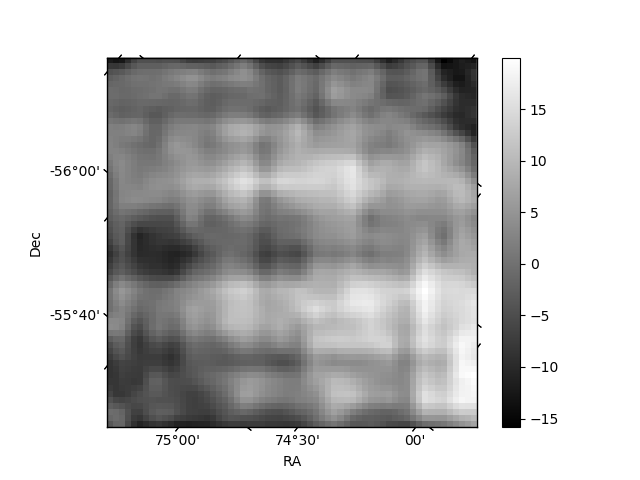
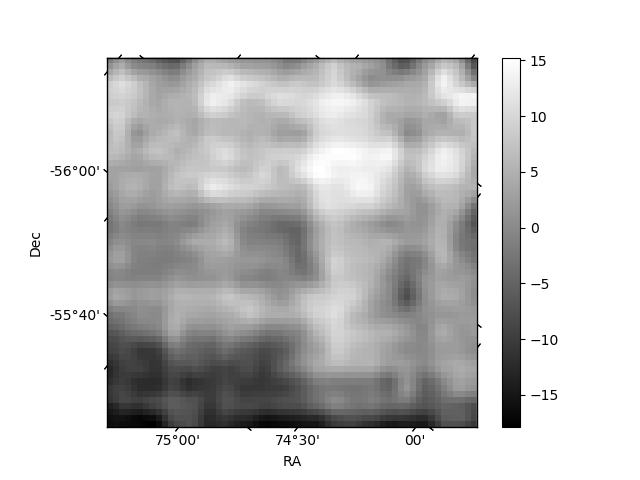
Histogram calculated using DETX and DETY for each event in the final _common_clean file
| Quadrant A | 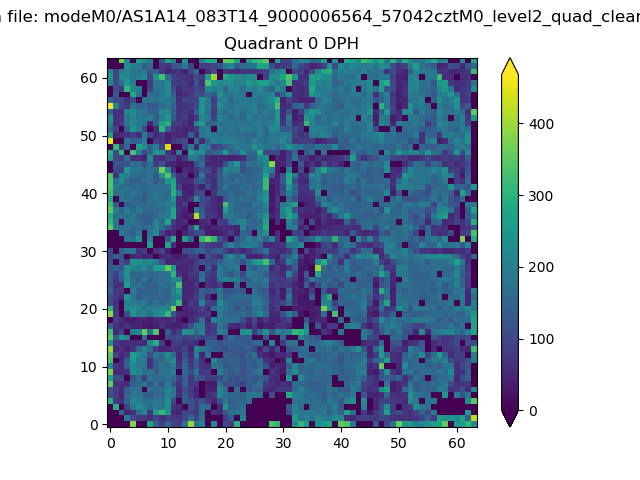 |
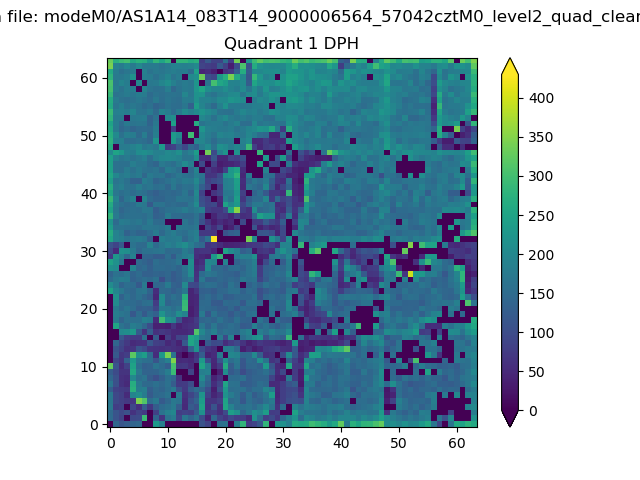 |
Quadrant B |
|---|---|---|---|
| Quadrant D | 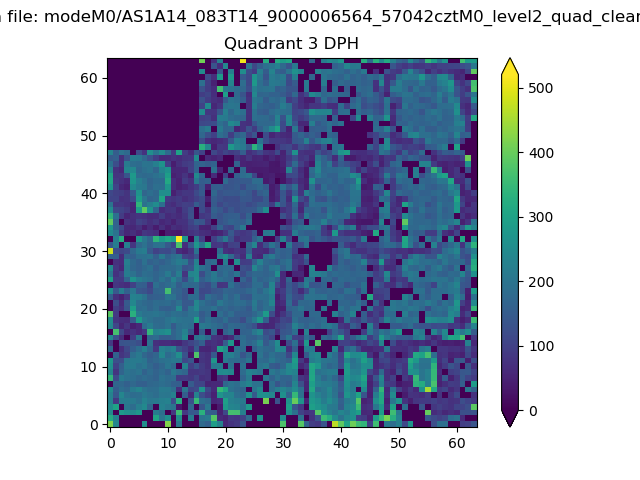 |
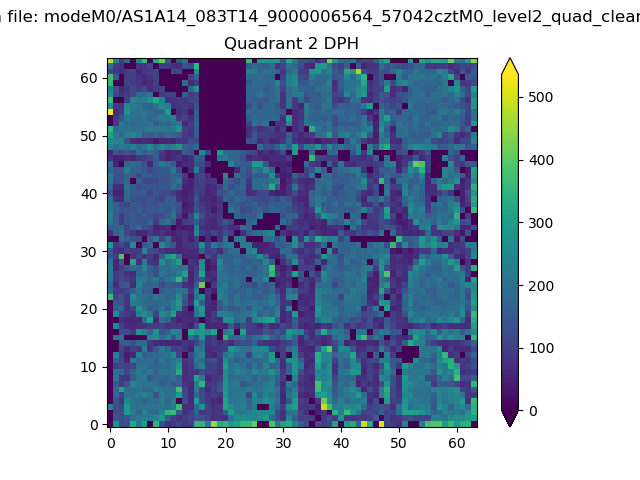 |
Quadrant C |
| Plot type | Count rate plots | Images |
|---|---|---|
| Comparison with Poisson distribution Blue bars denote a histogram of data divided into 1 sec bins. Red curve is a Poisson curve with rate = median count rate of data. |
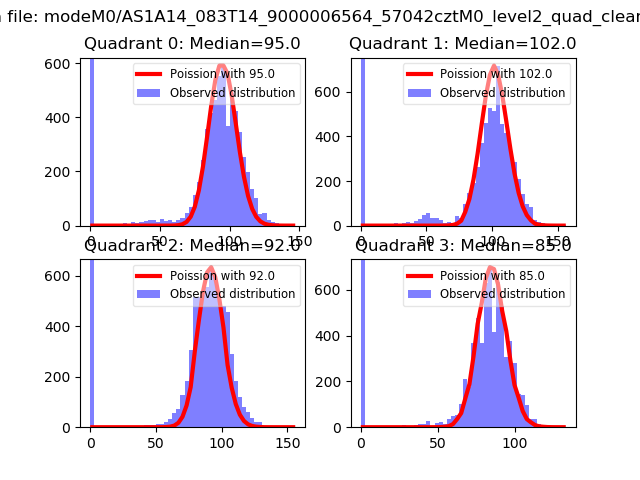 |
 |
| Quadrant-wise count rates Data is divided into 100 sec bins |
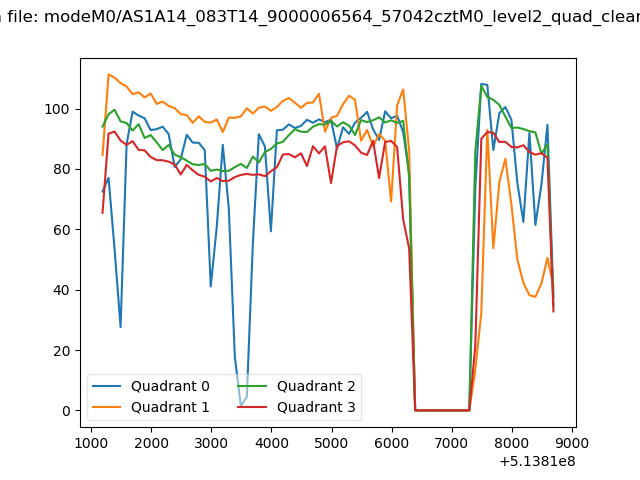 |
|
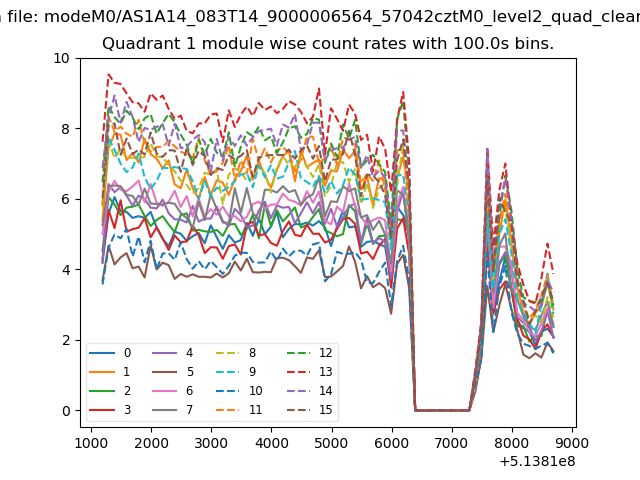
| Module-wise count rates for Quadrant A Data is divided into 100 sec bins |
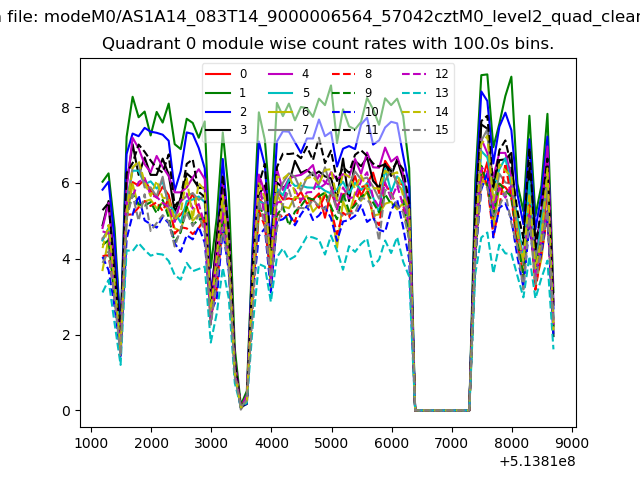 |
 |
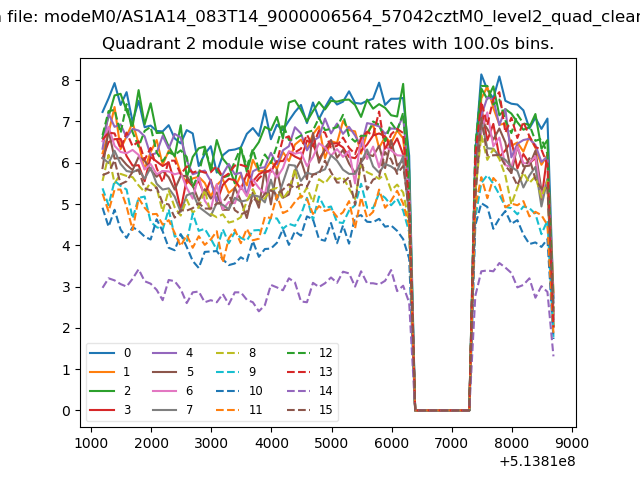
| Module-wise count rates for Quadrant B Data is divided into 100 sec bins |
 |
 |
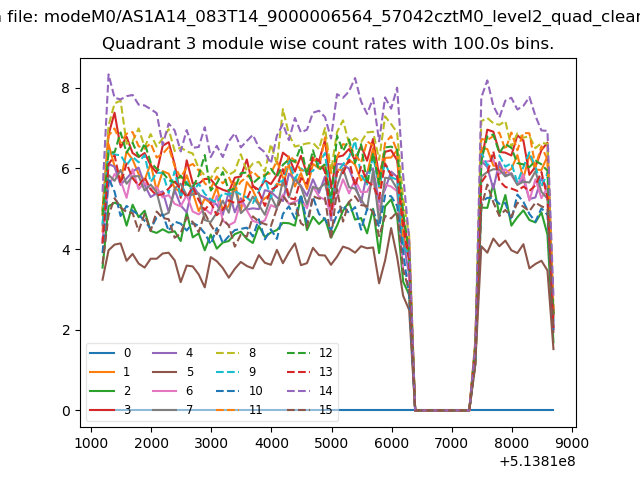
| Module-wise count rates for Quadrant C Data is divided into 100 sec bins |
 |
 |
| Module-wise count rates for Quadrant D Data is divided into 100 sec bins |
 |
 |
| Parameter | Plot |
|---|---|
| CZT HV Monitor | 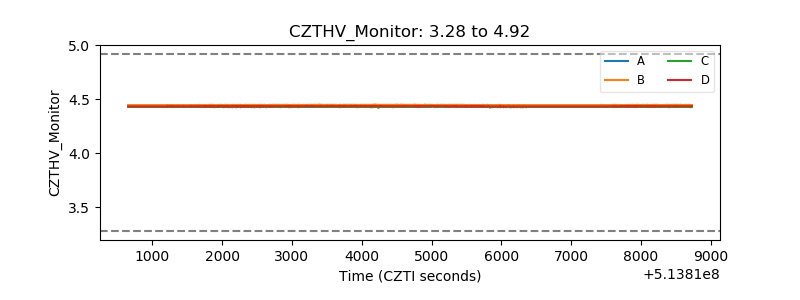 |
| D_VDD | 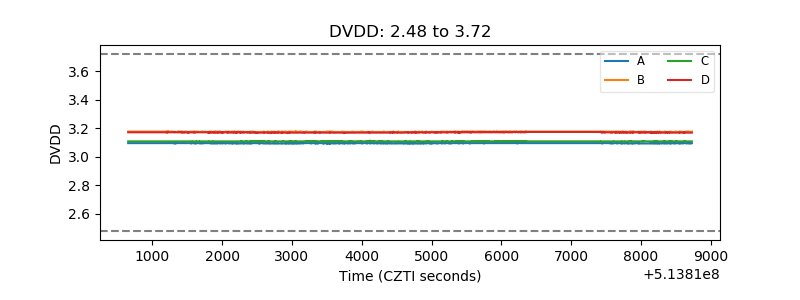 |
| Temperature 1 | 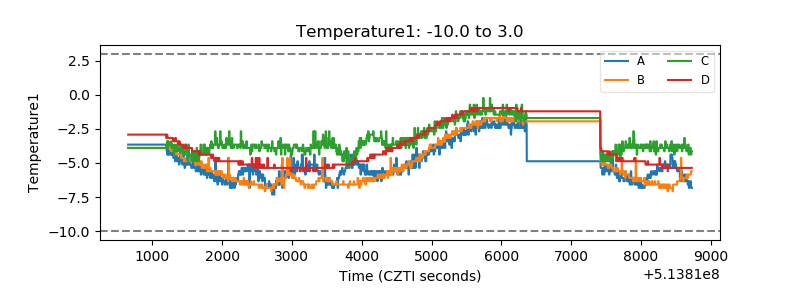 |
| Veto HV Monitor | 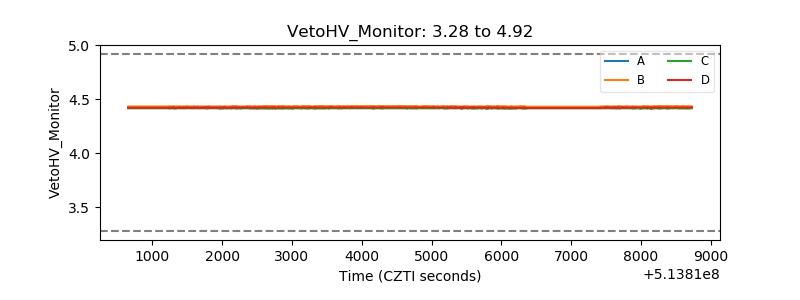 |
| Veto LLD | 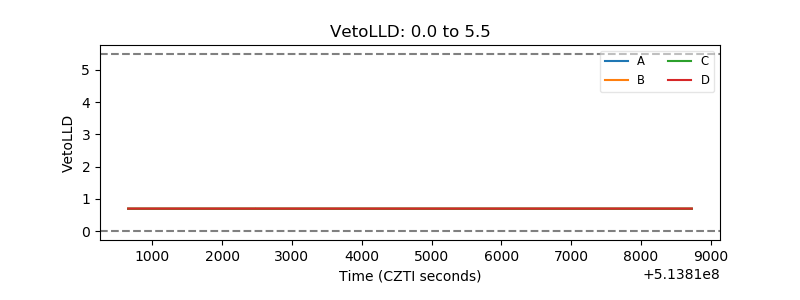 |
| Alpha Counter | 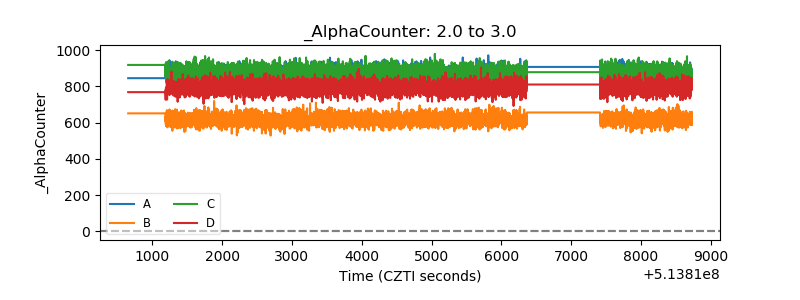 |
| _CPM_Rate | 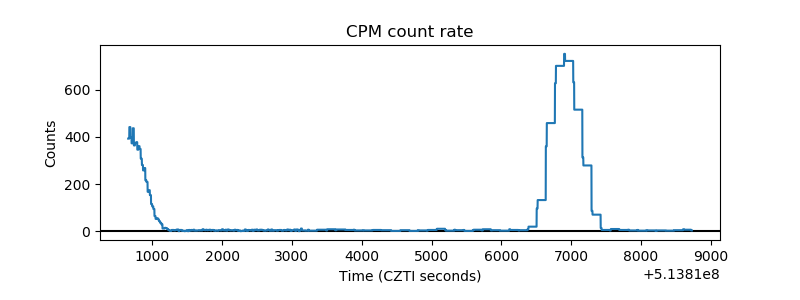 |
| CZT Counter | 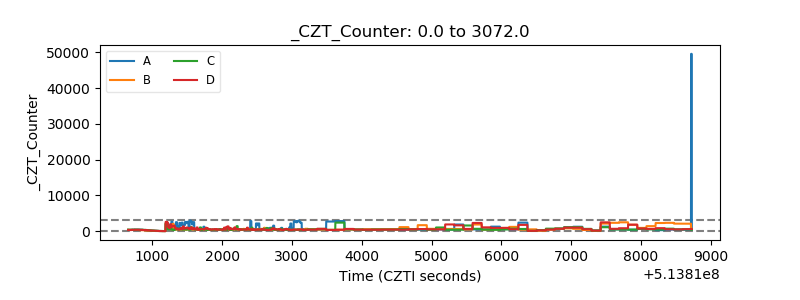 |
| +2.5 Volts monitor |  |
| +5 Volts monitor |  |
| _ROLL_ROT | 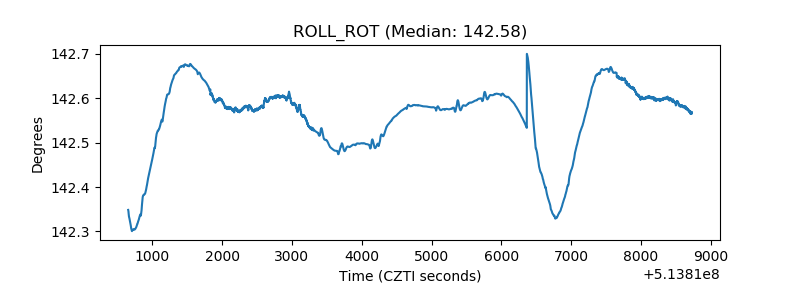 |
| _Roll_DEC | 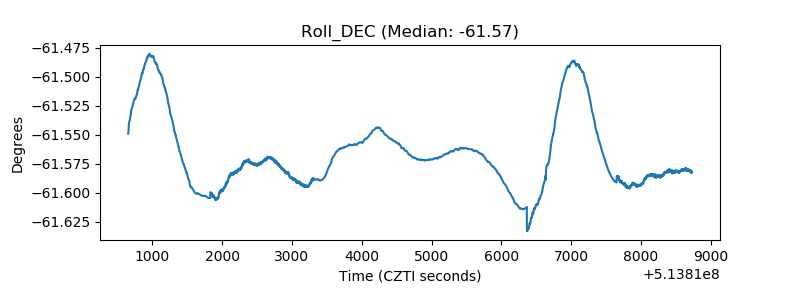 |
| _Roll_RA | 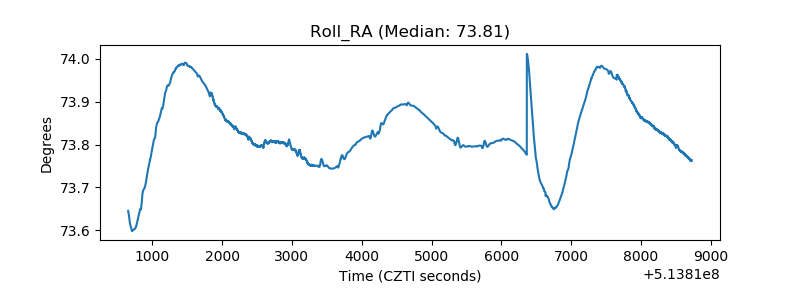 |
| Veto Counter | 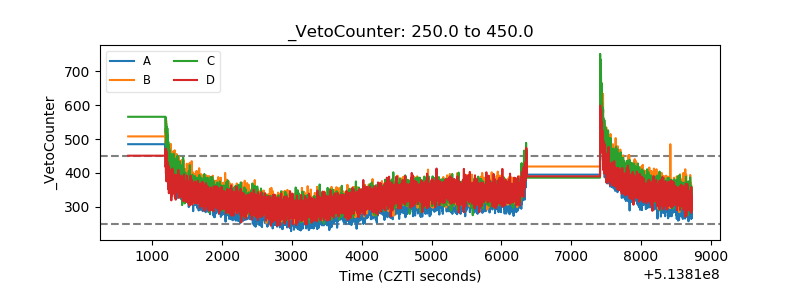 |