| Param | Original file | Final file |
|---|---|---|
| Filename | modeM0/AS1A14_083T14_9000006564_57044cztM0_level2.fits | modeM0/AS1A14_083T14_9000006564_57044cztM0_level2_quad_clean.evt |
| Size (bytes) | 479,162,880 | 100,667,520 |
| Size | 457.0 MB | 96.0 MB |
| Events in quadrant A | 3,994,752 | 671,077 |
| Events in quadrant B | 3,907,414 | 725,335 |
| Events in quadrant C | 4,580,200 | 599,245 |
| Events in quadrant D | 4,729,726 | 581,745 |
| Mode SS | |||
|---|---|---|---|
| Quadrant | BADHDUFLAG | Total packets | Discarded packets |
| A | 0 | 138 | 0 |
| B | 0 | 138 | 0 |
| C | 0 | 138 | 0 |
| D | 0 | 138 | 0 |
| Mode M9 | |||
|---|---|---|---|
| Quadrant | BADHDUFLAG | Total packets | Discarded packets |
| A | 0 | 16 | 0 |
| B | 0 | 17 | 0 |
| C | 0 | 17 | 0 |
| D | 0 | 17 | 0 |
| Mode M0 | |||
|---|---|---|---|
| Quadrant | BADHDUFLAG | Total packets | Discarded packets |
| A | 0 | 16637 | 2 |
| B | 0 | 15957 | 4 |
| C | 0 | 18177 | 2 |
| D | 0 | 18746 | 2 |
| Quadrant | Total seconds | Saturated seconds | Saturation percentage |
|---|---|---|---|
| A | 6752 | 268 | 3.969194% |
| B | 6751 | 248 | 3.673530% |
| C | 6752 | 612 | 9.063981% |
| D | 6752 | 401 | 5.938981% |
Noise dominated data is calculated using 1-second bins in cleaned event files. If a bin has >2000 counts, and if more than 50% of those come from <1% of pixels, then it is considered to be noise-dominated and hence unusable.
| Quadrant | # 1 sec bins | Bins with >0 counts | Bins with >2000 counts | High rate bins dominated by noise | Noise dominated (total time) | Noise dominated (detector-on time) | Marked lightcurve |
|---|---|---|---|---|---|---|---|
| A | 7897 | 6753 | 166 | 166 | 2.10% | 2.46% | 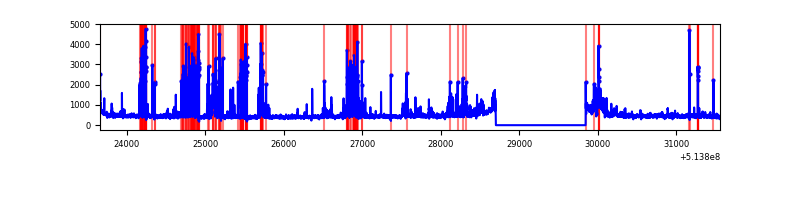 |
| B | 7897 | 6753 | 117 | 117 | 1.48% | 1.73% | 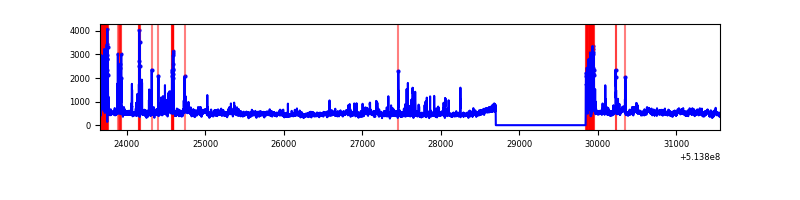 |
| C | 7897 | 6752 | 442 | 442 | 5.60% | 6.55% | 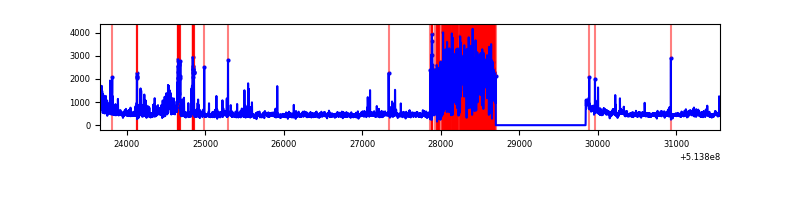 |
| D | 7897 | 6753 | 284 | 284 | 3.60% | 4.21% | 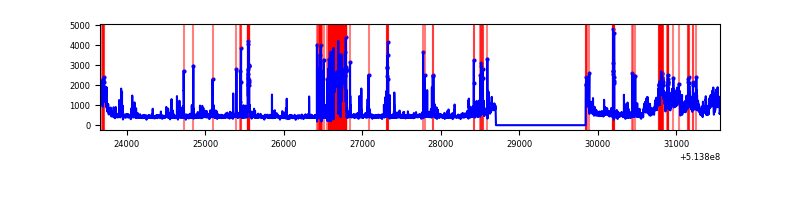 |
Top three noisy pixels from each quadrant. If the there are fewer than three noisy pixels in the level2.evt file, extra rows are filled as -1
| Pixel properties | Quadrant properties | ||||||
|---|---|---|---|---|---|---|---|
| Quadrant | DetID | PixID | Counts | Sigma | Mean | Median | Sigma |
| A | 4 | 13 | 654173 | 3593.88 | 742 | 722 | 181.8 |
| A | 4 | 249 | 303900 | 1667.43 | 742 | 722 | 181.8 |
| A | 3 | 14 | 40990 | 221.46 | 742 | 722 | 181.8 |
| B | 0 | 63 | 359623 | 2307.61 | 735 | 708 | 155.5 |
| B | 10 | 16 | 325389 | 2087.51 | 735 | 708 | 155.5 |
| B | 0 | 213 | 104718 | 668.72 | 735 | 708 | 155.5 |
| C | 15 | 198 | 1167235 | 6161.31 | 702 | 696 | 189.3 |
| C | 1 | 16 | 241631 | 1272.55 | 702 | 696 | 189.3 |
| C | 9 | 38 | 186021 | 978.83 | 702 | 696 | 189.3 |
| D | 15 | 142 | 948865 | 4750.23 | 704 | 672 | 199.6 |
| D | 11 | 247 | 544105 | 2722.47 | 704 | 672 | 199.6 |
| D | 7 | 96 | 197210 | 984.61 | 704 | 672 | 199.6 |
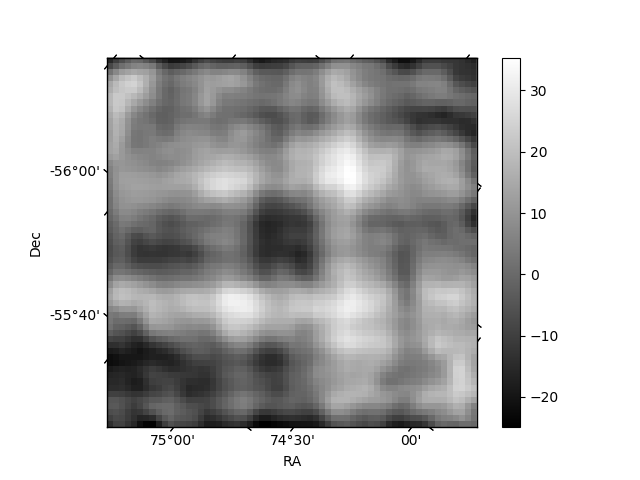
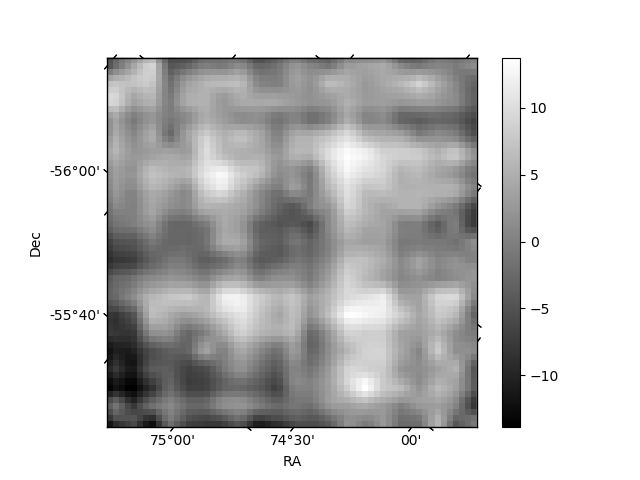
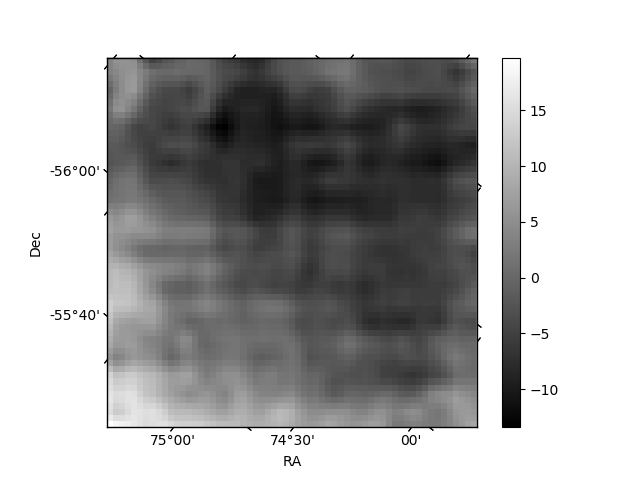
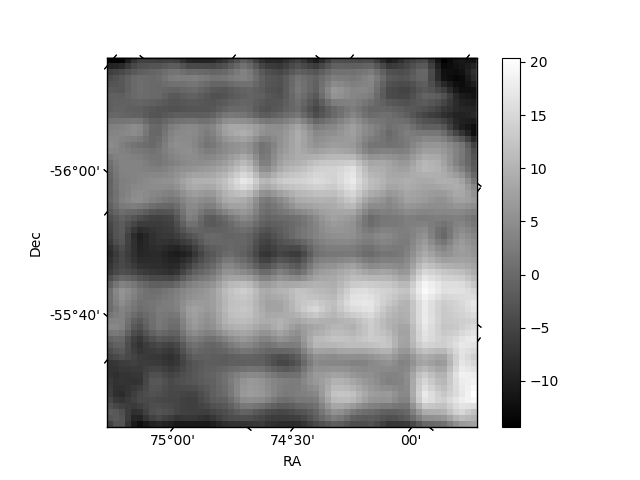
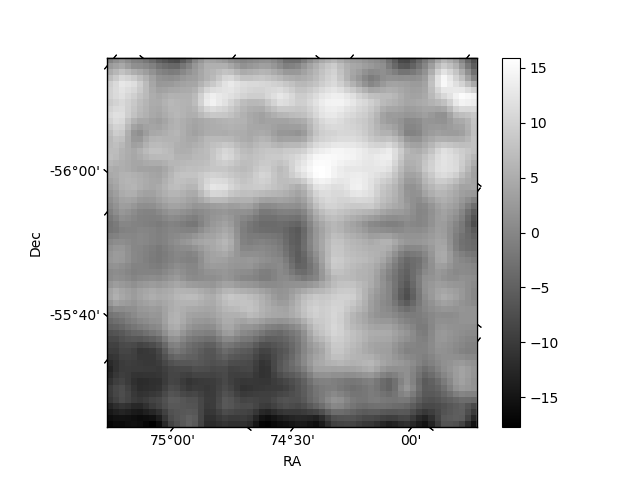
Histogram calculated using DETX and DETY for each event in the final _common_clean file
| Quadrant A | 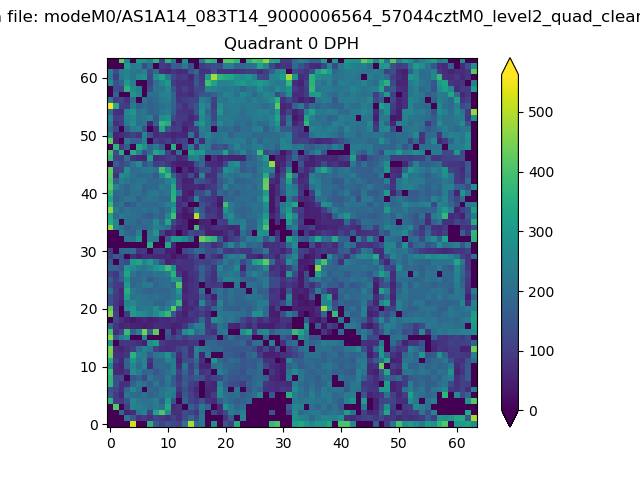 |
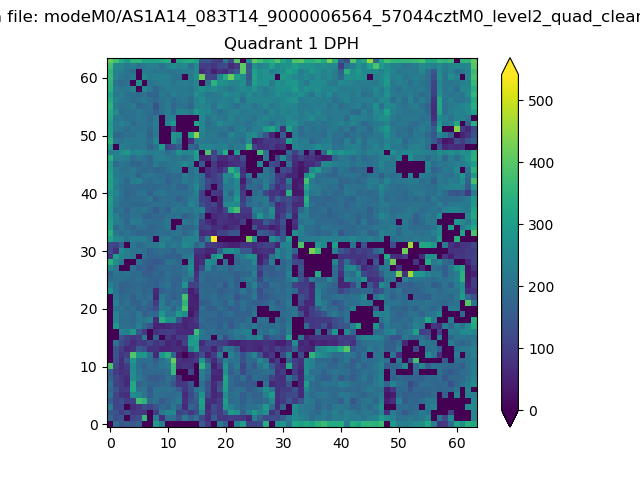 |
Quadrant B |
|---|---|---|---|
| Quadrant D | 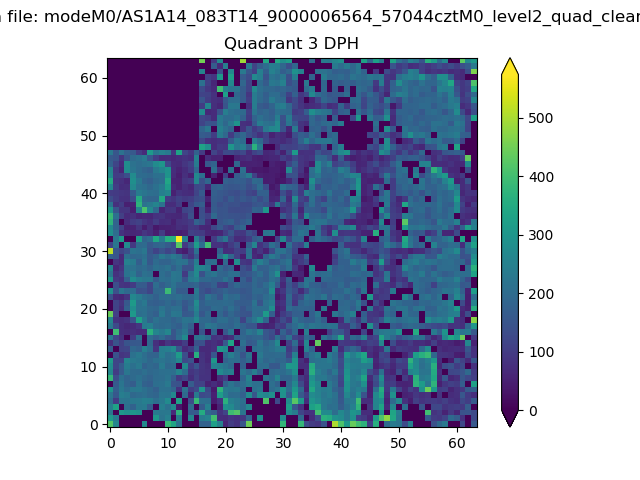 |
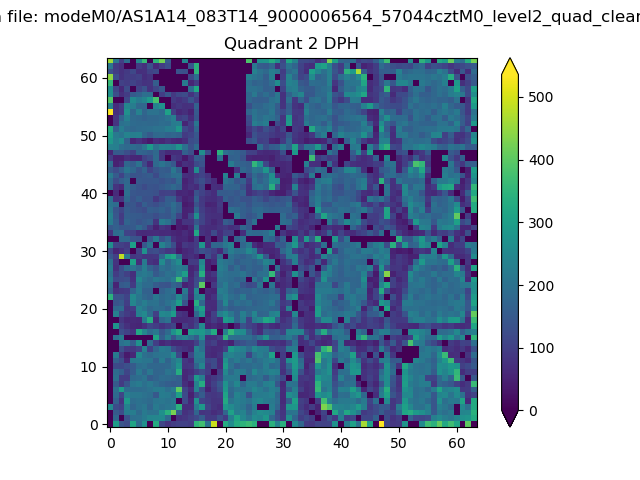 |
Quadrant C |
| Plot type | Count rate plots | Images |
|---|---|---|
| Comparison with Poisson distribution Blue bars denote a histogram of data divided into 1 sec bins. Red curve is a Poisson curve with rate = median count rate of data. |
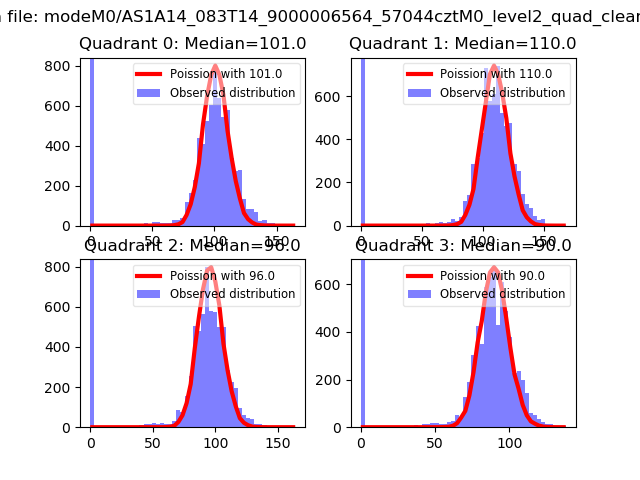 |
 |
| Quadrant-wise count rates Data is divided into 100 sec bins |
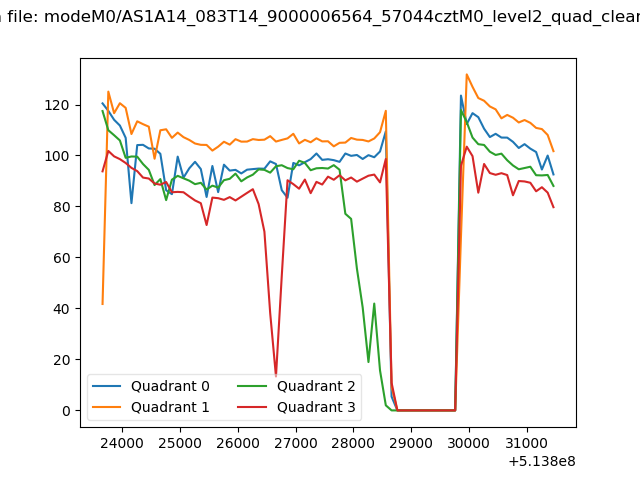 |
|
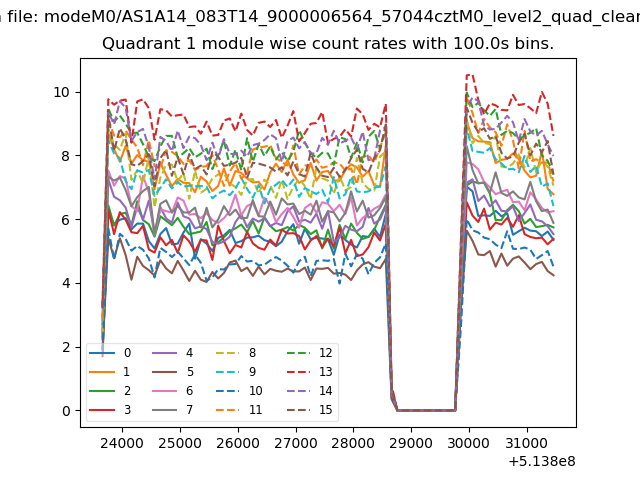
| Module-wise count rates for Quadrant A Data is divided into 100 sec bins |
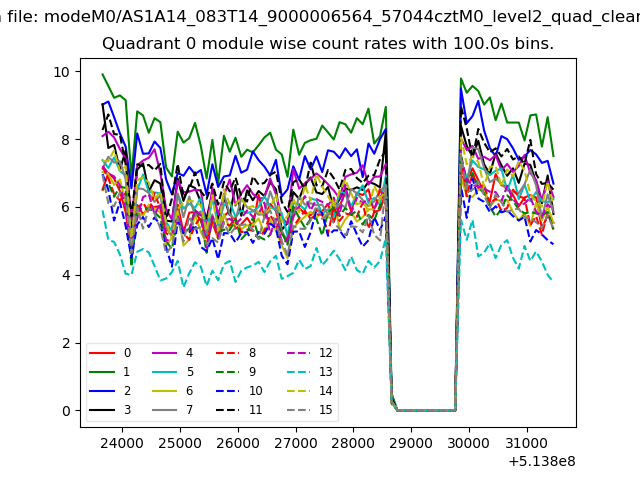 |
 |
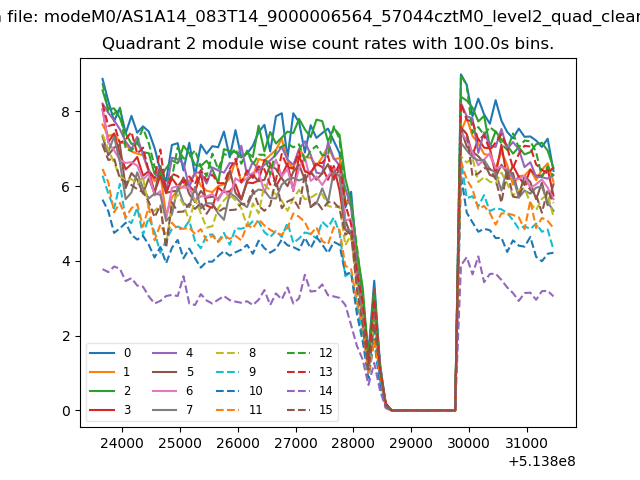
| Module-wise count rates for Quadrant B Data is divided into 100 sec bins |
 |
 |
| Module-wise count rates for Quadrant C Data is divided into 100 sec bins |
 |
 |
| Module-wise count rates for Quadrant D Data is divided into 100 sec bins |
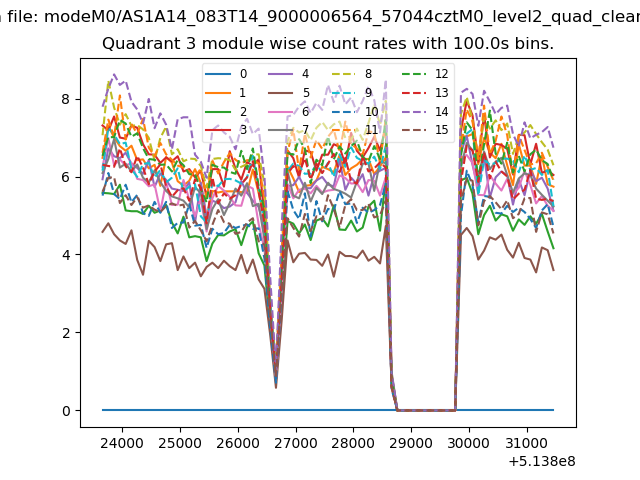 |
 |
| Parameter | Plot |
|---|---|
| CZT HV Monitor | 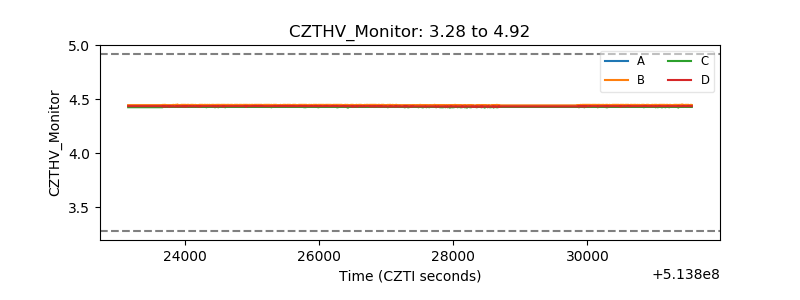 |
| D_VDD | 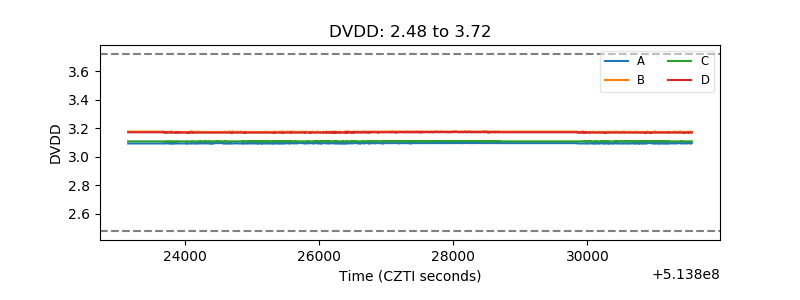 |
| Temperature 1 | 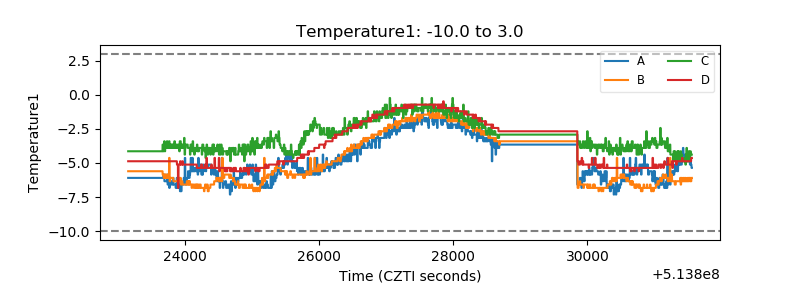 |
| Veto HV Monitor | 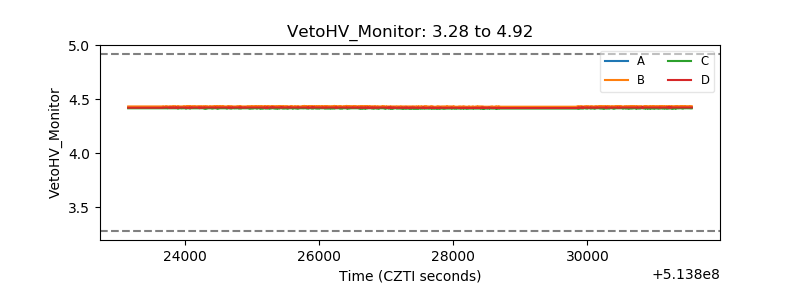 |
| Veto LLD | 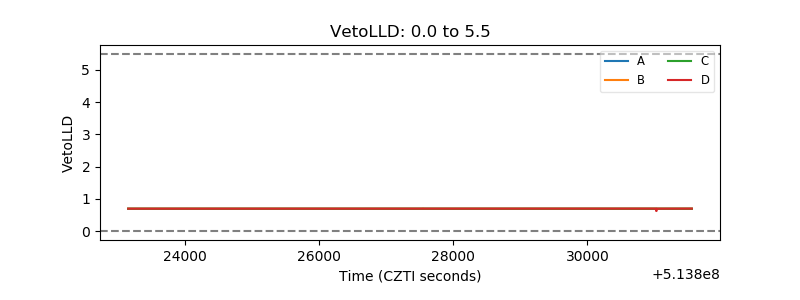 |
| Alpha Counter | 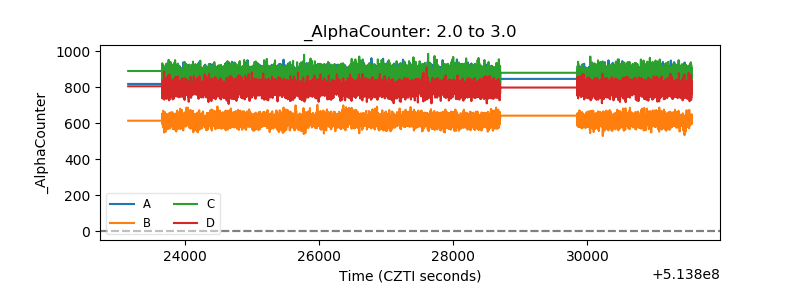 |
| _CPM_Rate | 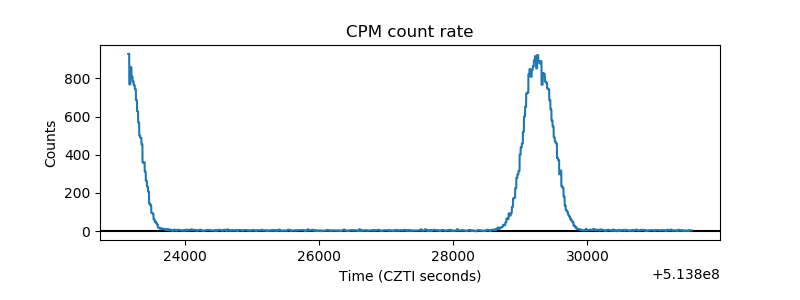 |
| CZT Counter | 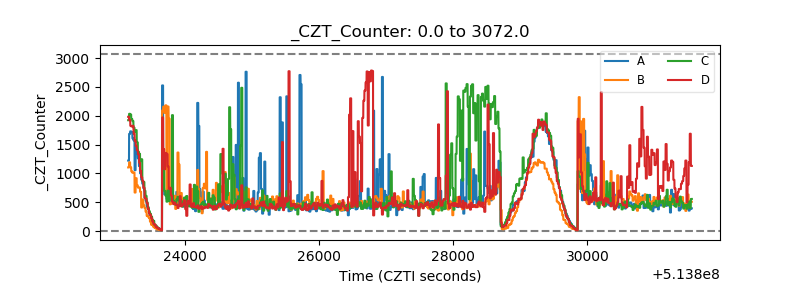 |
| +2.5 Volts monitor |  |
| +5 Volts monitor |  |
| _ROLL_ROT | 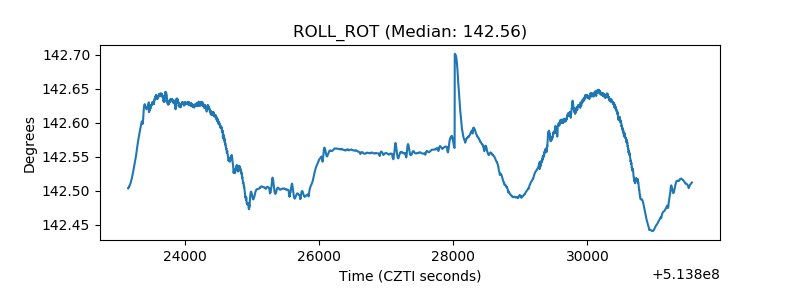 |
| _Roll_DEC | 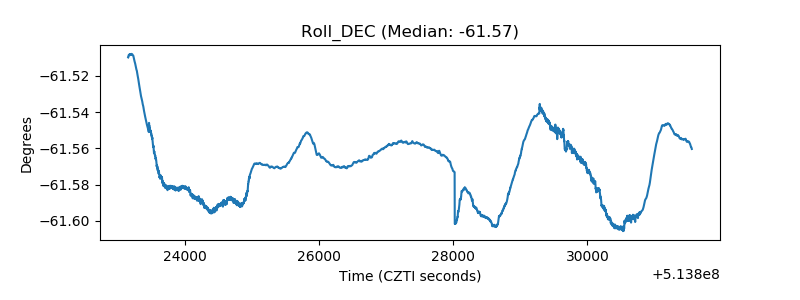 |
| _Roll_RA | 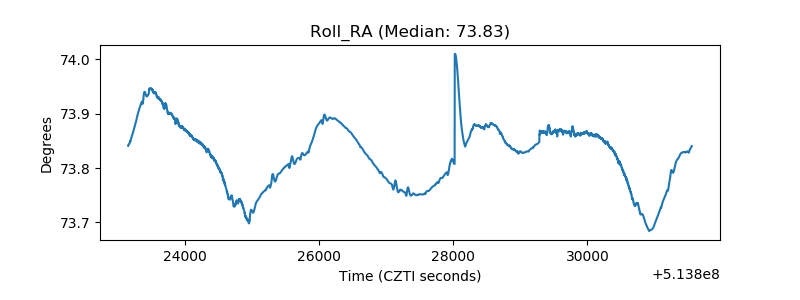 |
| Veto Counter | 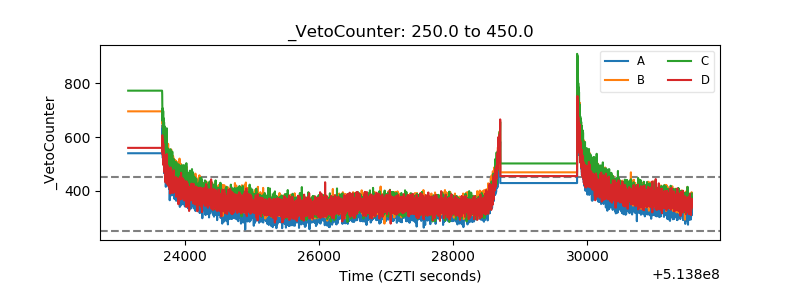 |