| Param | Original file | Final file |
|---|---|---|
| Filename | modeM0/AS1A14_083T14_9000006564_57045cztM0_level2.fits | modeM0/AS1A14_083T14_9000006564_57045cztM0_level2_quad_clean.evt |
| Size (bytes) | 597,833,280 | 93,415,680 |
| Size | 570.1 MB | 89.1 MB |
| Events in quadrant A | 4,883,602 | 630,270 |
| Events in quadrant B | 3,980,963 | 700,040 |
| Events in quadrant C | 6,802,805 | 485,618 |
| Events in quadrant D | 5,949,558 | 552,430 |
| Mode SS | |||
|---|---|---|---|
| Quadrant | BADHDUFLAG | Total packets | Discarded packets |
| A | 0 | 134 | 0 |
| B | 0 | 134 | 0 |
| C | 0 | 134 | 0 |
| D | 0 | 134 | 0 |
| Mode M9 | |||
|---|---|---|---|
| Quadrant | BADHDUFLAG | Total packets | Discarded packets |
| A | 0 | 12 | 0 |
| B | 0 | 12 | 0 |
| C | 0 | 12 | 0 |
| D | 0 | 12 | 0 |
| Mode M0 | |||
|---|---|---|---|
| Quadrant | BADHDUFLAG | Total packets | Discarded packets |
| A | 0 | 19151 | 2 |
| B | 0 | 15918 | 3 |
| C | 0 | 24562 | 2 |
| D | 0 | 22205 | 2 |
| Quadrant | Total seconds | Saturated seconds | Saturation percentage |
|---|---|---|---|
| A | 6603 | 563 | 8.526427% |
| B | 6602 | 366 | 5.543775% |
| C | 6602 | 1761 | 26.673735% |
| D | 6602 | 643 | 9.739473% |
Noise dominated data is calculated using 1-second bins in cleaned event files. If a bin has >2000 counts, and if more than 50% of those come from <1% of pixels, then it is considered to be noise-dominated and hence unusable.
| Quadrant | # 1 sec bins | Bins with >0 counts | Bins with >2000 counts | High rate bins dominated by noise | Noise dominated (total time) | Noise dominated (detector-on time) | Marked lightcurve |
|---|---|---|---|---|---|---|---|
| A | 7798 | 6604 | 416 | 416 | 5.33% | 6.30% | 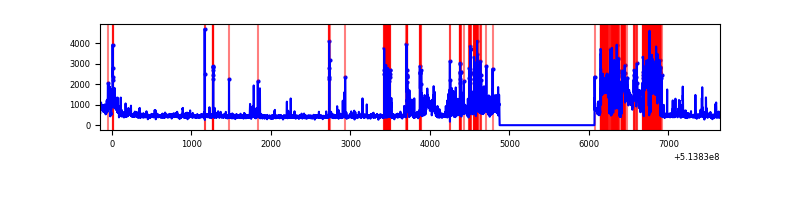 |
| B | 7797 | 6603 | 147 | 147 | 1.89% | 2.23% | 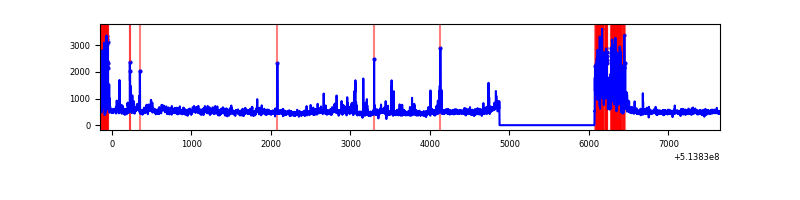 |
| C | 7797 | 6603 | 1616 | 1616 | 20.73% | 24.47% | 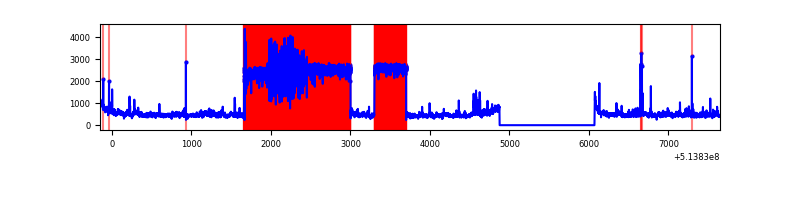 |
| D | 7797 | 6603 | 428 | 428 | 5.49% | 6.48% | 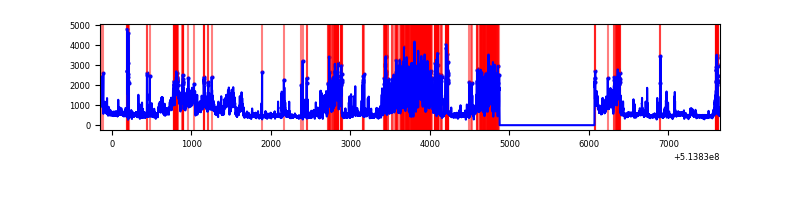 |
Top three noisy pixels from each quadrant. If the there are fewer than three noisy pixels in the level2.evt file, extra rows are filled as -1
| Pixel properties | Quadrant properties | ||||||
|---|---|---|---|---|---|---|---|
| Quadrant | DetID | PixID | Counts | Sigma | Mean | Median | Sigma |
| A | 4 | 249 | 1966024 | 11149.5 | 719 | 702 | 176.3 |
| A | 7 | 64 | 39868 | 222.19 | 719 | 702 | 176.3 |
| A | 4 | 3 | 16781 | 91.22 | 719 | 702 | 176.3 |
| B | 5 | 185 | 346281 | 2294.87 | 714 | 689 | 150.6 |
| B | 0 | 63 | 337237 | 2234.81 | 714 | 689 | 150.6 |
| B | 10 | 16 | 280638 | 1858.97 | 714 | 689 | 150.6 |
| C | 15 | 198 | 4091959 | 25191.13 | 597 | 591 | 162.4 |
| C | 1 | 16 | 198019 | 1215.59 | 597 | 591 | 162.4 |
| C | 9 | 38 | 47729 | 290.24 | 597 | 591 | 162.4 |
| D | 15 | 142 | 1629999 | 8432.46 | 686 | 655 | 193.2 |
| D | 12 | 33 | 1037288 | 5364.96 | 686 | 655 | 193.2 |
| D | 7 | 96 | 202719 | 1045.76 | 686 | 655 | 193.2 |
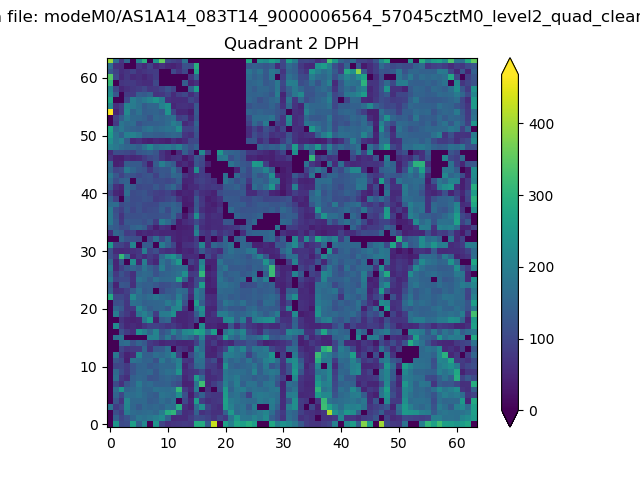
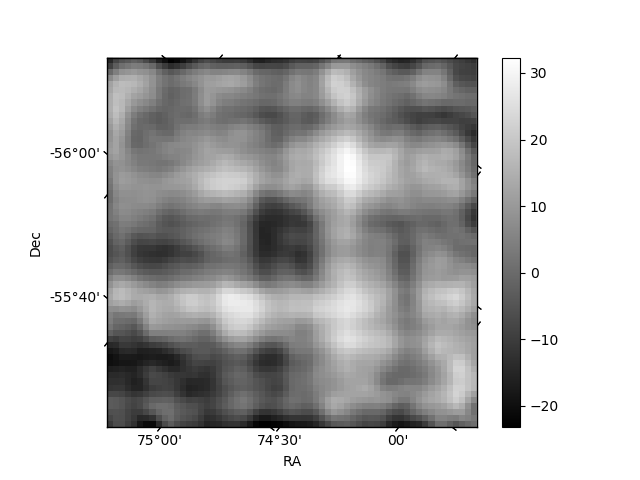
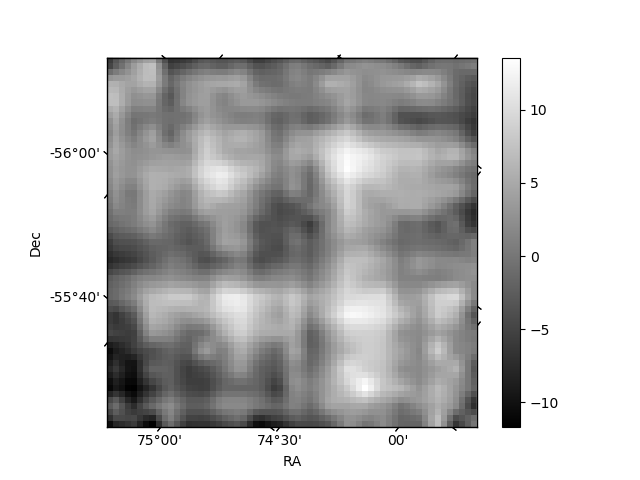
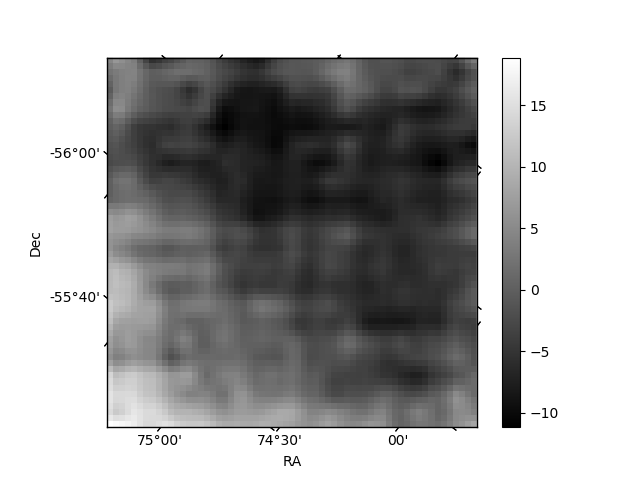
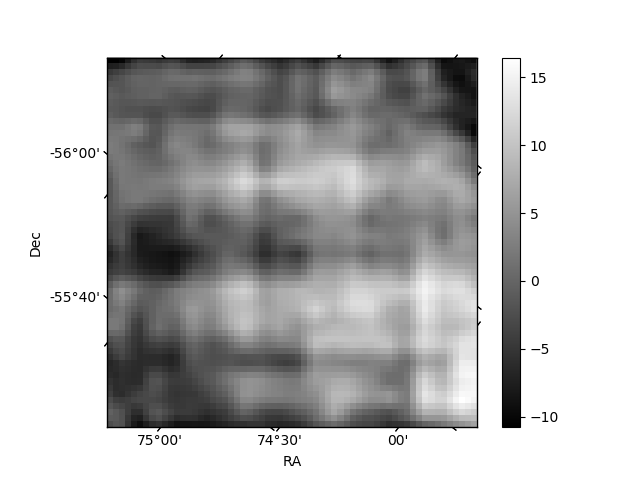
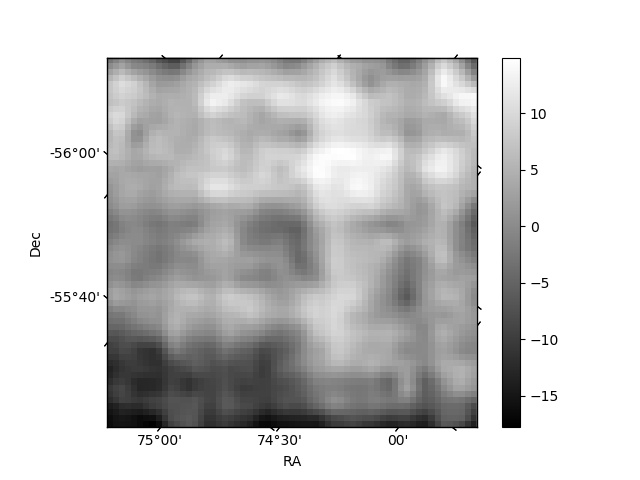
Histogram calculated using DETX and DETY for each event in the final _common_clean file
| Quadrant A | 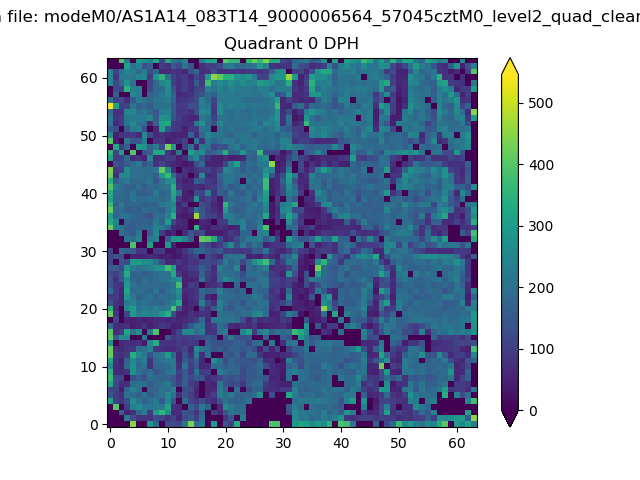 |
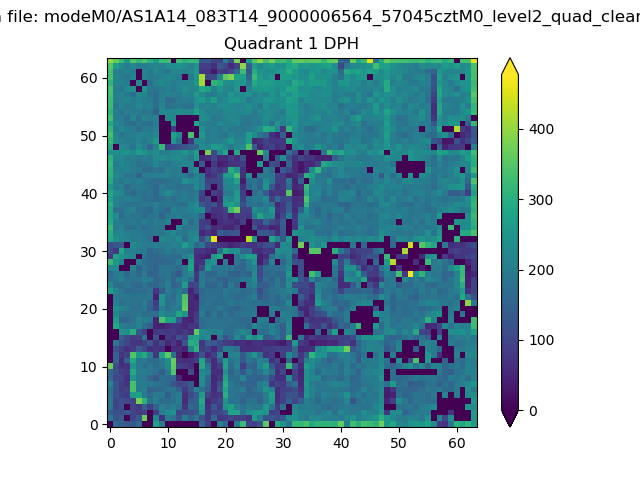 |
Quadrant B |
|---|---|---|---|
| Quadrant D | 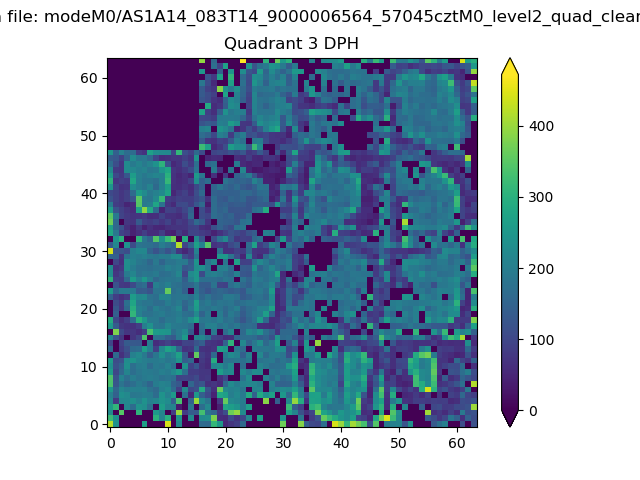 |
 |
Quadrant C |
| Plot type | Count rate plots | Images |
|---|---|---|
| Comparison with Poisson distribution Blue bars denote a histogram of data divided into 1 sec bins. Red curve is a Poisson curve with rate = median count rate of data. |
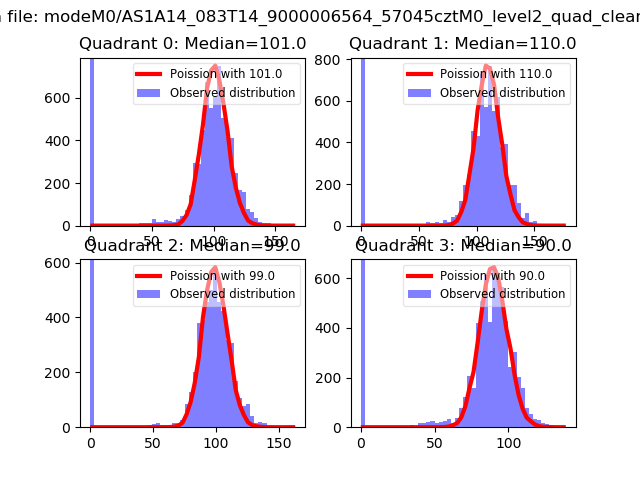 |
 |
| Quadrant-wise count rates Data is divided into 100 sec bins |
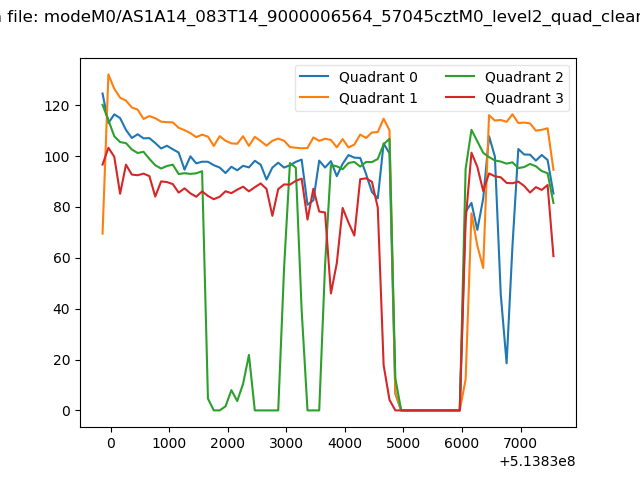 |
|
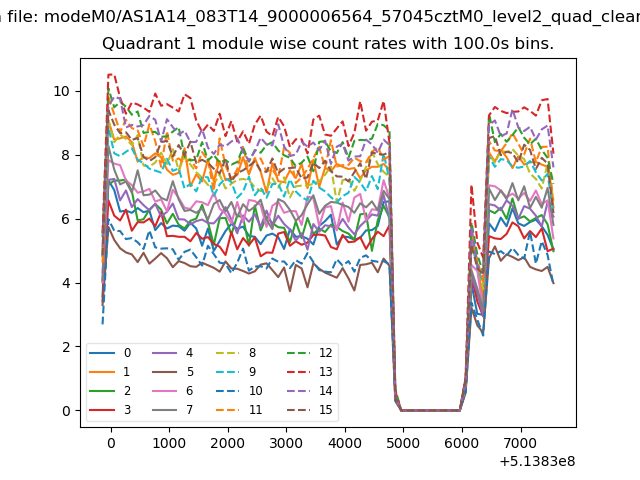
| Module-wise count rates for Quadrant A Data is divided into 100 sec bins |
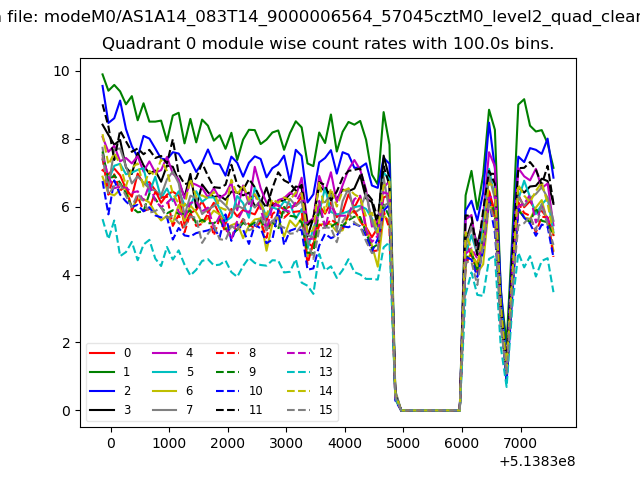 |
 |
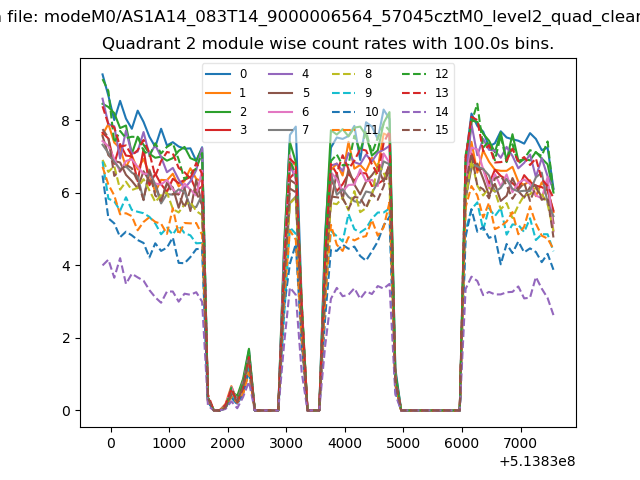
| Module-wise count rates for Quadrant B Data is divided into 100 sec bins |
 |
 |
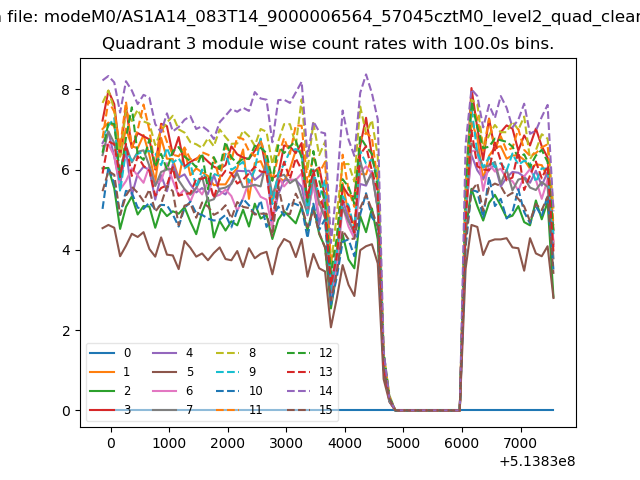
| Module-wise count rates for Quadrant C Data is divided into 100 sec bins |
 |
 |
| Module-wise count rates for Quadrant D Data is divided into 100 sec bins |
 |
 |
| Parameter | Plot |
|---|---|
| CZT HV Monitor | 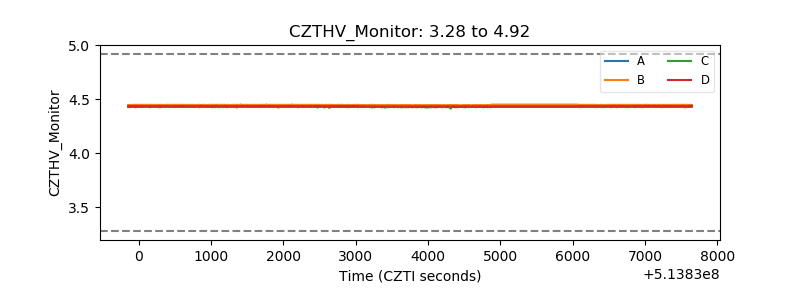 |
| D_VDD | 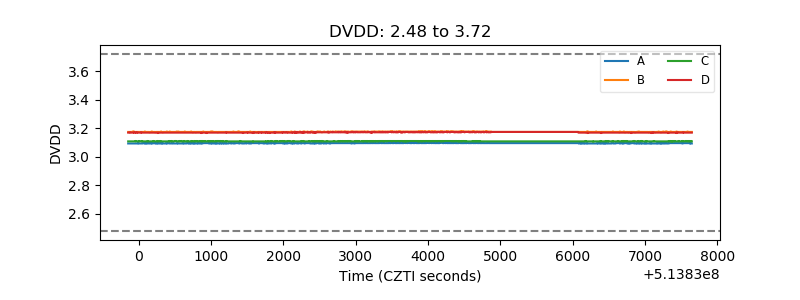 |
| Temperature 1 | 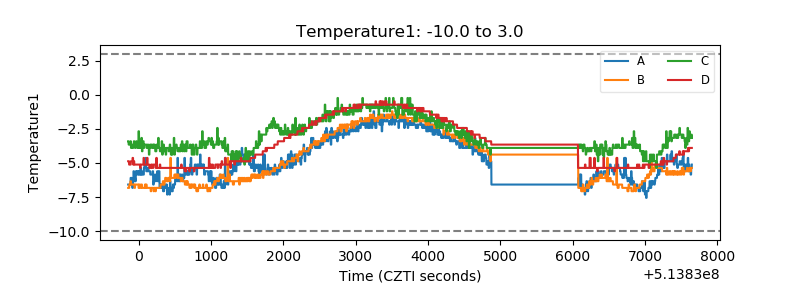 |
| Veto HV Monitor | 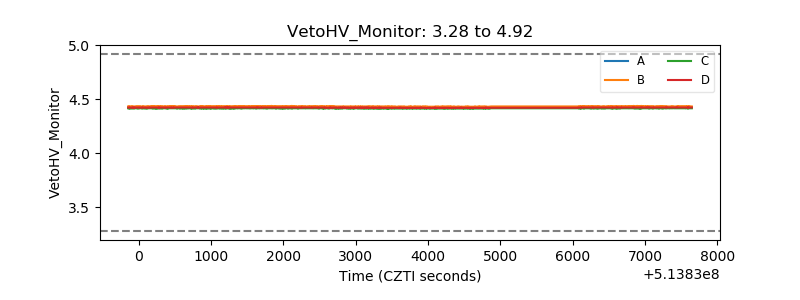 |
| Veto LLD | 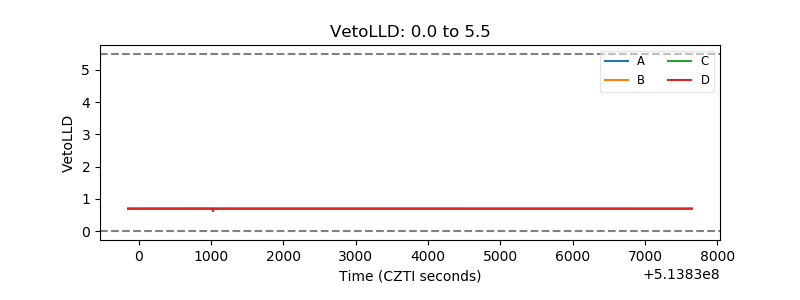 |
| Alpha Counter | 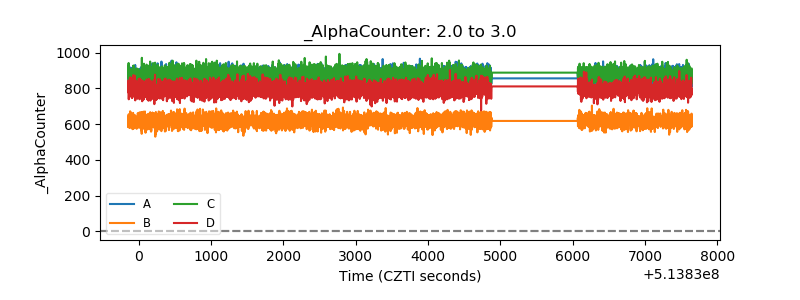 |
| _CPM_Rate | 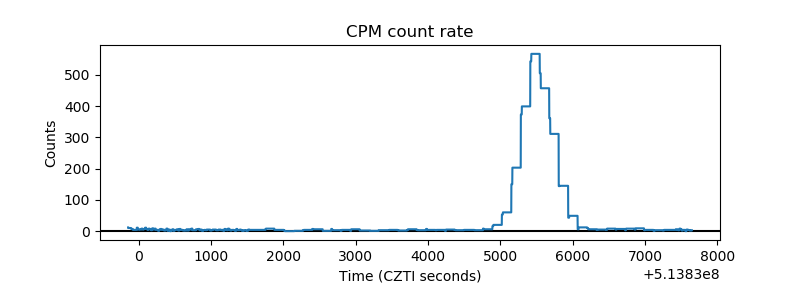 |
| CZT Counter | 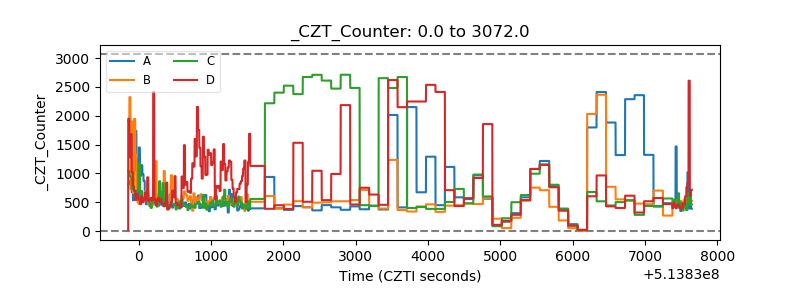 |
| +2.5 Volts monitor |  |
| +5 Volts monitor |  |
| _ROLL_ROT | 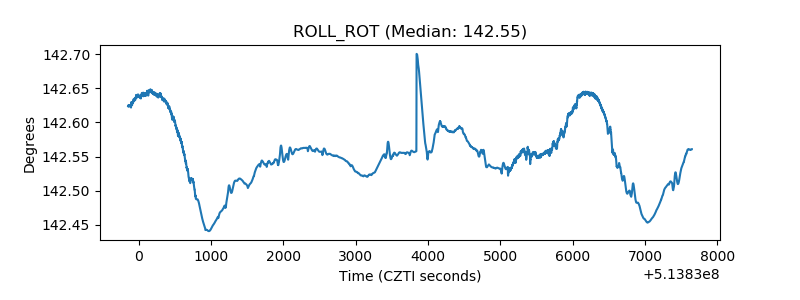 |
| _Roll_DEC | 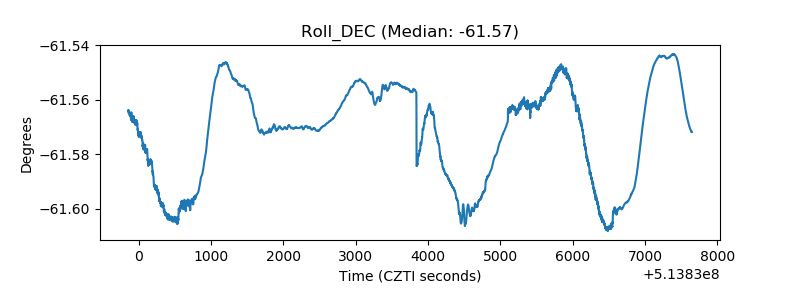 |
| _Roll_RA | 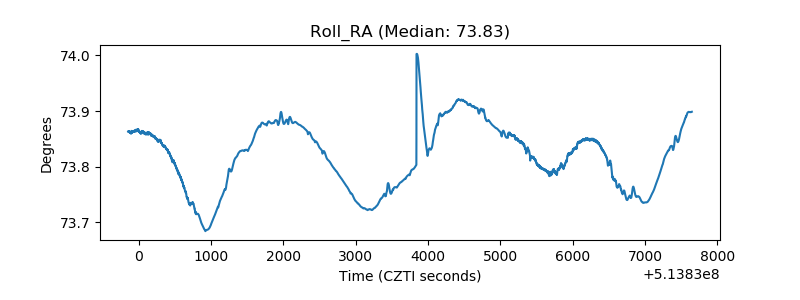 |
| Veto Counter | 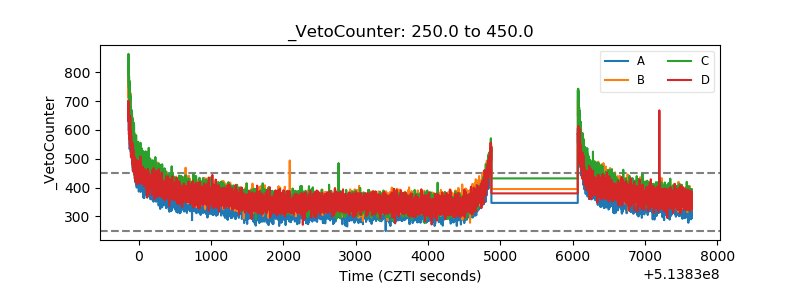 |