| Param | Original file | Final file |
|---|---|---|
| Filename | modeM0/AS1A14_083T10_9000006566_57048cztM0_level2.fits | modeM0/AS1A14_083T10_9000006566_57048cztM0_level2_quad_clean.evt |
| Size (bytes) | 515,897,280 | 112,821,120 |
| Size | 492.0 MB | 107.6 MB |
| Events in quadrant A | 3,696,671 | 736,560 |
| Events in quadrant B | 4,274,735 | 777,653 |
| Events in quadrant C | 5,090,211 | 699,018 |
| Events in quadrant D | 5,421,562 | 653,633 |
| Mode M9 | |||
|---|---|---|---|
| Quadrant | BADHDUFLAG | Total packets | Discarded packets |
| A | 0 | 1 | 0 |
| B | 0 | 1 | 0 |
| C | 0 | 1 | 0 |
| D | 0 | 1 | 0 |
| Mode M0 | |||
|---|---|---|---|
| Quadrant | BADHDUFLAG | Total packets | Discarded packets |
| A | 0 | 16725 | 2 |
| B | 0 | 18371 | 2 |
| C | 0 | 20388 | 6 |
| D | 0 | 21701 | 2 |
| Mode SS | |||
|---|---|---|---|
| Quadrant | BADHDUFLAG | Total packets | Discarded packets |
| A | 0 | 162 | 0 |
| B | 0 | 162 | 0 |
| C | 0 | 162 | 0 |
| D | 0 | 162 | 0 |
| Quadrant | Total seconds | Saturated seconds | Saturation percentage |
|---|---|---|---|
| A | 7896 | 263 | 3.330800% |
| B | 7897 | 438 | 5.546410% |
| C | 7896 | 428 | 5.420466% |
| D | 7896 | 462 | 5.851064% |
Noise dominated data is calculated using 1-second bins in cleaned event files. If a bin has >2000 counts, and if more than 50% of those come from <1% of pixels, then it is considered to be noise-dominated and hence unusable.
| Quadrant | # 1 sec bins | Bins with >0 counts | Bins with >2000 counts | High rate bins dominated by noise | Noise dominated (total time) | Noise dominated (detector-on time) | Marked lightcurve |
|---|---|---|---|---|---|---|---|
| A | 8031 | 7898 | 4 | 4 | 0.05% | 0.05% | 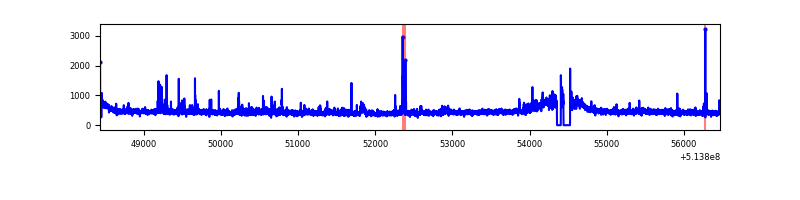 |
| B | 8032 | 7897 | 94 | 94 | 1.17% | 1.19% | 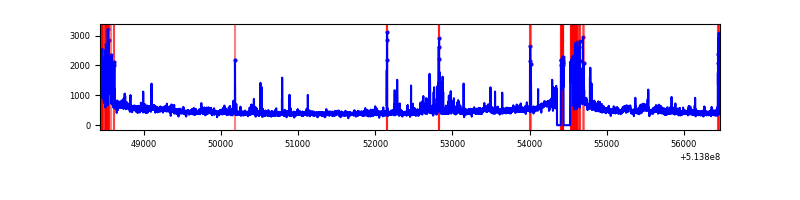 |
| C | 8030 | 7897 | 257 | 257 | 3.20% | 3.25% | 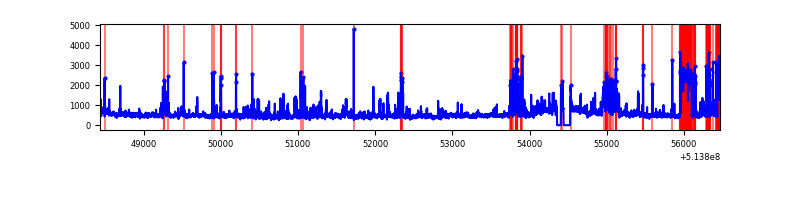 |
| D | 8031 | 7897 | 239 | 239 | 2.98% | 3.03% | 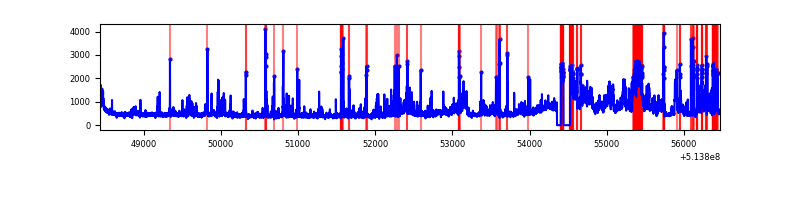 |
Top three noisy pixels from each quadrant. If the there are fewer than three noisy pixels in the level2.evt file, extra rows are filled as -1
| Pixel properties | Quadrant properties | ||||||
|---|---|---|---|---|---|---|---|
| Quadrant | DetID | PixID | Counts | Sigma | Mean | Median | Sigma |
| A | 7 | 64 | 112791 | 514.72 | 887 | 863 | 217.5 |
| A | 4 | 249 | 61511 | 278.9 | 887 | 863 | 217.5 |
| A | 4 | 13 | 23295 | 103.16 | 887 | 863 | 217.5 |
| B | 10 | 16 | 369863 | 2023.63 | 845 | 813 | 182.4 |
| B | 0 | 63 | 237932 | 1300.2 | 845 | 813 | 182.4 |
| B | 0 | 213 | 144003 | 785.16 | 845 | 813 | 182.4 |
| C | 9 | 38 | 698250 | 3017.39 | 851 | 841 | 231.1 |
| C | 1 | 16 | 258049 | 1112.83 | 851 | 841 | 231.1 |
| C | 15 | 209 | 230124 | 992.01 | 851 | 841 | 231.1 |
| D | 15 | 142 | 1158097 | 4897.22 | 850 | 811 | 236.3 |
| D | 7 | 96 | 301763 | 1273.52 | 850 | 811 | 236.3 |
| D | 12 | 33 | 160183 | 674.4 | 850 | 811 | 236.3 |
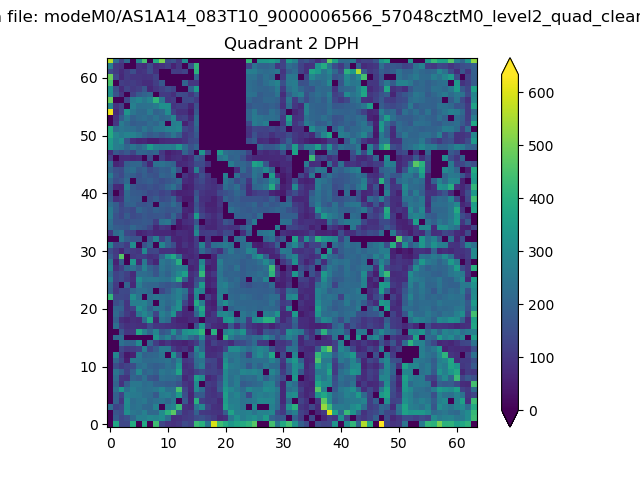
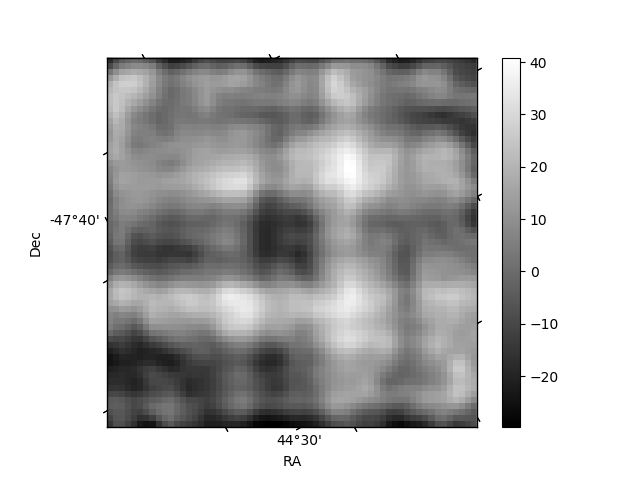
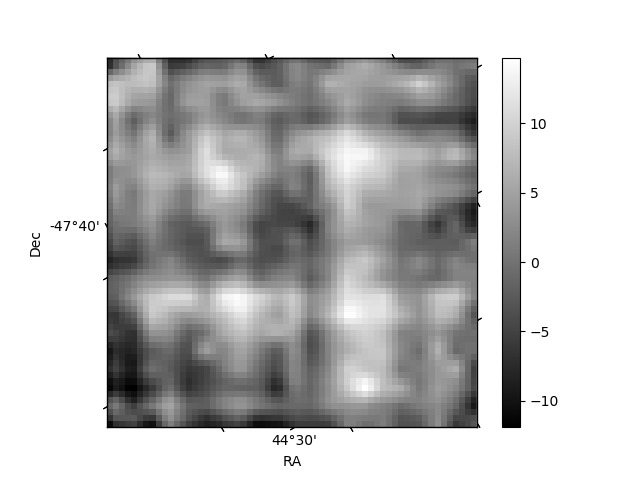
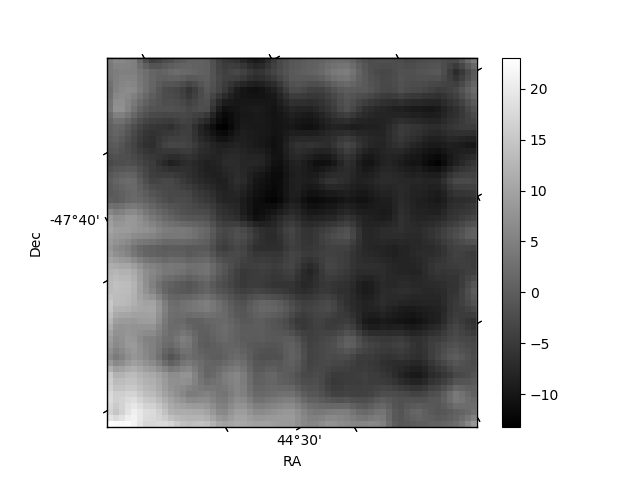
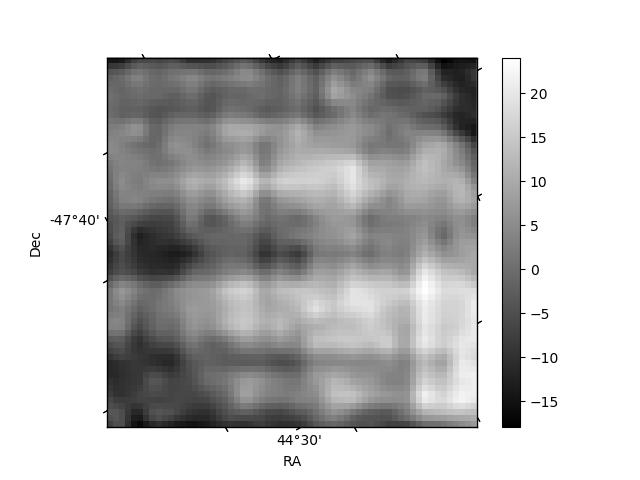
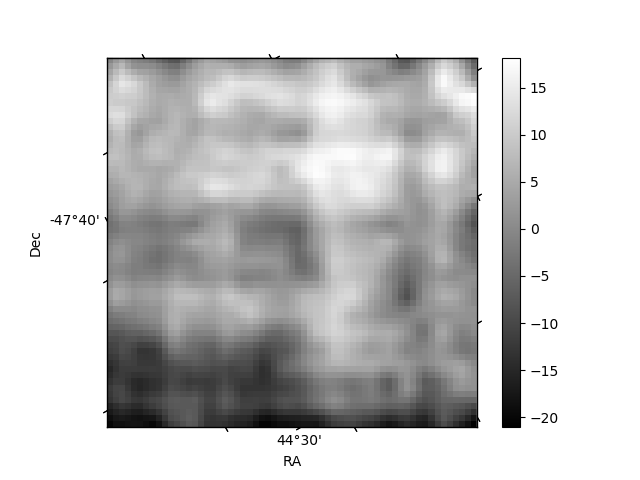
Histogram calculated using DETX and DETY for each event in the final _common_clean file
| Quadrant A | 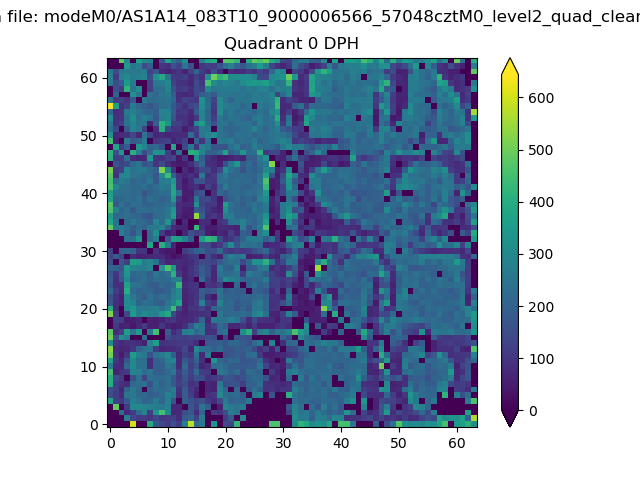 |
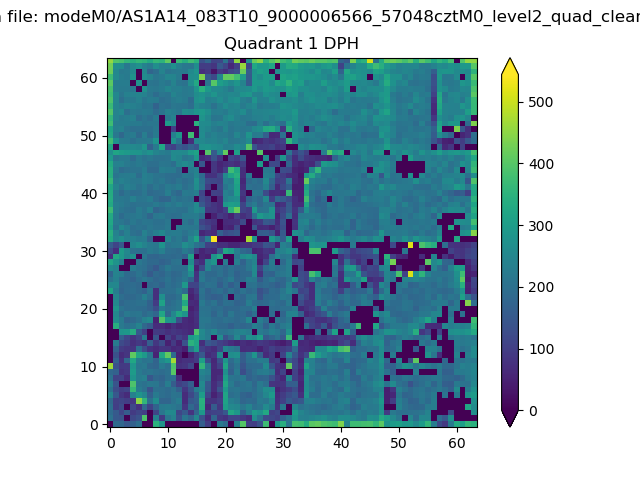 |
Quadrant B |
|---|---|---|---|
| Quadrant D | 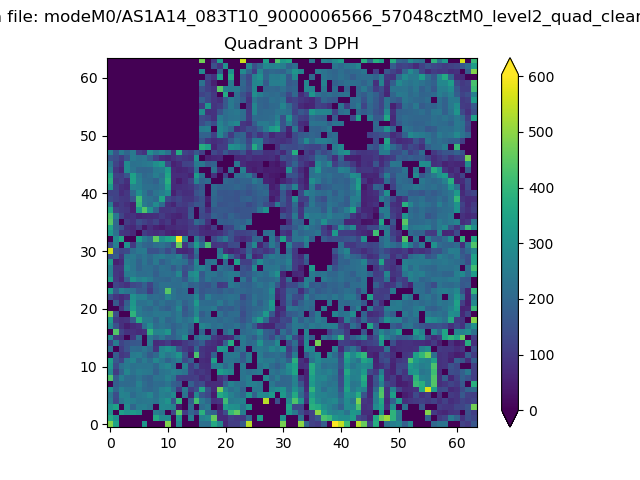 |
 |
Quadrant C |
| Plot type | Count rate plots | Images |
|---|---|---|
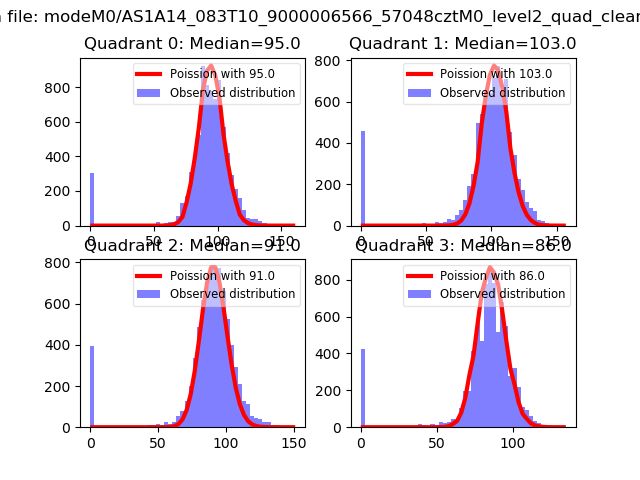
| Comparison with Poisson distribution Blue bars denote a histogram of data divided into 1 sec bins. Red curve is a Poisson curve with rate = median count rate of data. |
 |
 |
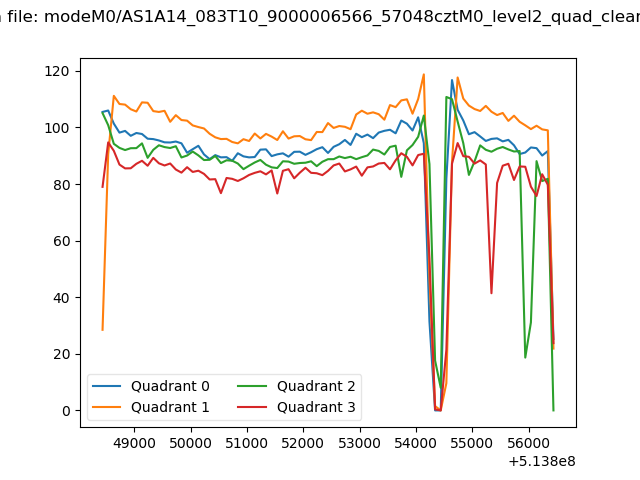
| Quadrant-wise count rates Data is divided into 100 sec bins |
 |
|
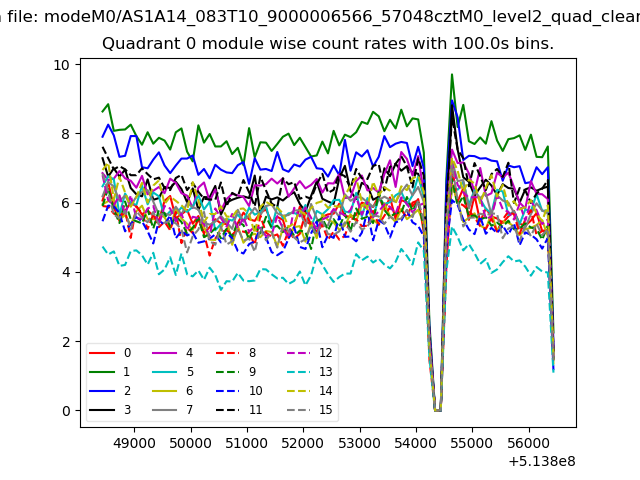
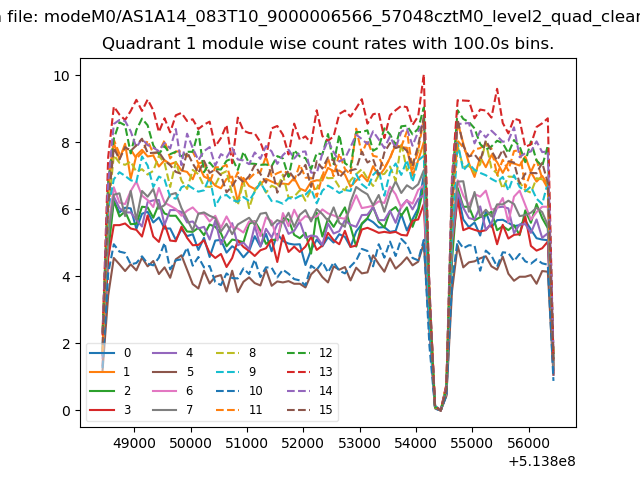
| Module-wise count rates for Quadrant A Data is divided into 100 sec bins |
 |
 |
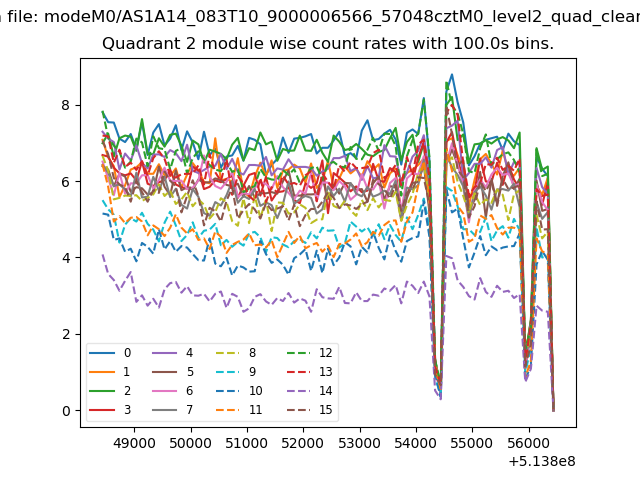
| Module-wise count rates for Quadrant B Data is divided into 100 sec bins |
 |
 |
| Module-wise count rates for Quadrant C Data is divided into 100 sec bins |
 |
 |
| Module-wise count rates for Quadrant D Data is divided into 100 sec bins |
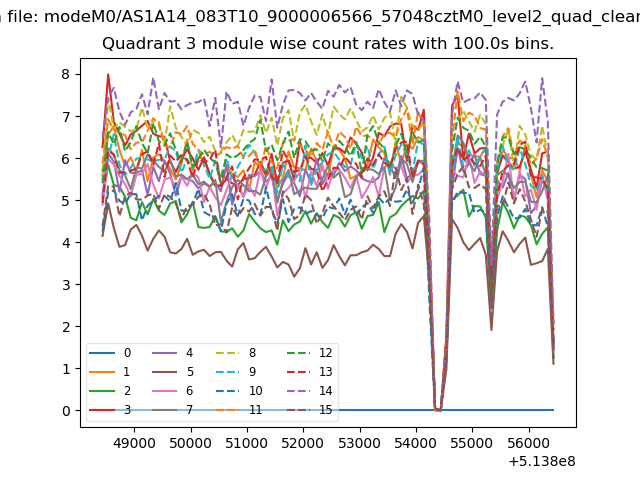 |
 |
| Parameter | Plot |
|---|---|
| CZT HV Monitor | 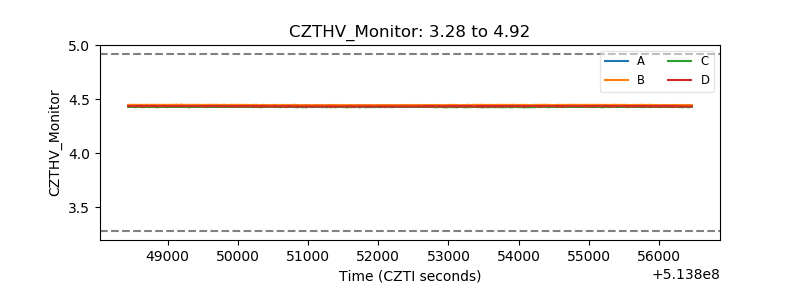 |
| D_VDD | 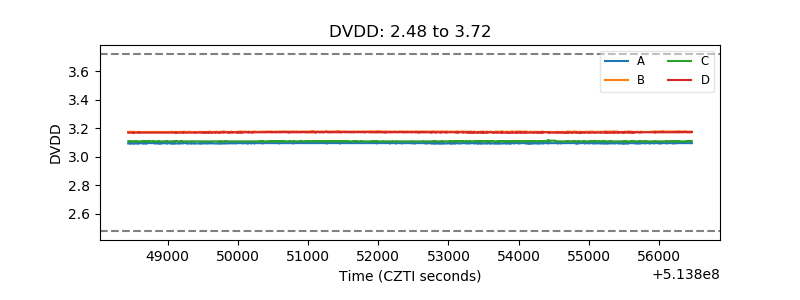 |
| Temperature 1 | 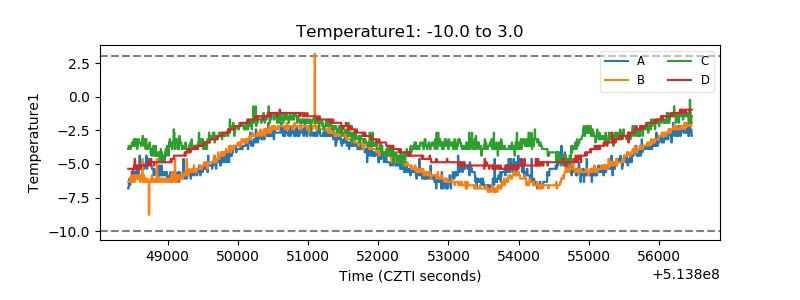 |
| Veto HV Monitor | 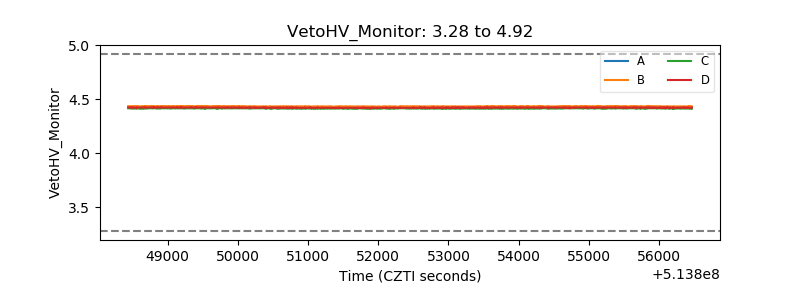 |
| Veto LLD | 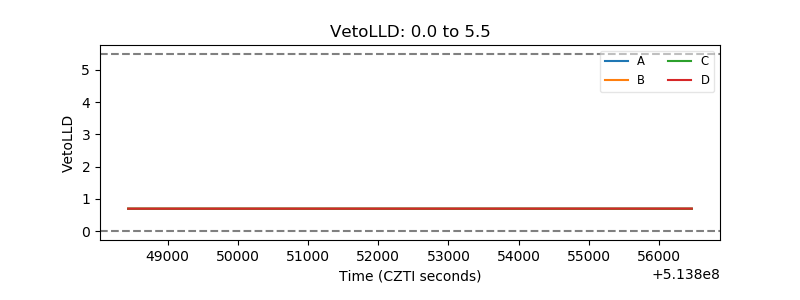 |
| Alpha Counter | 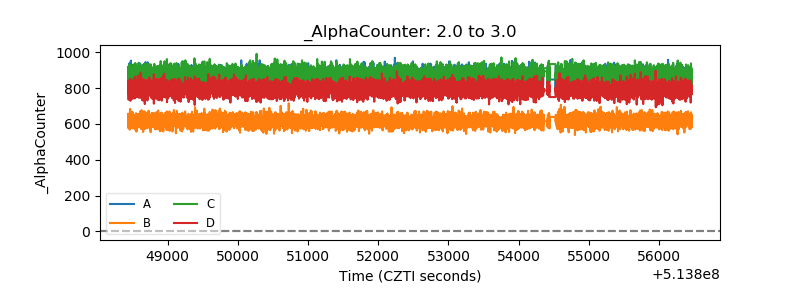 |
| _CPM_Rate | 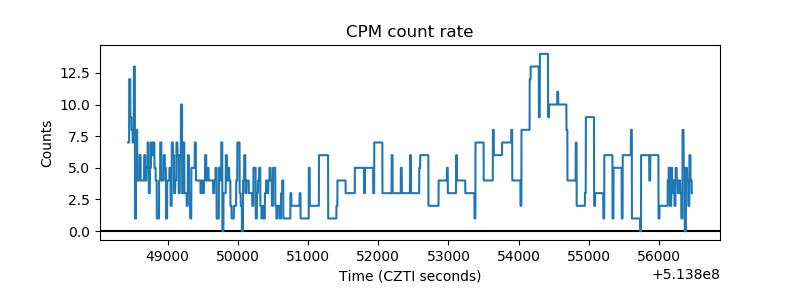 |
| CZT Counter | 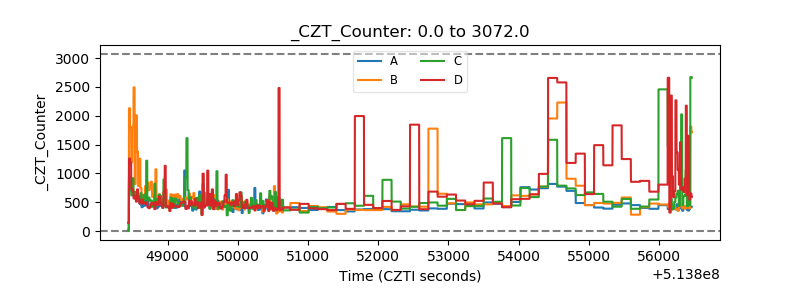 |
| +2.5 Volts monitor |  |
| +5 Volts monitor |  |
| _ROLL_ROT | 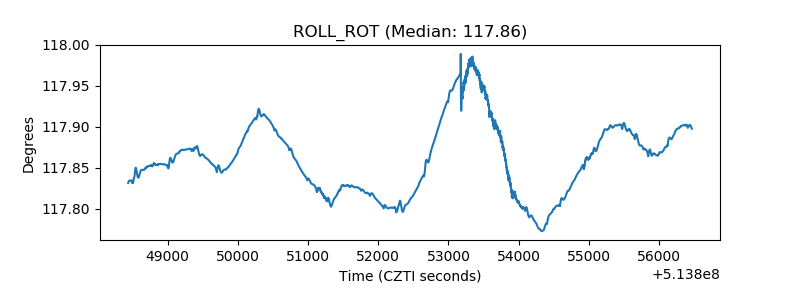 |
| _Roll_DEC | 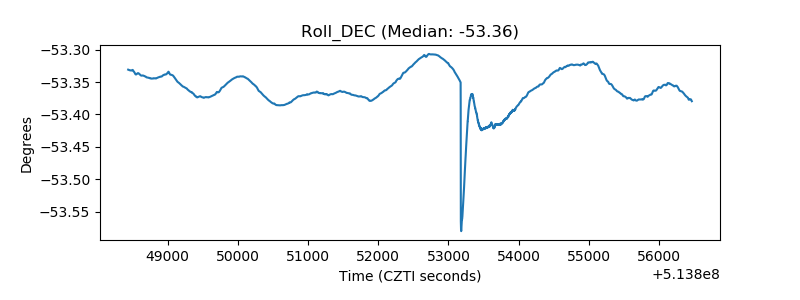 |
| _Roll_RA | 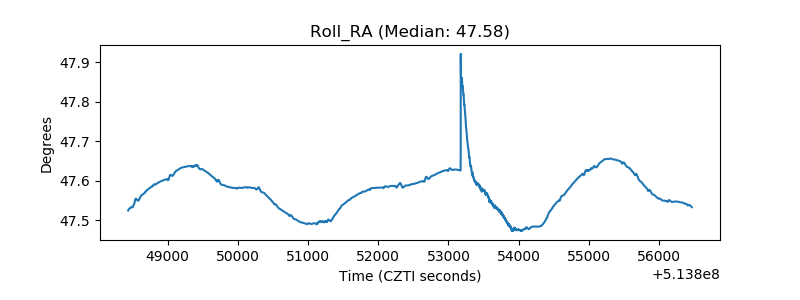 |
| Veto Counter | 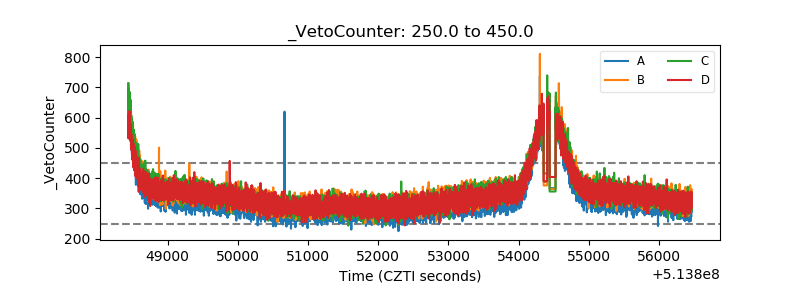 |