| Param | Original file | Final file |
|---|---|---|
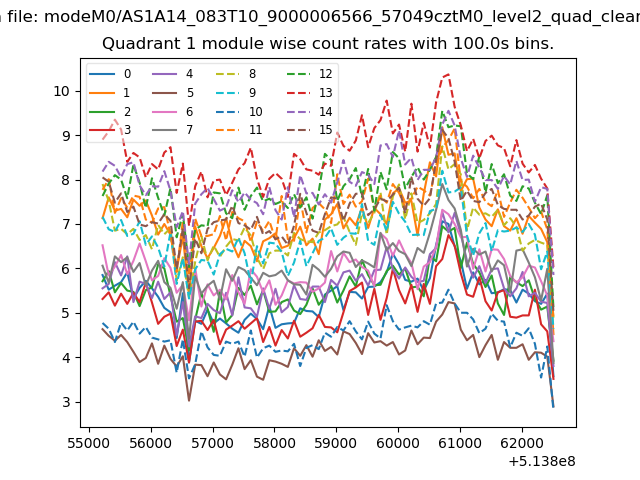
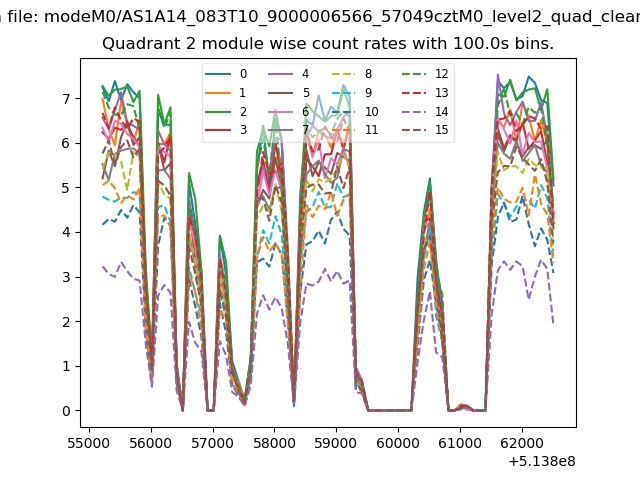
| Filename | modeM0/AS1A14_083T10_9000006566_57049cztM0_level2.fits | modeM0/AS1A14_083T10_9000006566_57049cztM0_level2_quad_clean.evt |
| Size (bytes) | 641,246,400 | 97,338,240 |
| Size | 611.5 MB | 92.8 MB |
| Events in quadrant A | 3,590,092 | 694,676 |
| Events in quadrant B | 3,545,788 | 751,942 |
| Events in quadrant C | 11,253,628 | 366,591 |
| Events in quadrant D | 4,774,098 | 620,525 |
| Mode M0 | |||
|---|---|---|---|
| Quadrant | BADHDUFLAG | Total packets | Discarded packets |
| A | 0 | 16088 | 0 |
| B | 0 | 15887 | 0 |
| C | 0 | 38396 | 0 |
| D | 0 | 19240 | 0 |
| Mode SS | |||
|---|---|---|---|
| Quadrant | BADHDUFLAG | Total packets | Discarded packets |
| A | 0 | 148 | 0 |
| B | 0 | 148 | 0 |
| C | 0 | 148 | 0 |
| D | 0 | 148 | 0 |
| Quadrant | Total seconds | Saturated seconds | Saturation percentage |
|---|---|---|---|
| A | 7375 | 71 | 0.962712% |
| B | 7376 | 74 | 1.003254% |
| C | 7376 | 3469 | 47.030911% |
| D | 7375 | 222 | 3.010169% |
Noise dominated data is calculated using 1-second bins in cleaned event files. If a bin has >2000 counts, and if more than 50% of those come from <1% of pixels, then it is considered to be noise-dominated and hence unusable.
| Quadrant | # 1 sec bins | Bins with >0 counts | Bins with >2000 counts | High rate bins dominated by noise | Noise dominated (total time) | Noise dominated (detector-on time) | Marked lightcurve |
|---|---|---|---|---|---|---|---|
| A | 7375 | 7375 | 75 | 75 | 1.02% | 1.02% | 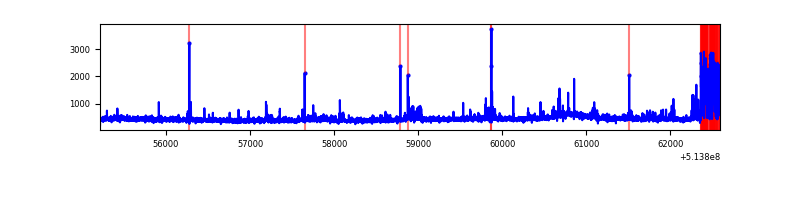 |
| B | 7376 | 7376 | 46 | 46 | 0.62% | 0.62% | 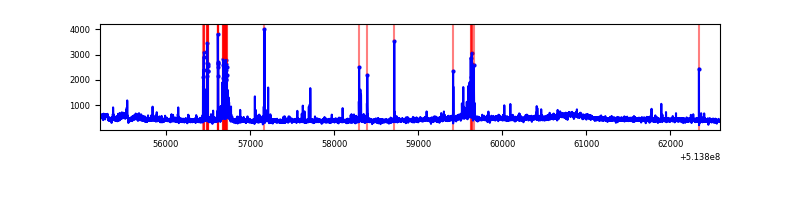 |
| C | 7376 | 7376 | 3106 | 3106 | 42.11% | 42.11% | 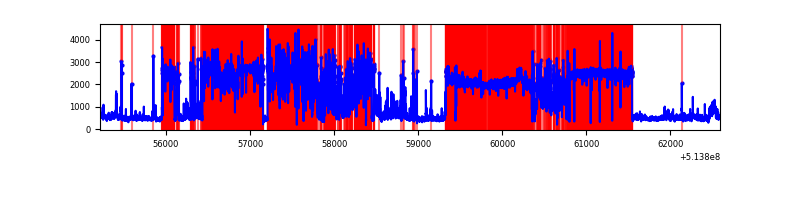 |
| D | 7375 | 7375 | 219 | 219 | 2.97% | 2.97% | 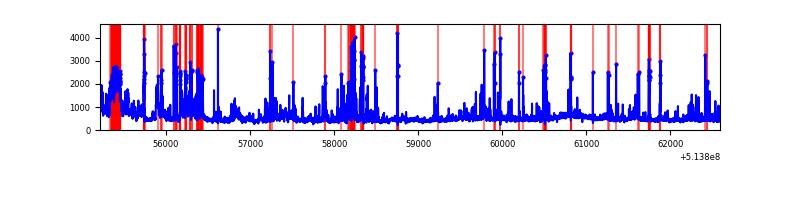 |
Top three noisy pixels from each quadrant. If the there are fewer than three noisy pixels in the level2.evt file, extra rows are filled as -1
| Pixel properties | Quadrant properties | ||||||
|---|---|---|---|---|---|---|---|
| Quadrant | DetID | PixID | Counts | Sigma | Mean | Median | Sigma |
| A | 3 | 14 | 312056 | 1566.05 | 797 | 776 | 198.8 |
| A | 10 | 251 | 60823 | 302.09 | 797 | 776 | 198.8 |
| A | 4 | 249 | 44138 | 218.15 | 797 | 776 | 198.8 |
| B | 0 | 213 | 139792 | 819.24 | 786 | 756 | 169.7 |
| B | 0 | 63 | 102122 | 597.28 | 786 | 756 | 169.7 |
| B | 5 | 185 | 88642 | 517.85 | 786 | 756 | 169.7 |
| C | 9 | 38 | 8326959 | 58306.7 | 521 | 515 | 142.8 |
| C | 15 | 209 | 214391 | 1497.69 | 521 | 515 | 142.8 |
| C | 13 | 23 | 187479 | 1309.23 | 521 | 515 | 142.8 |
| D | 15 | 142 | 600404 | 2774.46 | 767 | 732 | 216.1 |
| D | 3 | 12 | 280256 | 1293.25 | 767 | 732 | 216.1 |
| D | 7 | 96 | 272316 | 1256.52 | 767 | 732 | 216.1 |
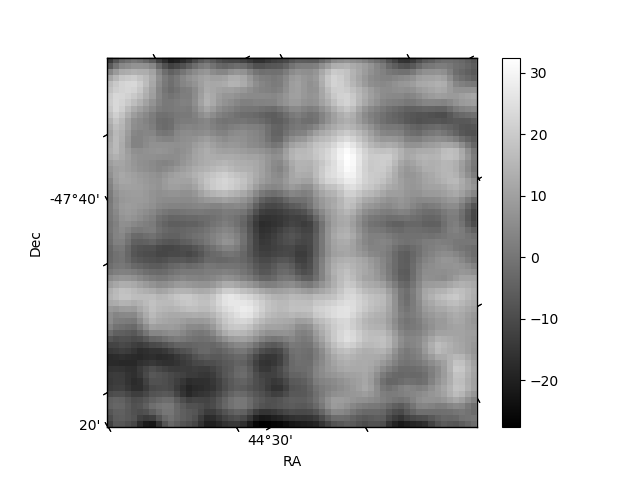
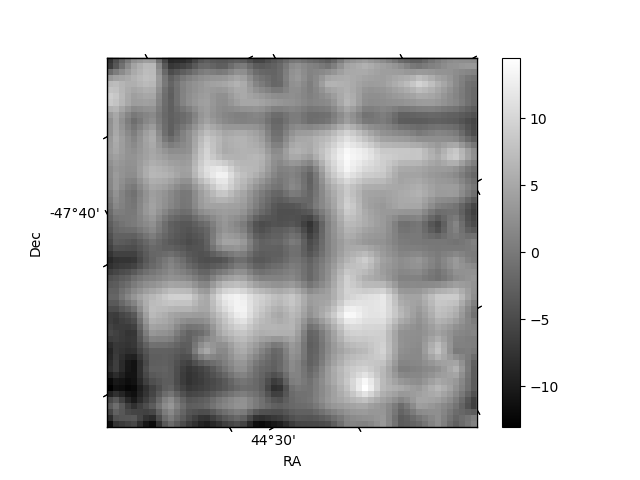
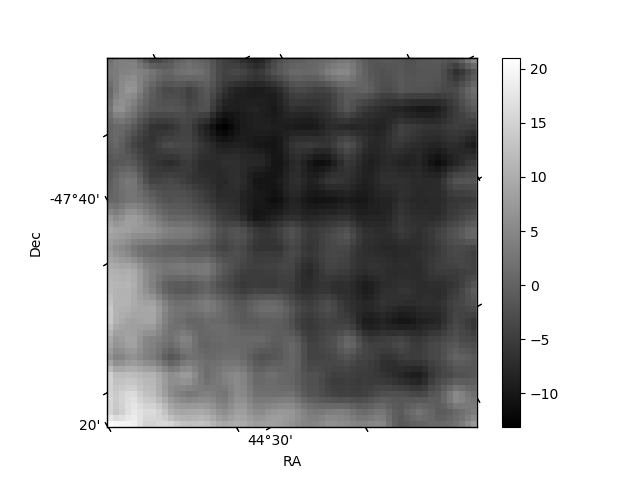
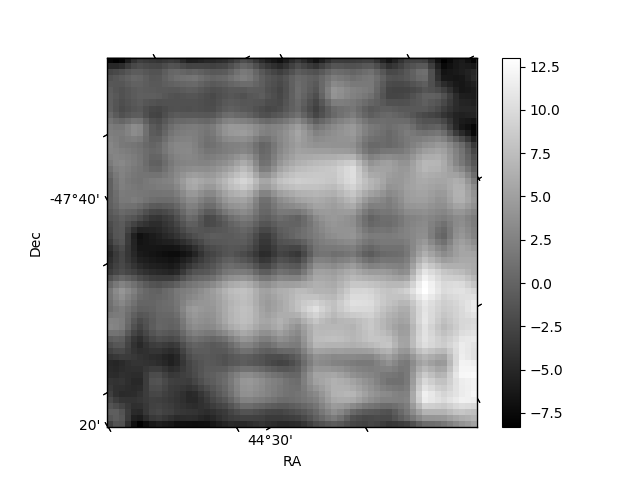
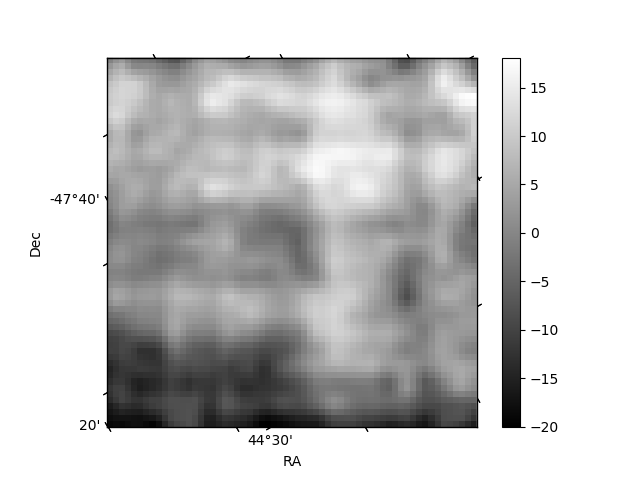
Histogram calculated using DETX and DETY for each event in the final _common_clean file
| Quadrant A | 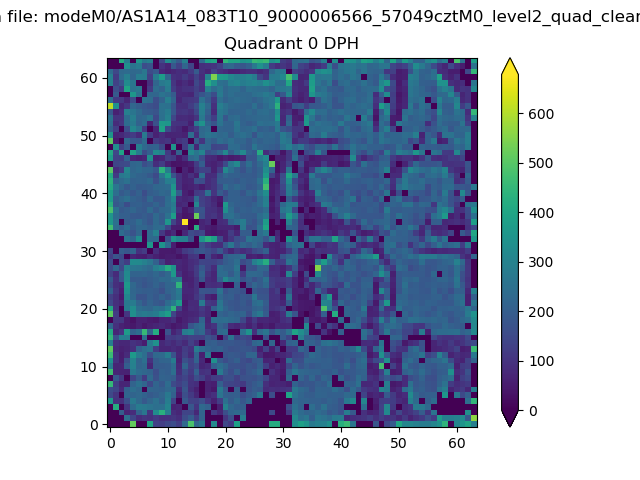 |
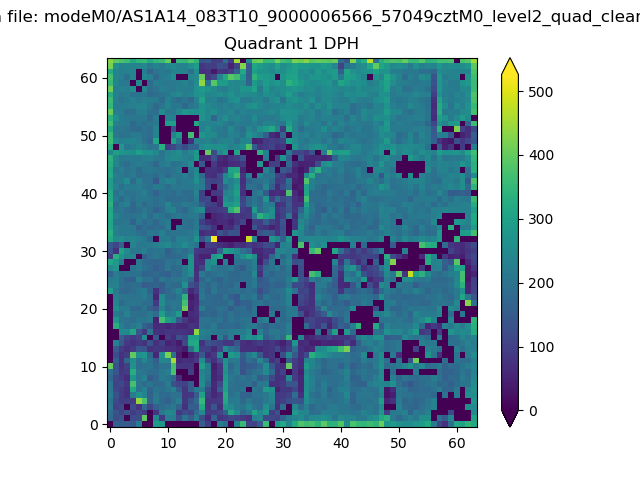 |
Quadrant B |
|---|---|---|---|
| Quadrant D | 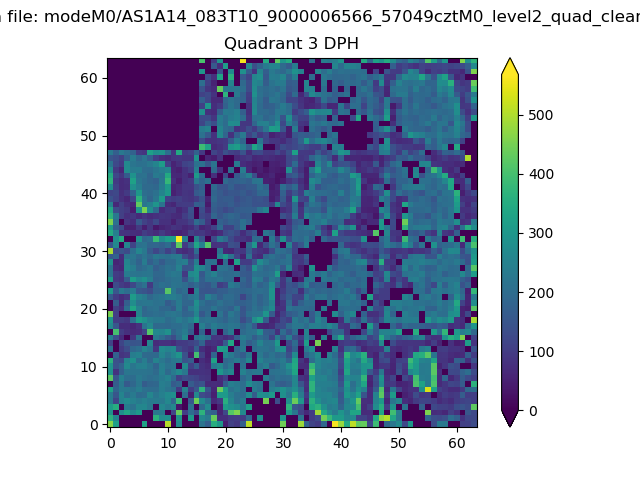 |
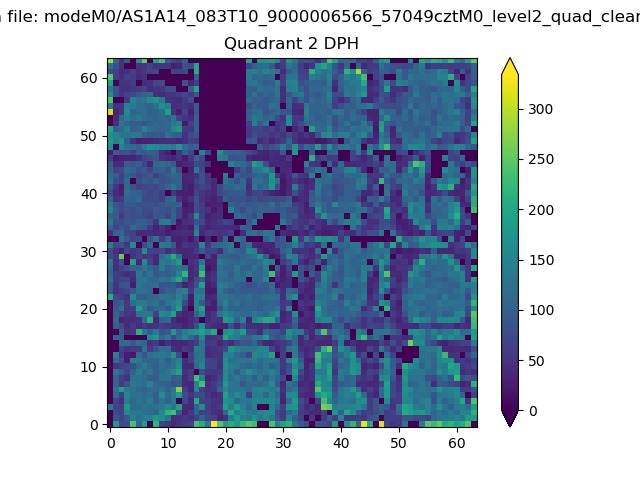 |
Quadrant C |
| Plot type | Count rate plots | Images |
|---|---|---|
| Comparison with Poisson distribution Blue bars denote a histogram of data divided into 1 sec bins. Red curve is a Poisson curve with rate = median count rate of data. |
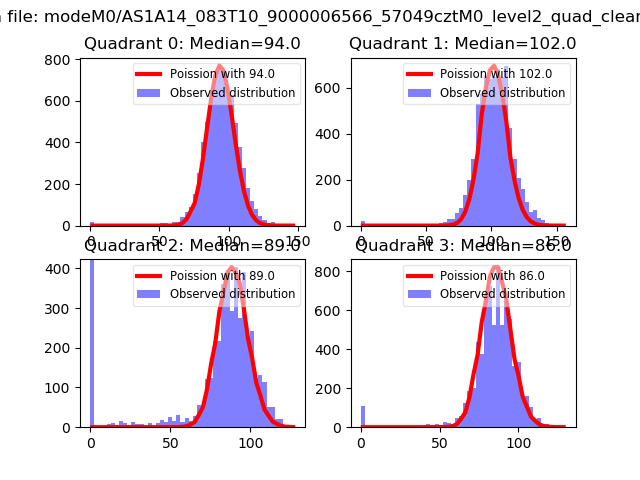 |
 |
| Quadrant-wise count rates Data is divided into 100 sec bins |
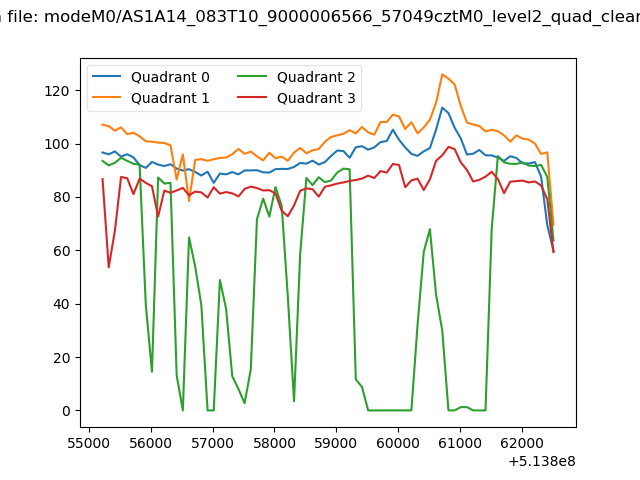 |
|
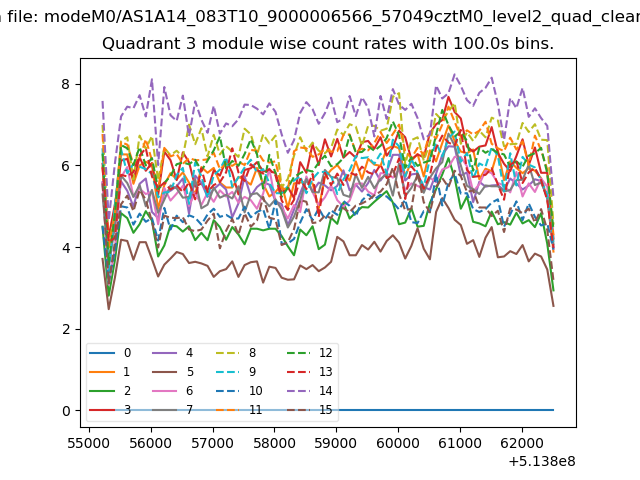
| Module-wise count rates for Quadrant A Data is divided into 100 sec bins |
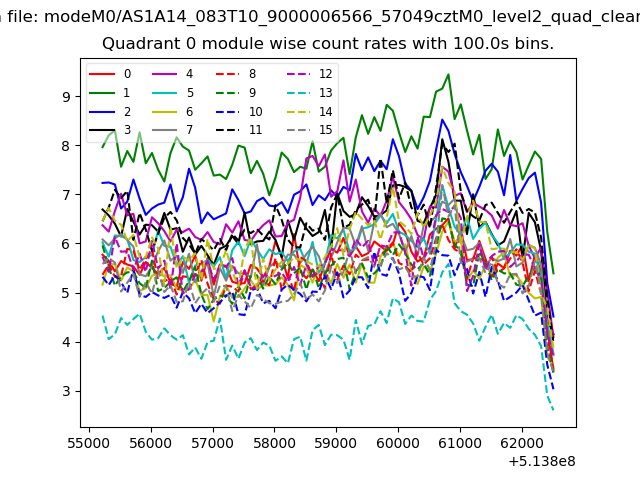 |
 |
| Module-wise count rates for Quadrant B Data is divided into 100 sec bins |
 |
 |
| Module-wise count rates for Quadrant C Data is divided into 100 sec bins |
 |
 |
| Module-wise count rates for Quadrant D Data is divided into 100 sec bins |
 |
 |
| Parameter | Plot |
|---|---|
| CZT HV Monitor | 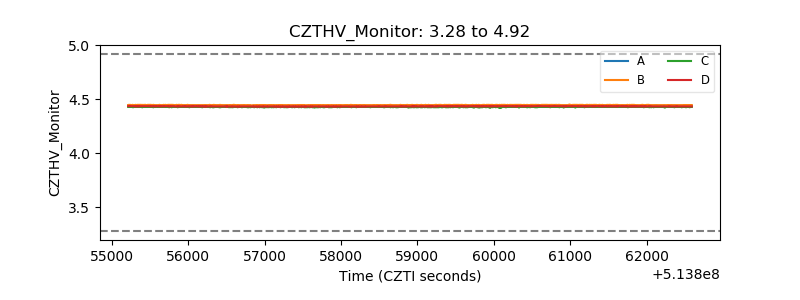 |
| D_VDD | 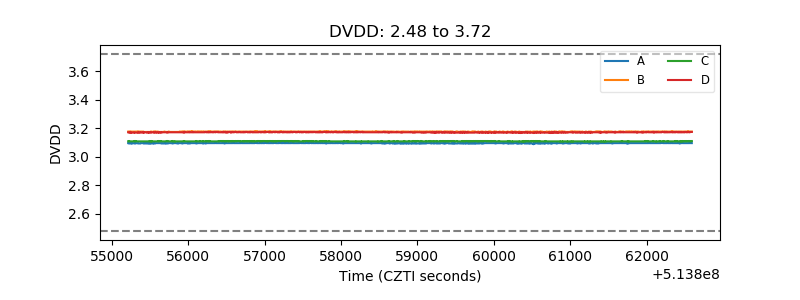 |
| Temperature 1 | 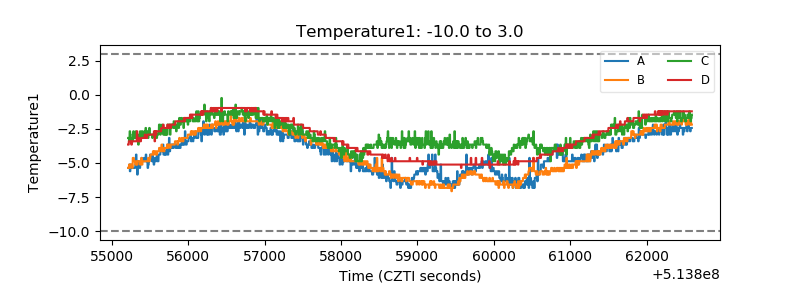 |
| Veto HV Monitor |  |
| Veto LLD | 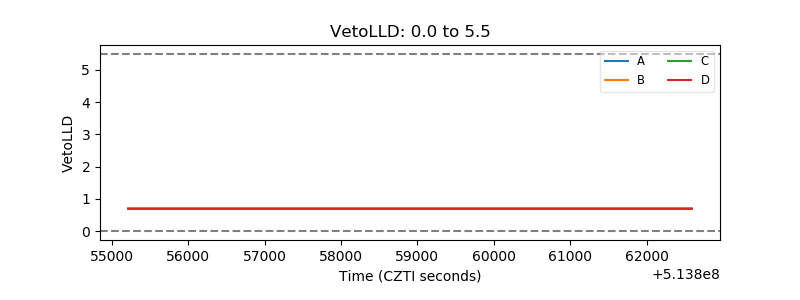 |
| Alpha Counter | 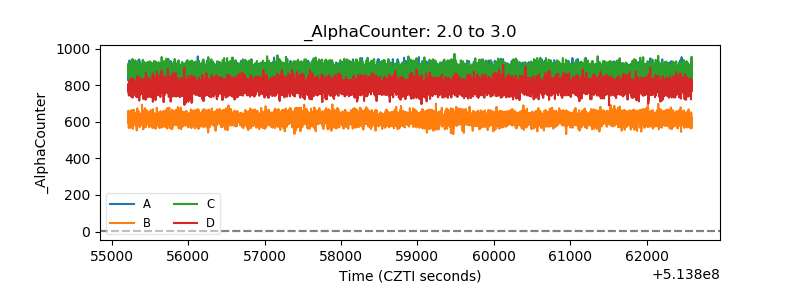 |
| _CPM_Rate | 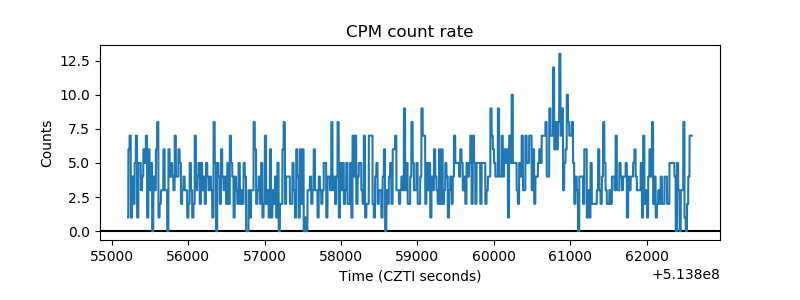 |
| CZT Counter | 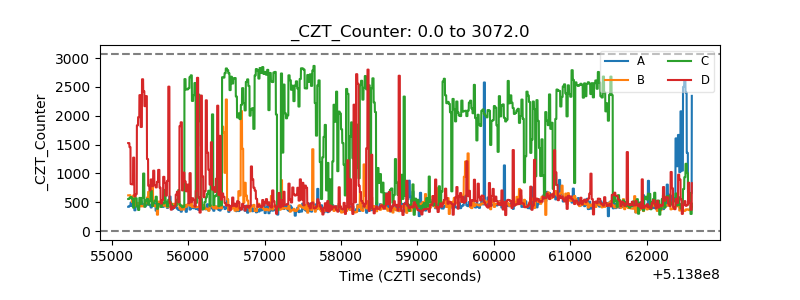 |
| +2.5 Volts monitor | 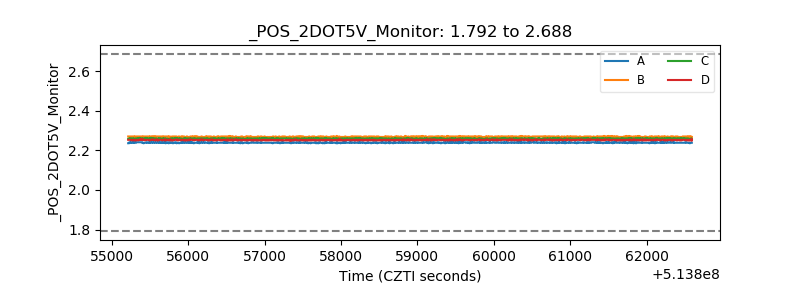 |
| +5 Volts monitor |  |
| _ROLL_ROT | 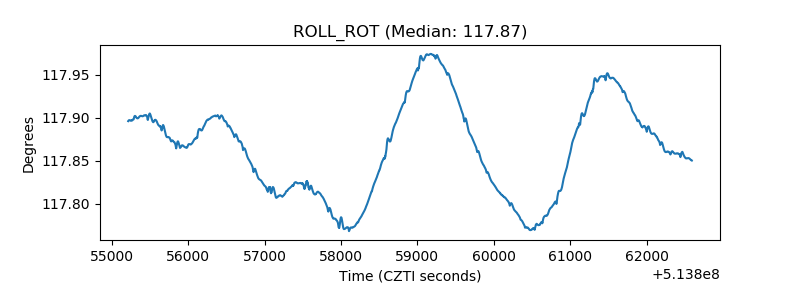 |
| _Roll_DEC | 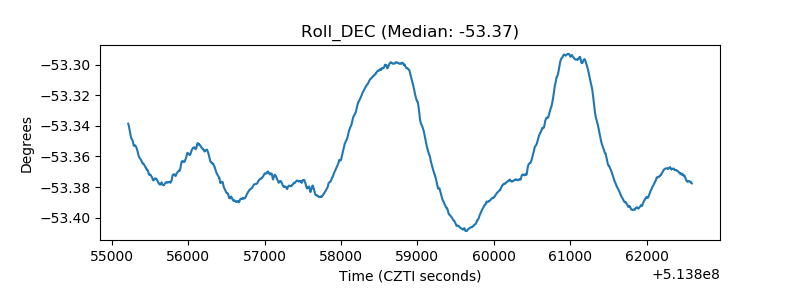 |
| _Roll_RA | 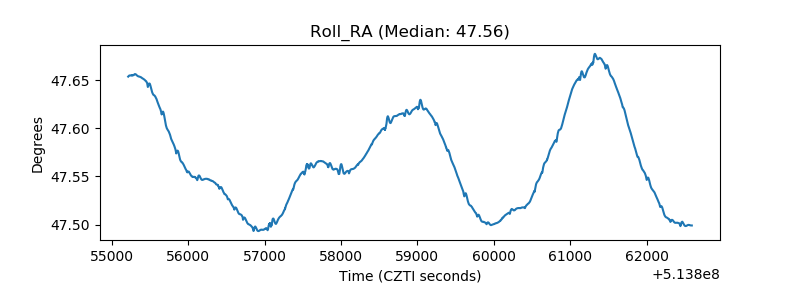 |
| Veto Counter | 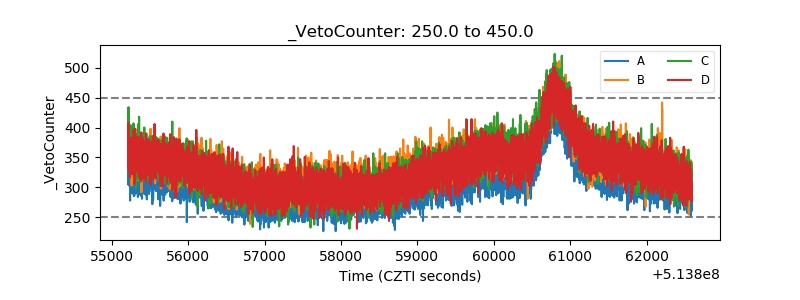 |