| Param | Original file | Final file |
|---|---|---|
| Filename | modeM0/AS1A14_083T10_9000006566_57050cztM0_level2.fits | modeM0/AS1A14_083T10_9000006566_57050cztM0_level2_quad_clean.evt |
| Size (bytes) | 425,779,200 | 107,121,600 |
| Size | 406.1 MB | 102.2 MB |
| Events in quadrant A | 4,004,673 | 692,521 |
| Events in quadrant B | 3,342,225 | 750,212 |
| Events in quadrant C | 3,842,697 | 665,843 |
| Events in quadrant D | 3,998,817 | 622,902 |
| Mode M0 | |||
|---|---|---|---|
| Quadrant | BADHDUFLAG | Total packets | Discarded packets |
| A | 0 | 17237 | 0 |
| B | 0 | 15221 | 0 |
| C | 0 | 16416 | 0 |
| D | 0 | 17094 | 3 |
| Mode SS | |||
|---|---|---|---|
| Quadrant | BADHDUFLAG | Total packets | Discarded packets |
| A | 0 | 146 | 0 |
| B | 0 | 146 | 0 |
| C | 0 | 146 | 0 |
| D | 0 | 146 | 0 |
| Quadrant | Total seconds | Saturated seconds | Saturation percentage |
|---|---|---|---|
| A | 7360 | 108 | 1.467391% |
| B | 7361 | 38 | 0.516234% |
| C | 7361 | 72 | 0.978128% |
| D | 7360 | 119 | 1.616848% |
Noise dominated data is calculated using 1-second bins in cleaned event files. If a bin has >2000 counts, and if more than 50% of those come from <1% of pixels, then it is considered to be noise-dominated and hence unusable.
| Quadrant | # 1 sec bins | Bins with >0 counts | Bins with >2000 counts | High rate bins dominated by noise | Noise dominated (total time) | Noise dominated (detector-on time) | Marked lightcurve |
|---|---|---|---|---|---|---|---|
| A | 7360 | 7360 | 128 | 128 | 1.74% | 1.74% | 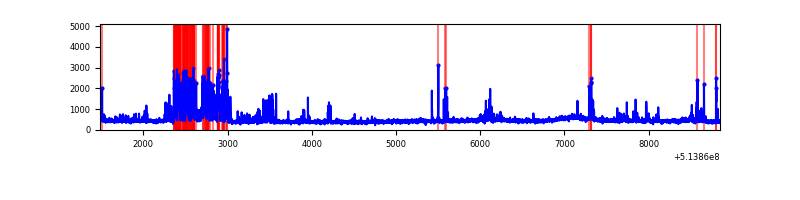 |
| B | 7361 | 7361 | 24 | 24 | 0.33% | 0.33% | 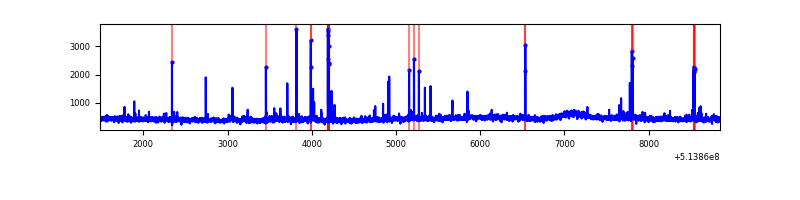 |
| C | 7361 | 7361 | 64 | 64 | 0.87% | 0.87% | 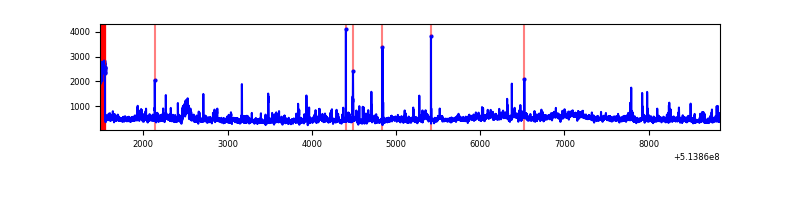 |
| D | 7360 | 7360 | 97 | 97 | 1.32% | 1.32% | 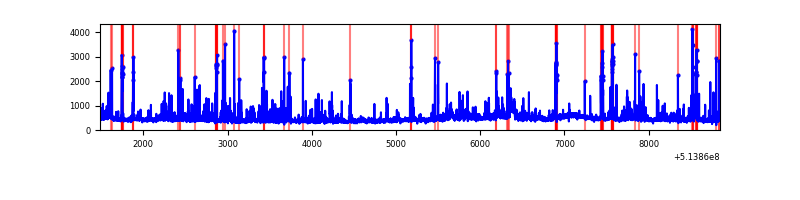 |
Top three noisy pixels from each quadrant. If the there are fewer than three noisy pixels in the level2.evt file, extra rows are filled as -1
| Pixel properties | Quadrant properties | ||||||
|---|---|---|---|---|---|---|---|
| Quadrant | DetID | PixID | Counts | Sigma | Mean | Median | Sigma |
| A | 3 | 14 | 729558 | 3742.13 | 791 | 770 | 194.8 |
| A | 10 | 251 | 115105 | 587.08 | 791 | 770 | 194.8 |
| A | 4 | 249 | 19688 | 97.14 | 791 | 770 | 194.8 |
| B | 0 | 63 | 68655 | 400.37 | 784 | 756 | 169.6 |
| B | 0 | 213 | 44032 | 255.18 | 784 | 756 | 169.6 |
| B | 4 | 201 | 37707 | 217.88 | 784 | 756 | 169.6 |
| C | 9 | 38 | 233536 | 1124.35 | 763 | 757 | 207.0 |
| C | 1 | 16 | 195225 | 939.3 | 763 | 757 | 207.0 |
| C | 14 | 67 | 142877 | 686.46 | 763 | 757 | 207.0 |
| D | 12 | 33 | 172215 | 790.42 | 766 | 730 | 217.0 |
| D | 3 | 12 | 138884 | 636.78 | 766 | 730 | 217.0 |
| D | 7 | 96 | 131891 | 604.55 | 766 | 730 | 217.0 |
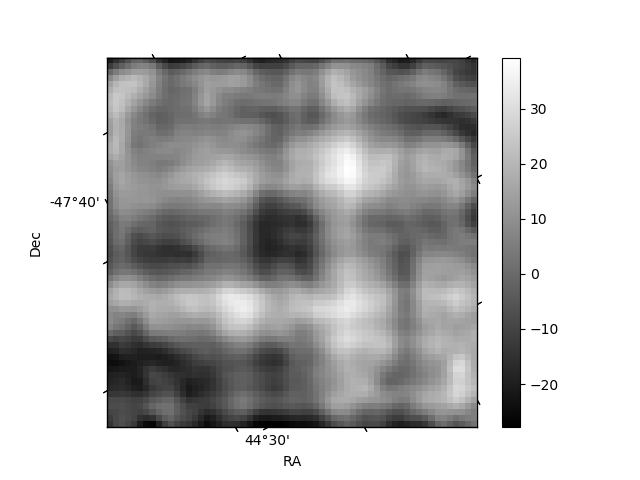
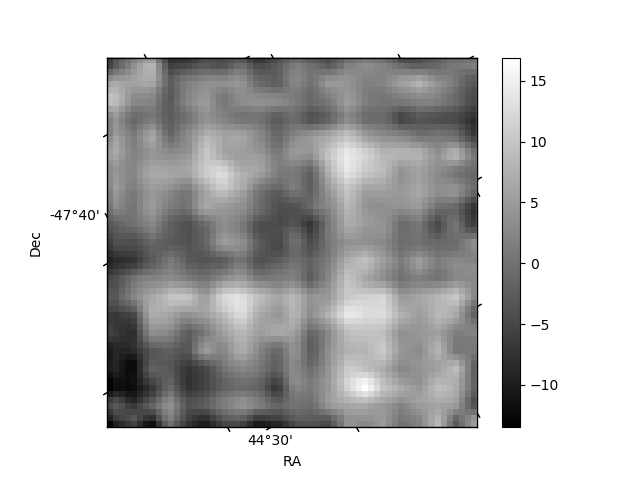
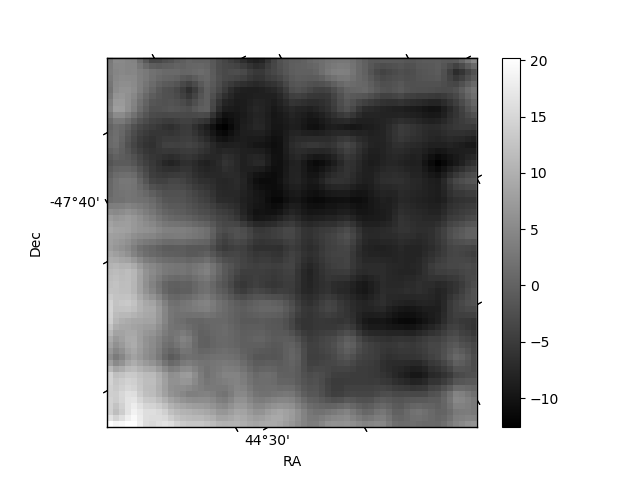
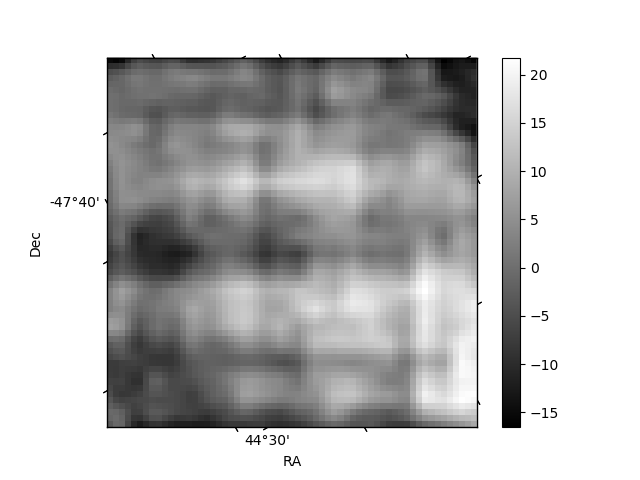
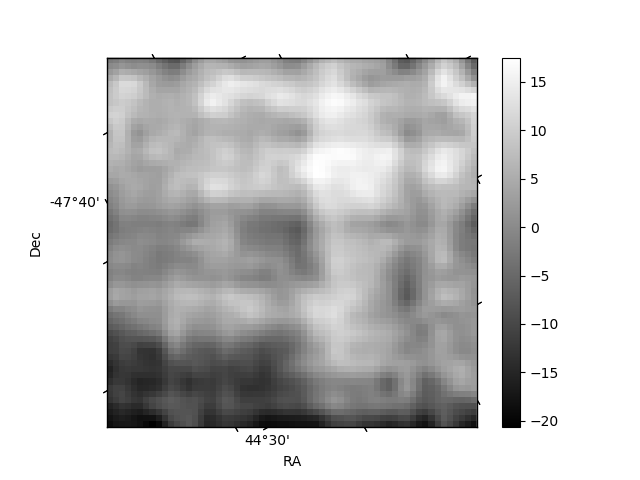
Histogram calculated using DETX and DETY for each event in the final _common_clean file
| Quadrant A | 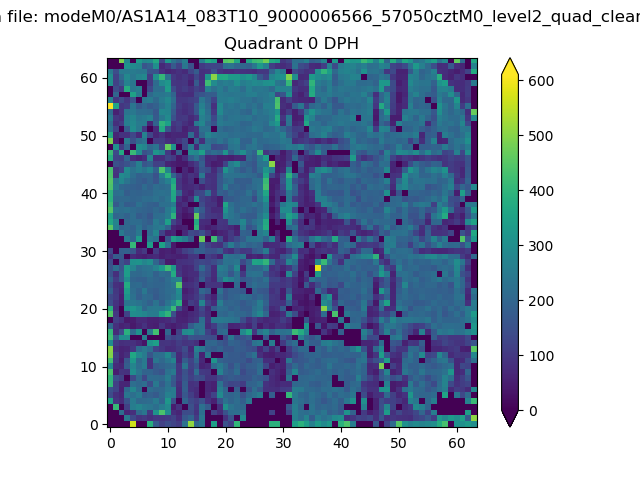 |
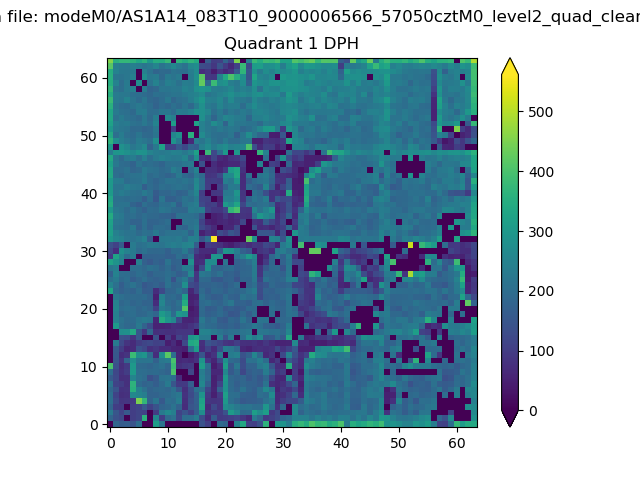 |
Quadrant B |
|---|---|---|---|
| Quadrant D | 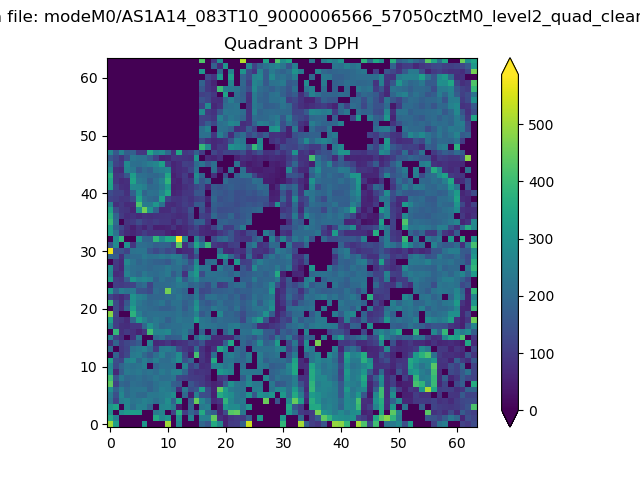 |
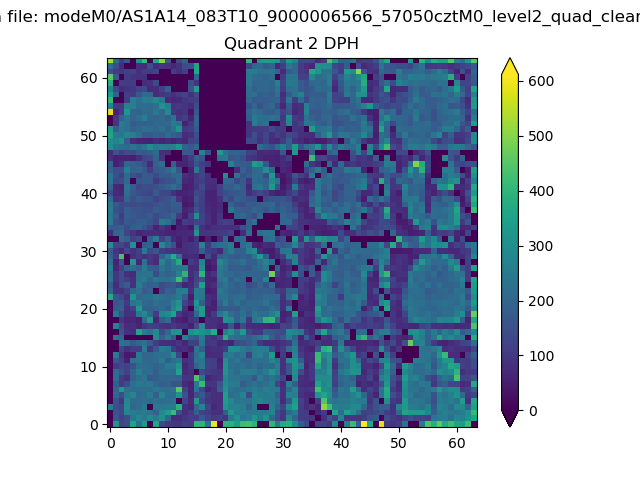 |
Quadrant C |
| Plot type | Count rate plots | Images |
|---|---|---|
| Comparison with Poisson distribution Blue bars denote a histogram of data divided into 1 sec bins. Red curve is a Poisson curve with rate = median count rate of data. |
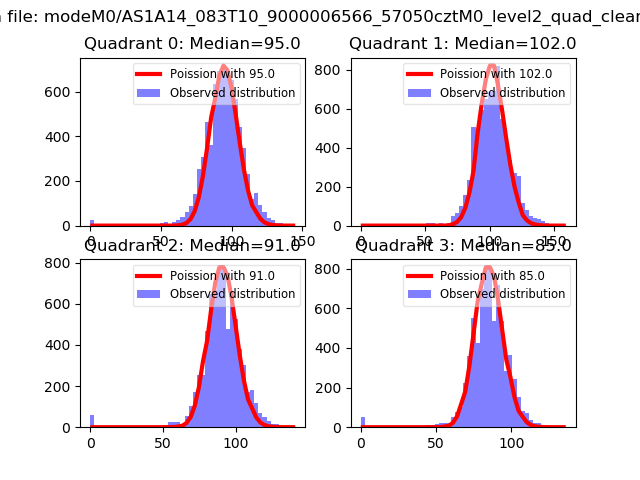 |
 |
| Quadrant-wise count rates Data is divided into 100 sec bins |
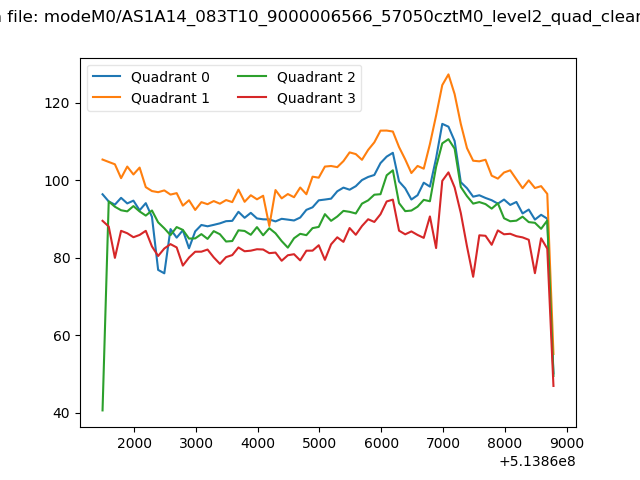 |
|
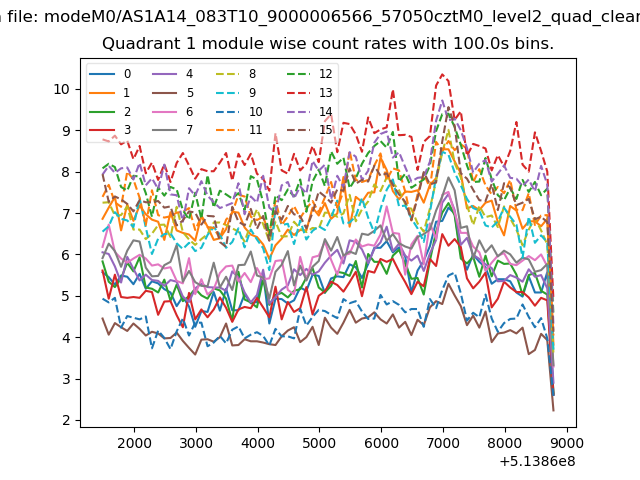
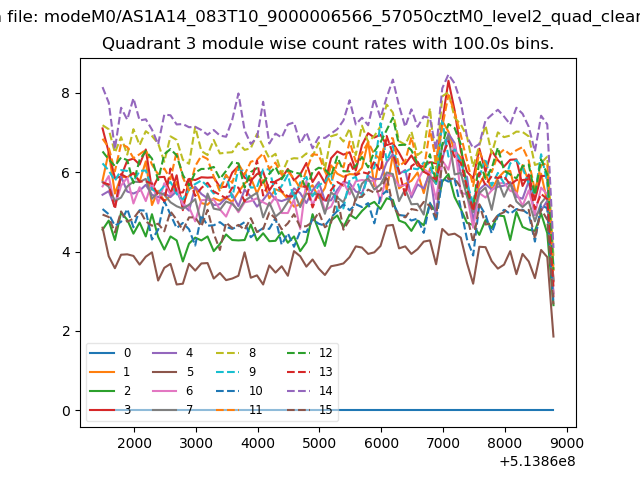
| Module-wise count rates for Quadrant A Data is divided into 100 sec bins |
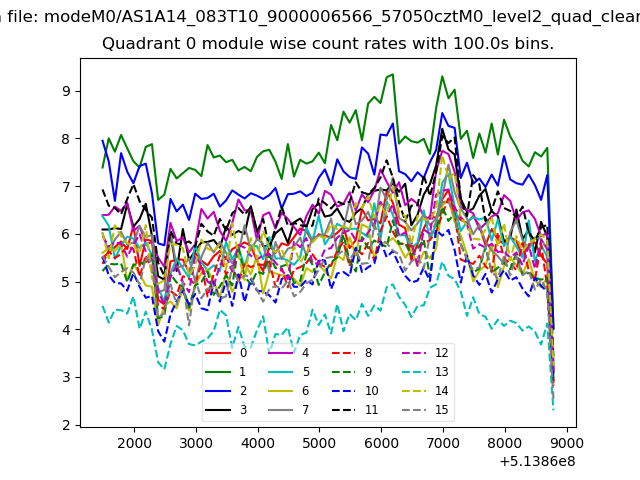 |
 |
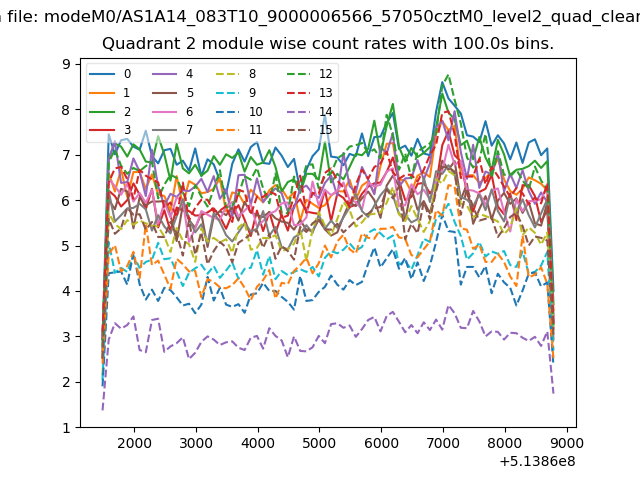
| Module-wise count rates for Quadrant B Data is divided into 100 sec bins |
 |
 |
| Module-wise count rates for Quadrant C Data is divided into 100 sec bins |
 |
 |
| Module-wise count rates for Quadrant D Data is divided into 100 sec bins |
 |
 |
| Parameter | Plot |
|---|---|
| CZT HV Monitor | 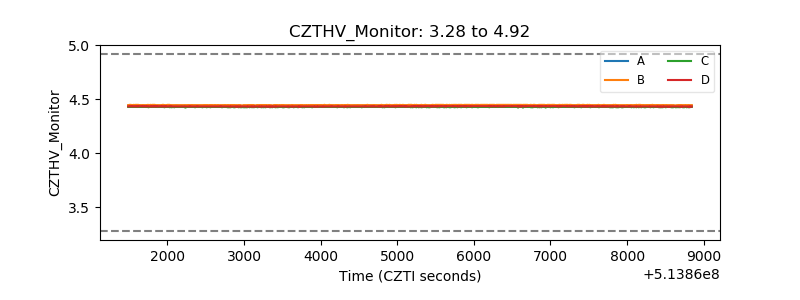 |
| D_VDD | 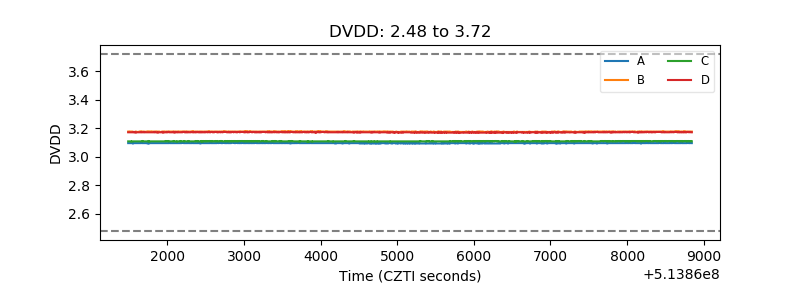 |
| Temperature 1 | 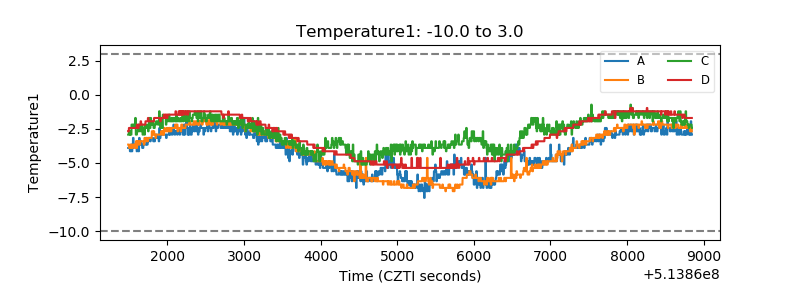 |
| Veto HV Monitor | 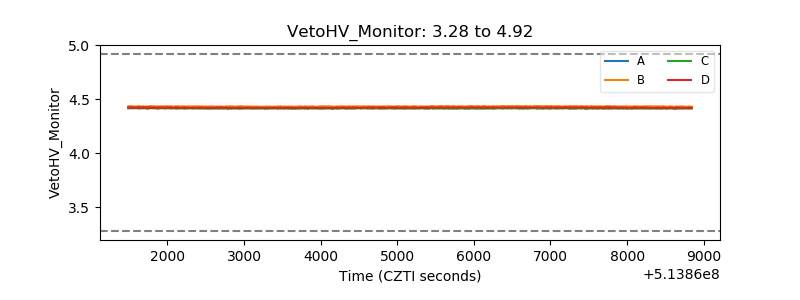 |
| Veto LLD | 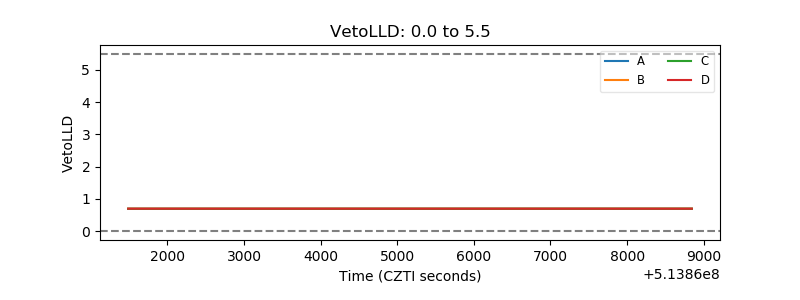 |
| Alpha Counter | 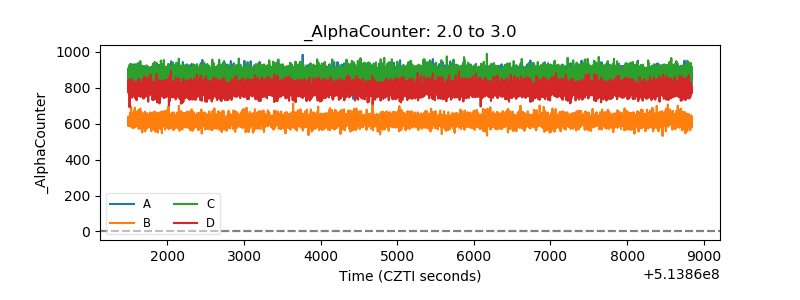 |
| _CPM_Rate | 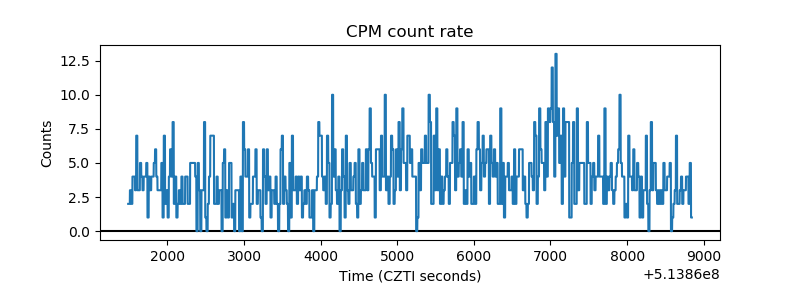 |
| CZT Counter | 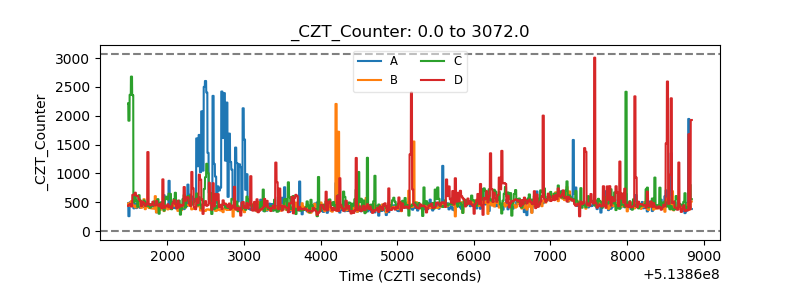 |
| +2.5 Volts monitor | 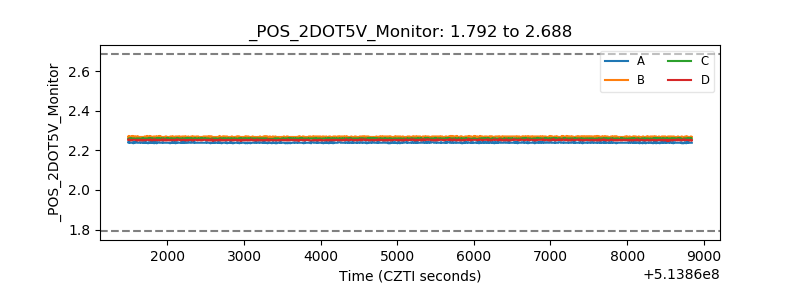 |
| +5 Volts monitor |  |
| _ROLL_ROT | 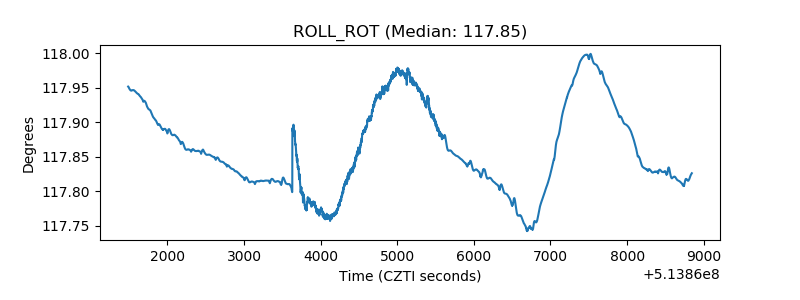 |
| _Roll_DEC | 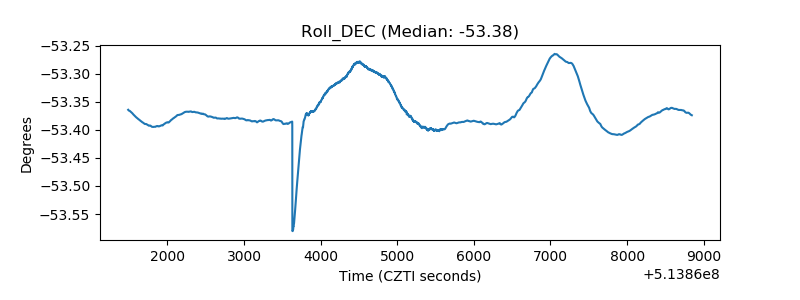 |
| _Roll_RA | 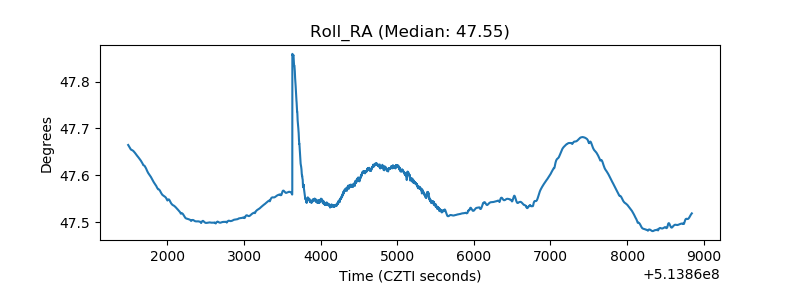 |
| Veto Counter | 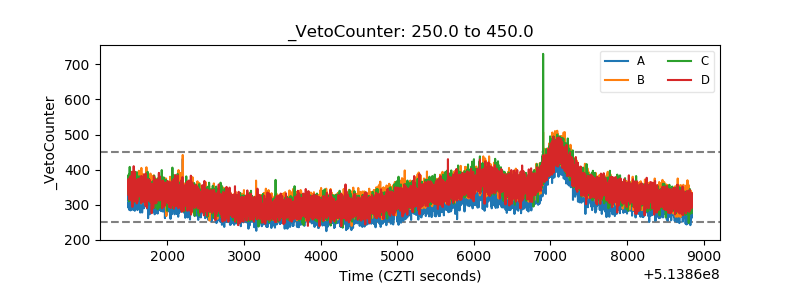 |