| Param | Original file | Final file |
|---|---|---|
| Filename | modeM0/AS1A14_083T10_9000006566_57053cztM0_level2.fits | modeM0/AS1A14_083T10_9000006566_57053cztM0_level2_quad_clean.evt |
| Size (bytes) | 1,142,055,360 | 268,096,320 |
| Size | 1.1 GB | 255.7 MB |
| Events in quadrant A | 9,313,963 | 1,757,162 |
| Events in quadrant B | 9,229,077 | 1,866,767 |
| Events in quadrant C | 11,144,052 | 1,615,913 |
| Events in quadrant D | 11,123,952 | 1,574,916 |
| Mode M9 | |||
|---|---|---|---|
| Quadrant | BADHDUFLAG | Total packets | Discarded packets |
| A | 0 | 10 | 0 |
| B | 0 | 10 | 0 |
| C | 0 | 10 | 0 |
| D | 0 | 10 | 0 |
| Mode M0 | |||
|---|---|---|---|
| Quadrant | BADHDUFLAG | Total packets | Discarded packets |
| A | 0 | 41436 | 4 |
| B | 0 | 41104 | 3 |
| C | 0 | 46183 | 3 |
| D | 0 | 46093 | 3 |
| Mode SS | |||
|---|---|---|---|
| Quadrant | BADHDUFLAG | Total packets | Discarded packets |
| A | 0 | 384 | 0 |
| B | 0 | 384 | 0 |
| C | 0 | 384 | 0 |
| D | 0 | 384 | 0 |
| Quadrant | Total seconds | Saturated seconds | Saturation percentage |
|---|---|---|---|
| A | 18895 | 271 | 1.434242% |
| B | 18896 | 481 | 2.545512% |
| C | 18896 | 749 | 3.963802% |
| D | 18896 | 404 | 2.138019% |
Noise dominated data is calculated using 1-second bins in cleaned event files. If a bin has >2000 counts, and if more than 50% of those come from <1% of pixels, then it is considered to be noise-dominated and hence unusable.
| Quadrant | # 1 sec bins | Bins with >0 counts | Bins with >2000 counts | High rate bins dominated by noise | Noise dominated (total time) | Noise dominated (detector-on time) | Marked lightcurve |
|---|---|---|---|---|---|---|---|
| A | 20025 | 18898 | 97 | 97 | 0.48% | 0.51% | 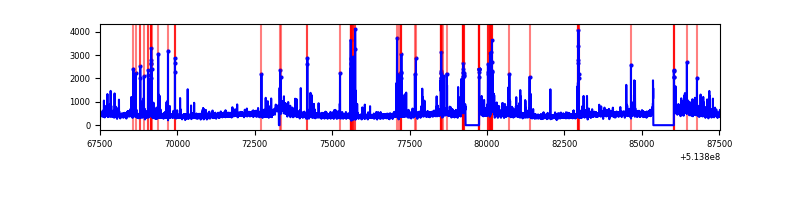 |
| B | 20026 | 18899 | 193 | 193 | 0.96% | 1.02% | 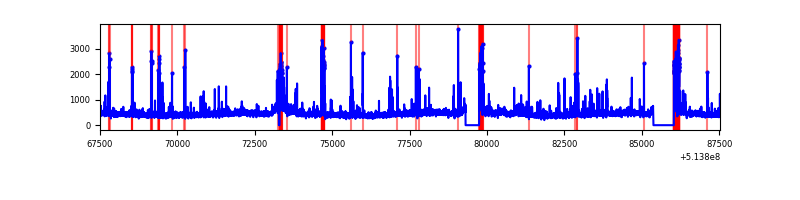 |
| C | 20026 | 18899 | 429 | 429 | 2.14% | 2.27% | 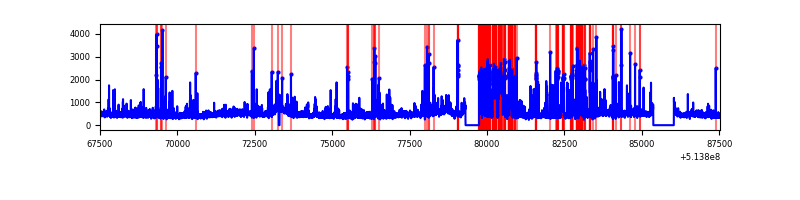 |
| D | 20026 | 18899 | 331 | 331 | 1.65% | 1.75% | 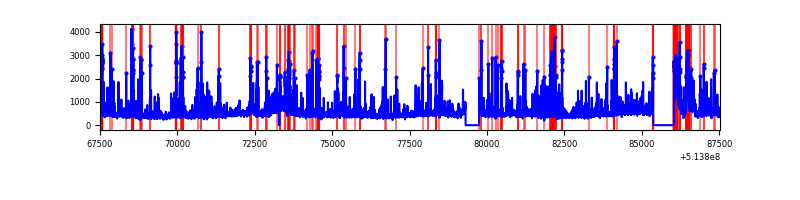 |
Top three noisy pixels from each quadrant. If the there are fewer than three noisy pixels in the level2.evt file, extra rows are filled as -1
| Pixel properties | Quadrant properties | ||||||
|---|---|---|---|---|---|---|---|
| Quadrant | DetID | PixID | Counts | Sigma | Mean | Median | Sigma |
| A | 3 | 14 | 623197 | 1240.57 | 2031 | 1975 | 500.8 |
| A | 10 | 251 | 245930 | 487.17 | 2031 | 1975 | 500.8 |
| A | 4 | 249 | 163014 | 321.59 | 2031 | 1975 | 500.8 |
| B | 10 | 16 | 493538 | 1161.52 | 1985 | 1907 | 423.3 |
| B | 0 | 63 | 251857 | 590.53 | 1985 | 1907 | 423.3 |
| B | 0 | 213 | 204559 | 478.78 | 1985 | 1907 | 423.3 |
| C | 9 | 38 | 2299583 | 4349.86 | 1955 | 1941 | 528.2 |
| C | 12 | 254 | 211319 | 396.39 | 1955 | 1941 | 528.2 |
| C | 6 | 223 | 206350 | 386.98 | 1955 | 1941 | 528.2 |
| D | 15 | 142 | 911694 | 1654.78 | 1951 | 1864 | 549.8 |
| D | 2 | 249 | 671826 | 1218.51 | 1951 | 1864 | 549.8 |
| D | 2 | 172 | 330945 | 598.53 | 1951 | 1864 | 549.8 |
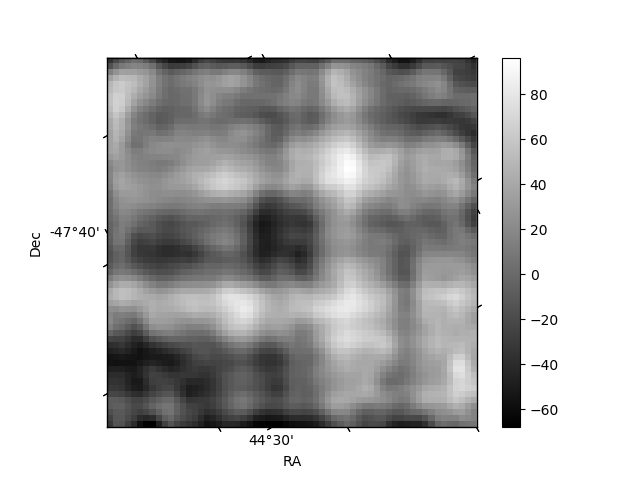
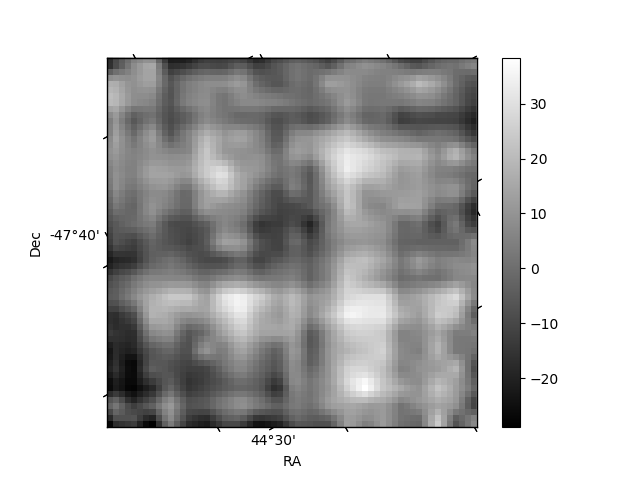
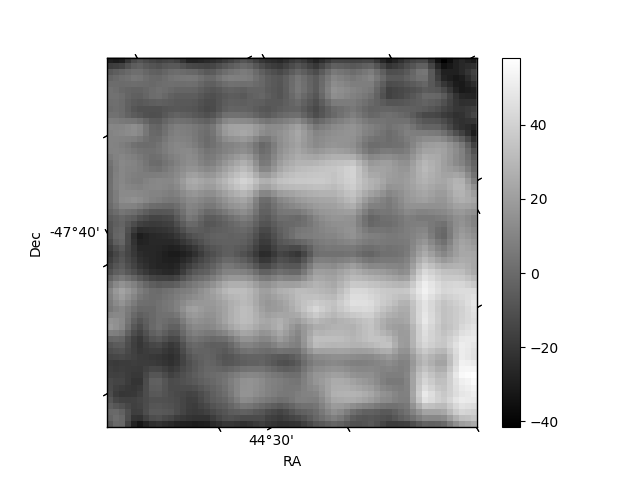
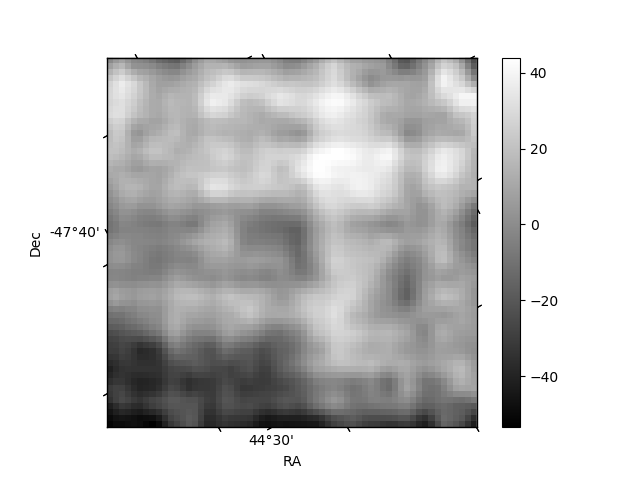
Histogram calculated using DETX and DETY for each event in the final _common_clean file
| Quadrant A | 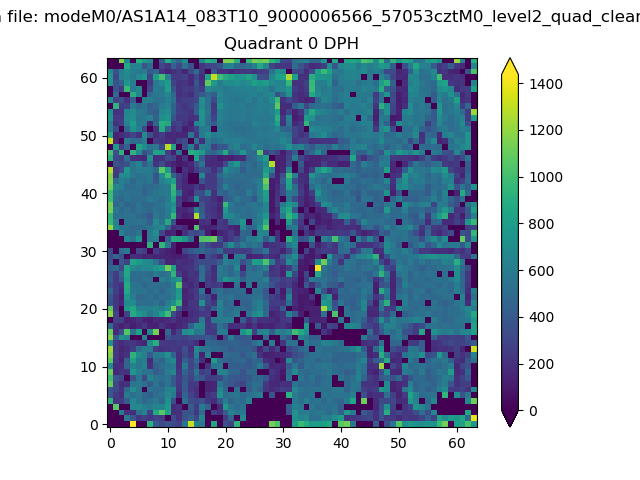 |
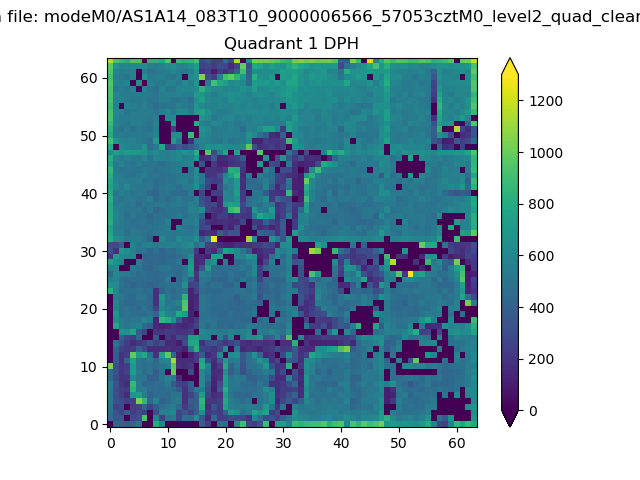 |
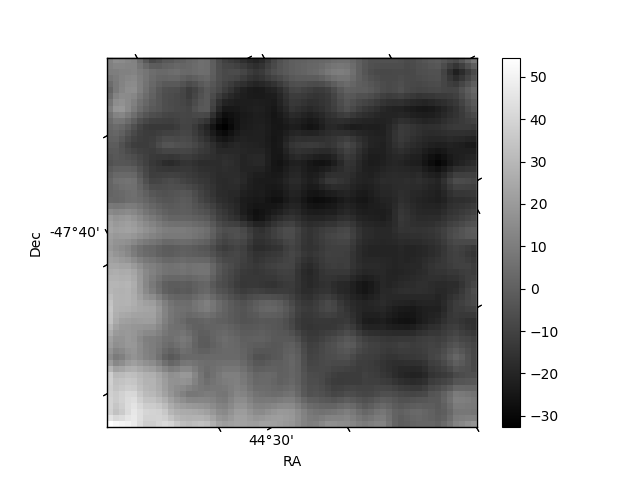
Quadrant B |
|---|---|---|---|
| Quadrant D | 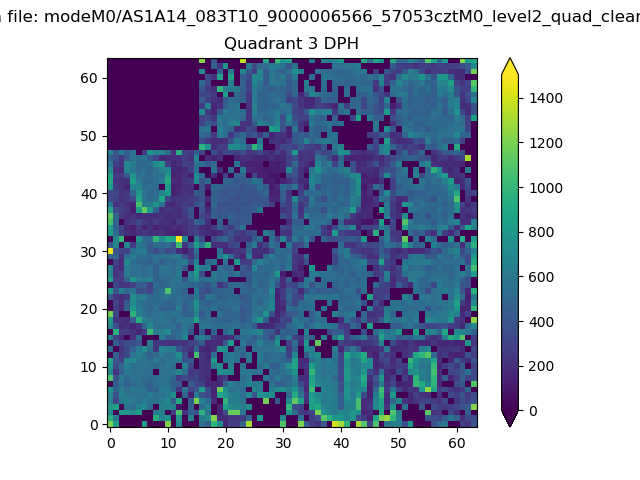 |
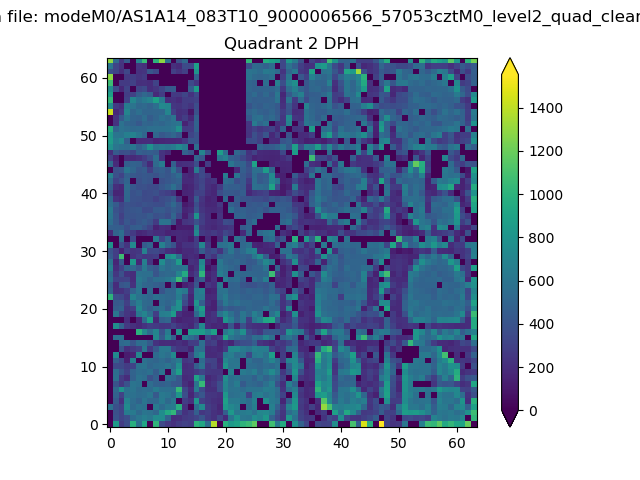 |
Quadrant C |
| Plot type | Count rate plots | Images |
|---|---|---|
| Comparison with Poisson distribution Blue bars denote a histogram of data divided into 1 sec bins. Red curve is a Poisson curve with rate = median count rate of data. |
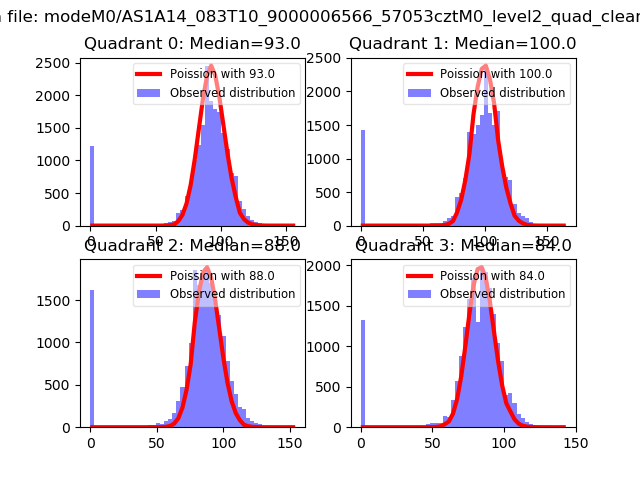 |
 |
| Quadrant-wise count rates Data is divided into 100 sec bins |
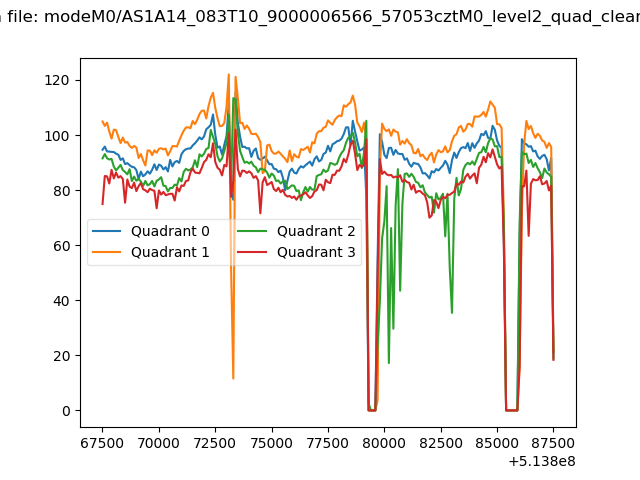 |
|
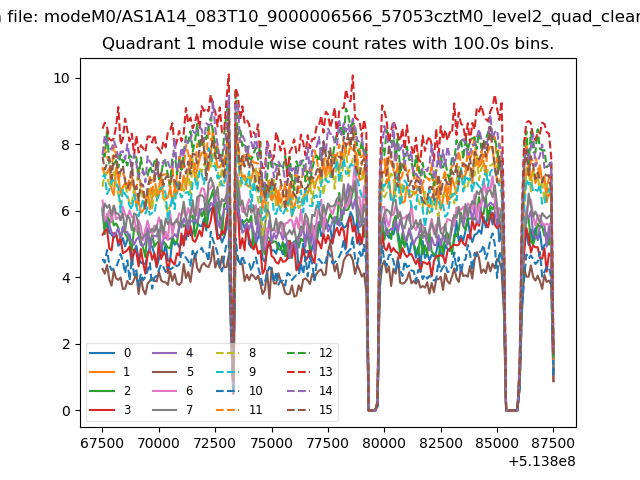
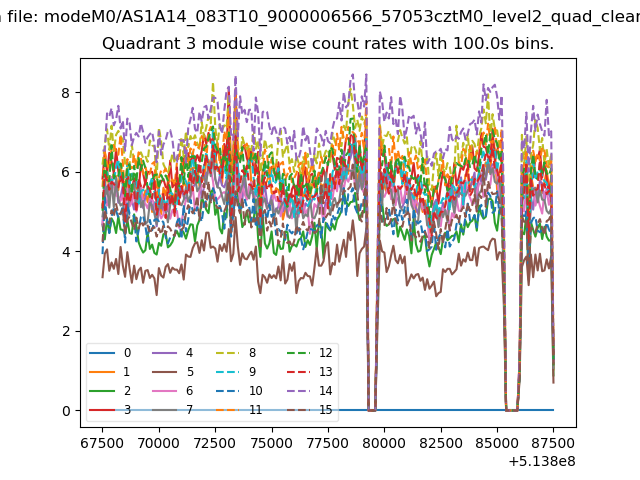
| Module-wise count rates for Quadrant A Data is divided into 100 sec bins |
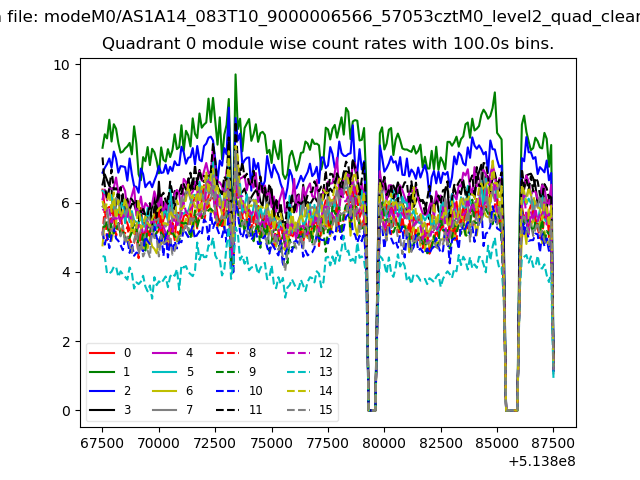 |
 |
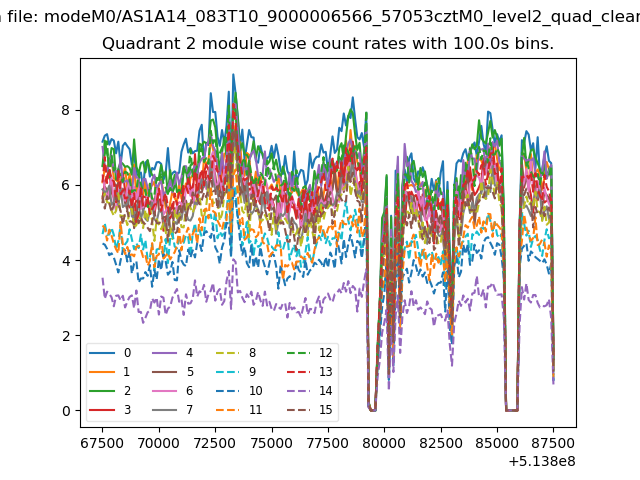
| Module-wise count rates for Quadrant B Data is divided into 100 sec bins |
 |
 |
| Module-wise count rates for Quadrant C Data is divided into 100 sec bins |
 |
 |
| Module-wise count rates for Quadrant D Data is divided into 100 sec bins |
 |
 |
| Parameter | Plot |
|---|---|
| CZT HV Monitor | 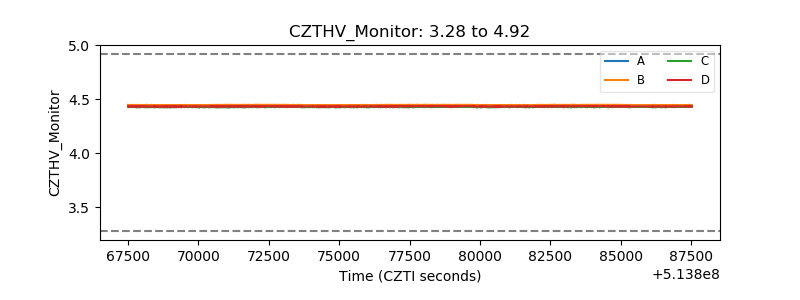 |
| D_VDD | 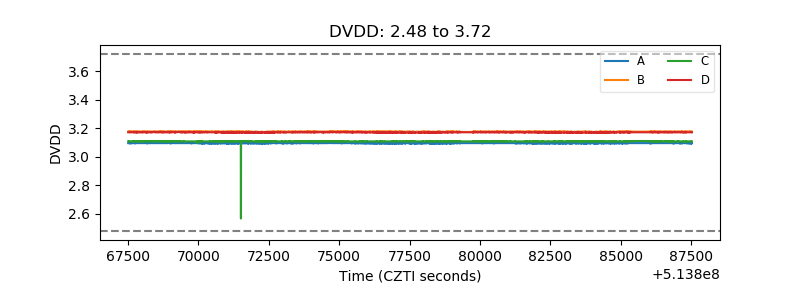 |
| Temperature 1 | 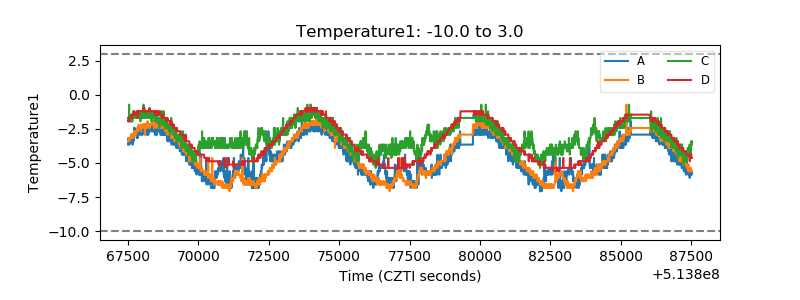 |
| Veto HV Monitor | 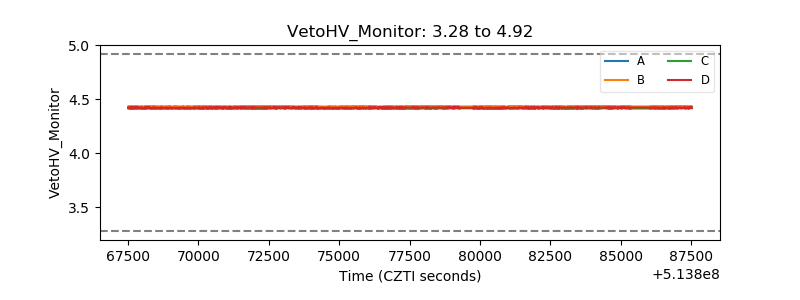 |
| Veto LLD | 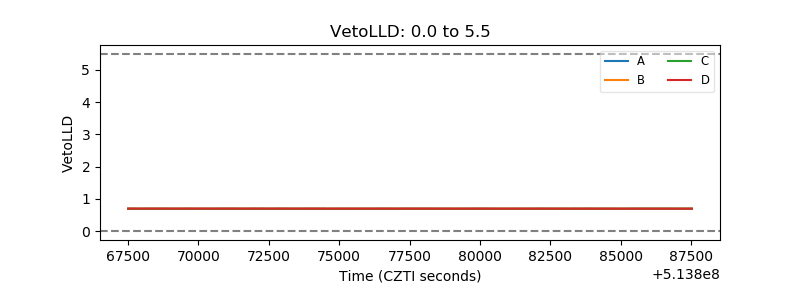 |
| Alpha Counter | 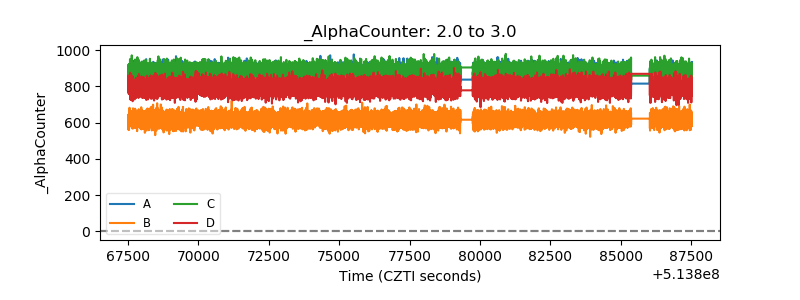 |
| _CPM_Rate | 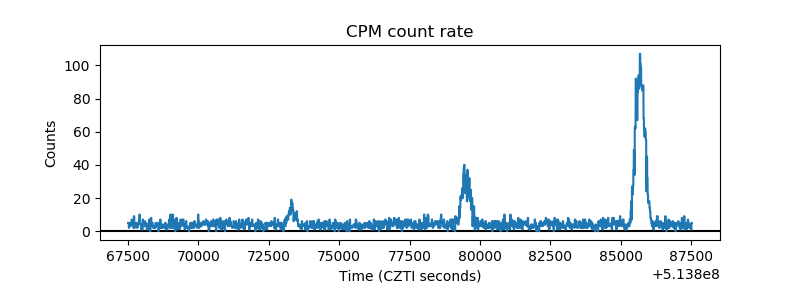 |
| CZT Counter | 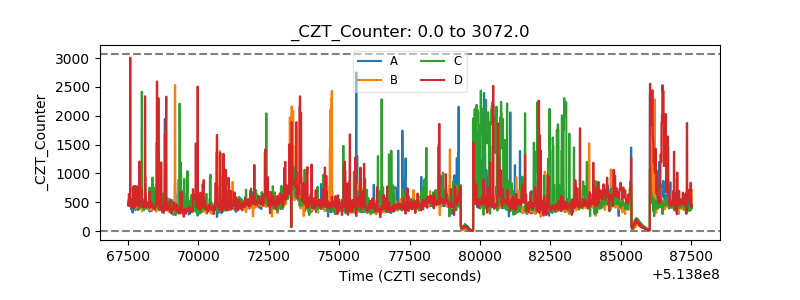 |
| +2.5 Volts monitor | 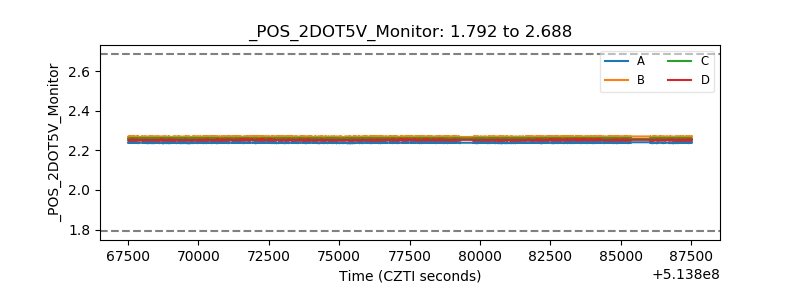 |
| +5 Volts monitor | 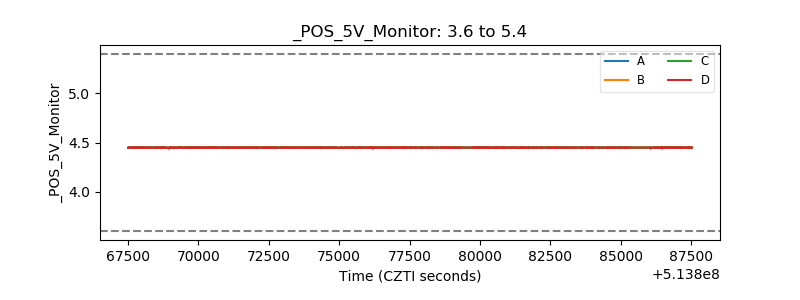 |
| _ROLL_ROT | 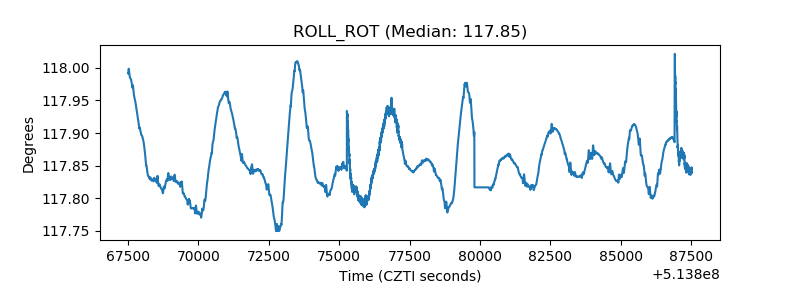 |
| _Roll_DEC | 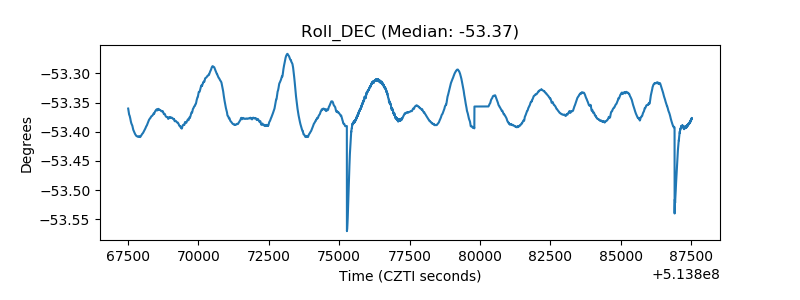 |
| _Roll_RA | 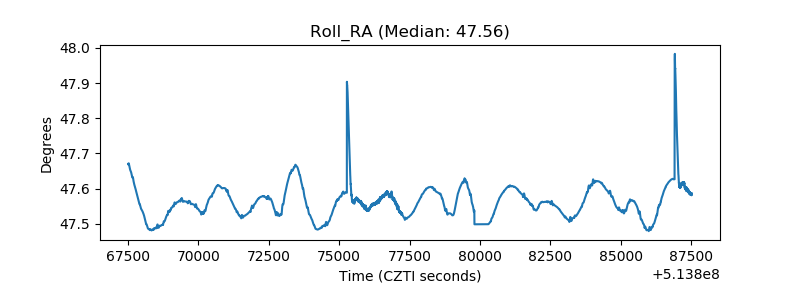 |
| Veto Counter | 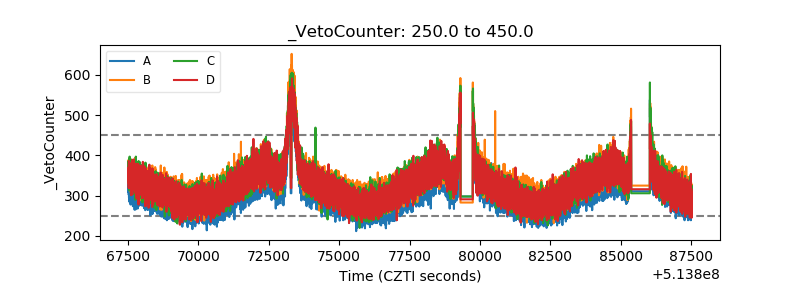 |