| Param | Original file | Final file |
|---|---|---|
| Filename | modeM0/AS1A14_083T10_9000006566_57054cztM0_level2.fits | modeM0/AS1A14_083T10_9000006566_57054cztM0_level2_quad_clean.evt |
| Size (bytes) | 480,286,080 | 96,459,840 |
| Size | 458.0 MB | 92.0 MB |
| Events in quadrant A | 3,558,697 | 642,016 |
| Events in quadrant B | 3,730,876 | 665,272 |
| Events in quadrant C | 4,339,495 | 594,404 |
| Events in quadrant D | 5,618,888 | 542,574 |
| Mode M9 | |||
|---|---|---|---|
| Quadrant | BADHDUFLAG | Total packets | Discarded packets |
| A | 0 | 10 | 0 |
| B | 0 | 11 | 0 |
| C | 0 | 11 | 0 |
| D | 0 | 11 | 0 |
| Mode M0 | |||
|---|---|---|---|
| Quadrant | BADHDUFLAG | Total packets | Discarded packets |
| A | 0 | 15492 | 2 |
| B | 0 | 15943 | 2 |
| C | 0 | 17785 | 2 |
| D | 0 | 21249 | 2 |
| Mode SS | |||
|---|---|---|---|
| Quadrant | BADHDUFLAG | Total packets | Discarded packets |
| A | 0 | 140 | 0 |
| B | 0 | 140 | 0 |
| C | 0 | 140 | 0 |
| D | 0 | 140 | 0 |
| Quadrant | Total seconds | Saturated seconds | Saturation percentage |
|---|---|---|---|
| A | 6834 | 80 | 1.170618% |
| B | 6834 | 297 | 4.345917% |
| C | 6834 | 280 | 4.097161% |
| D | 6833 | 472 | 6.907654% |
Noise dominated data is calculated using 1-second bins in cleaned event files. If a bin has >2000 counts, and if more than 50% of those come from <1% of pixels, then it is considered to be noise-dominated and hence unusable.
| Quadrant | # 1 sec bins | Bins with >0 counts | Bins with >2000 counts | High rate bins dominated by noise | Noise dominated (total time) | Noise dominated (detector-on time) | Marked lightcurve |
|---|---|---|---|---|---|---|---|
| A | 7649 | 6835 | 35 | 35 | 0.46% | 0.51% | 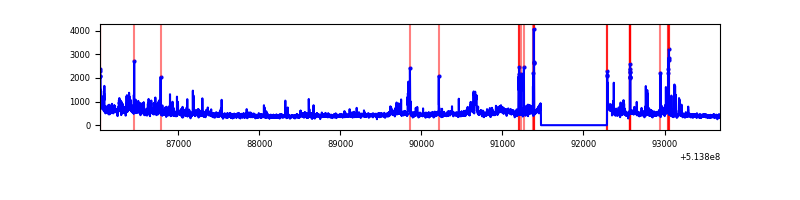 |
| B | 7649 | 6835 | 187 | 187 | 2.44% | 2.74% | 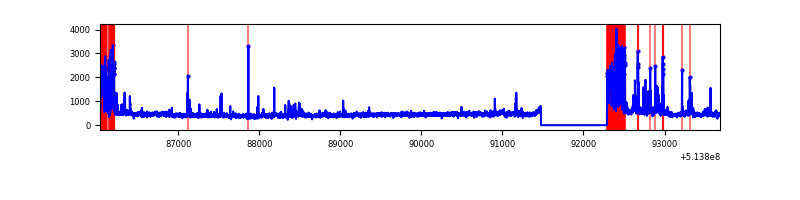 |
| C | 7649 | 6835 | 234 | 234 | 3.06% | 3.42% | 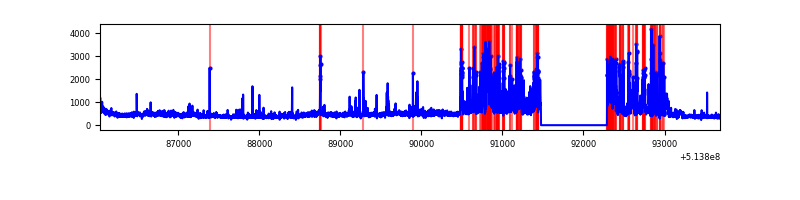 |
| D | 7648 | 6834 | 519 | 519 | 6.79% | 7.59% | 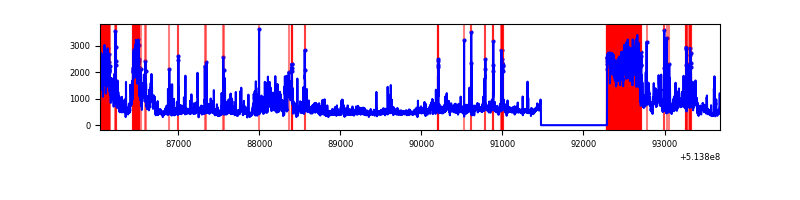 |
Top three noisy pixels from each quadrant. If the there are fewer than three noisy pixels in the level2.evt file, extra rows are filled as -1
| Pixel properties | Quadrant properties | ||||||
|---|---|---|---|---|---|---|---|
| Quadrant | DetID | PixID | Counts | Sigma | Mean | Median | Sigma |
| A | 3 | 14 | 470360 | 2606.38 | 730 | 711 | 180.2 |
| A | 13 | 248 | 74512 | 409.57 | 730 | 711 | 180.2 |
| A | 4 | 249 | 65445 | 359.25 | 730 | 711 | 180.2 |
| B | 10 | 16 | 670623 | 4473.24 | 704 | 678 | 149.8 |
| B | 0 | 63 | 156334 | 1039.32 | 704 | 678 | 149.8 |
| B | 10 | 32 | 27952 | 182.11 | 704 | 678 | 149.8 |
| C | 9 | 38 | 1325274 | 6960.48 | 695 | 689 | 190.3 |
| C | 1 | 16 | 142122 | 743.21 | 695 | 689 | 190.3 |
| C | 11 | 244 | 33957 | 174.82 | 695 | 689 | 190.3 |
| D | 15 | 142 | 2198832 | 11267.1 | 681 | 648 | 195.1 |
| D | 2 | 172 | 199056 | 1016.97 | 681 | 648 | 195.1 |
| D | 2 | 249 | 143123 | 730.28 | 681 | 648 | 195.1 |
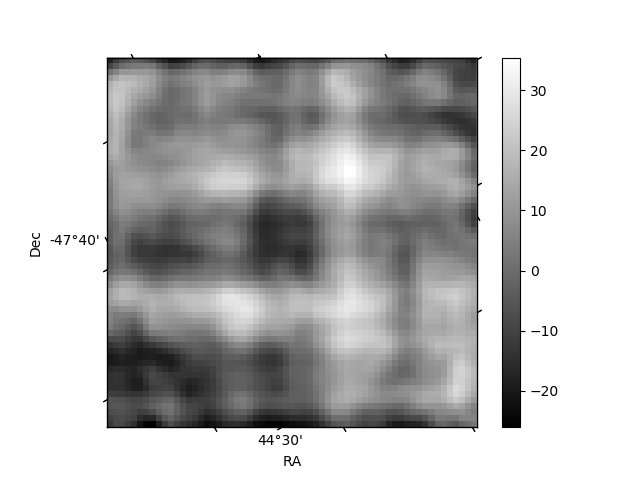
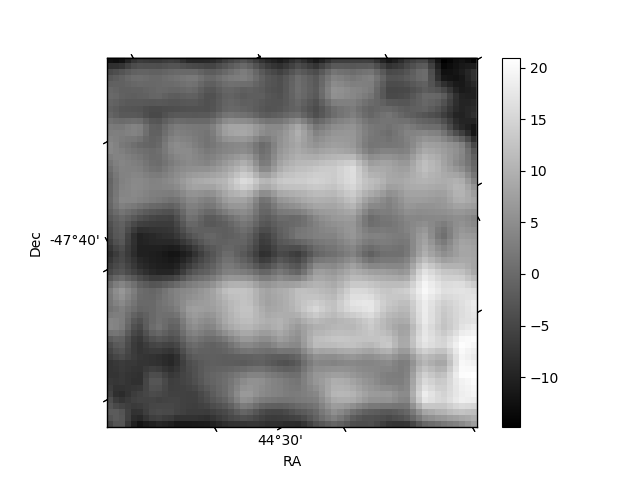
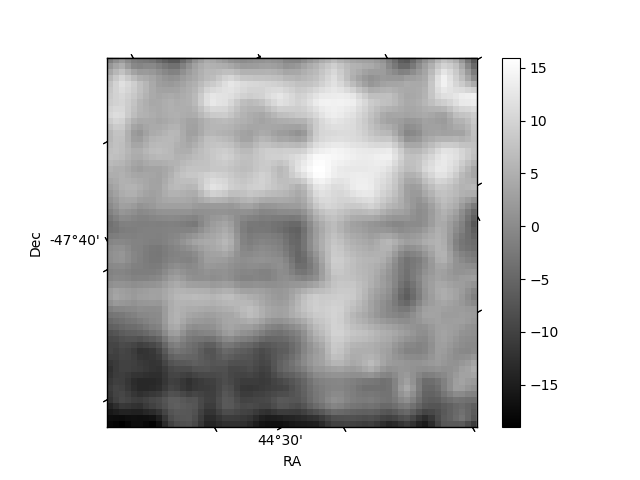
Histogram calculated using DETX and DETY for each event in the final _common_clean file
| Quadrant A | 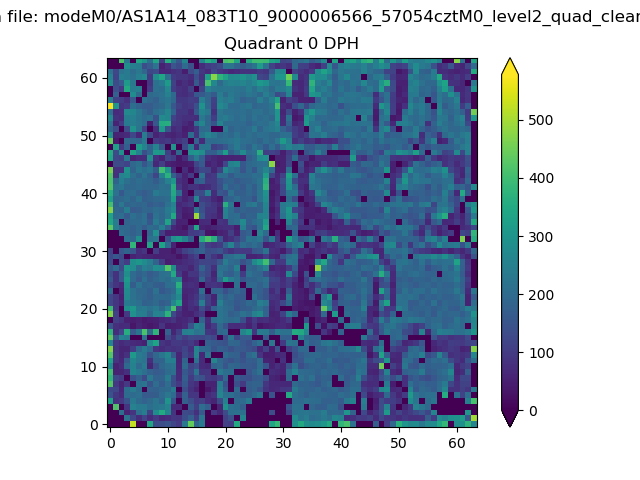 |
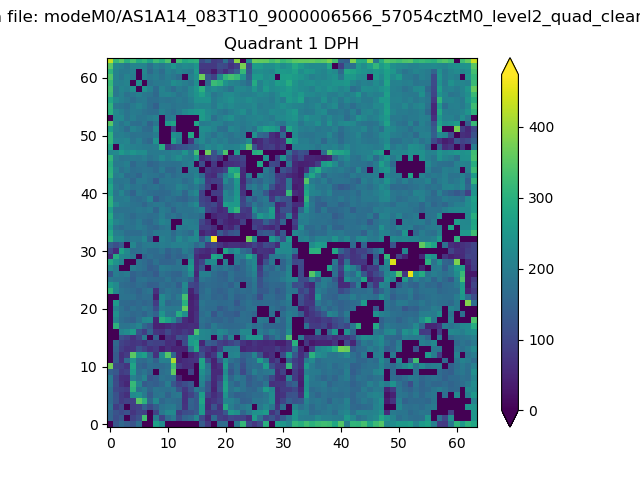 |
Quadrant B |
|---|---|---|---|
| Quadrant D | 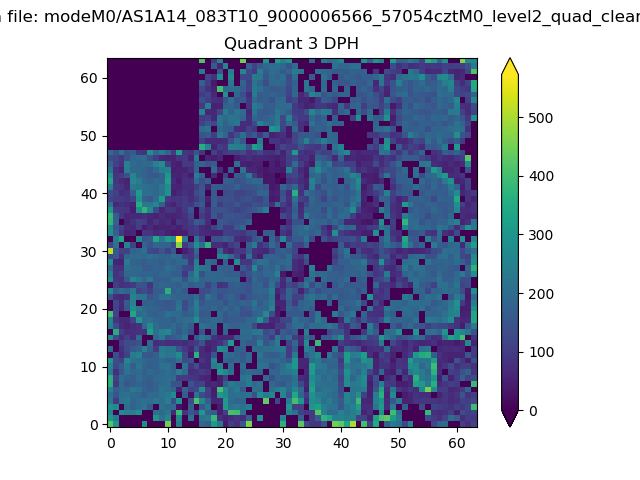 |
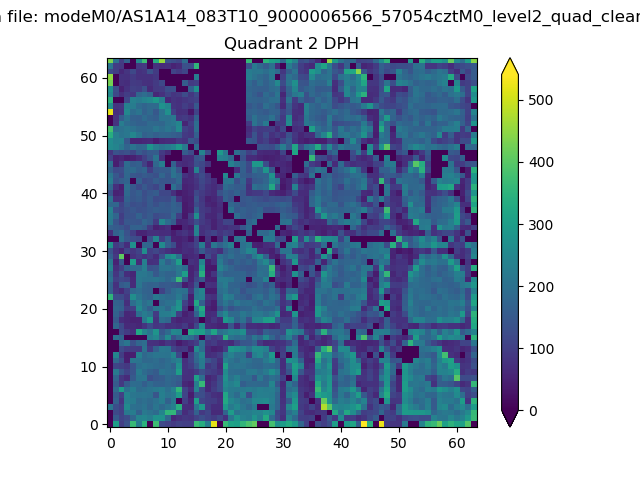 |
Quadrant C |
| Plot type | Count rate plots | Images |
|---|---|---|
| Comparison with Poisson distribution Blue bars denote a histogram of data divided into 1 sec bins. Red curve is a Poisson curve with rate = median count rate of data. |
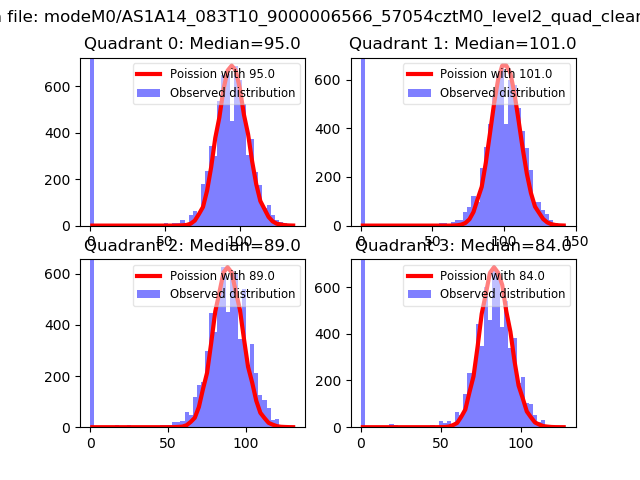 |
 |
| Quadrant-wise count rates Data is divided into 100 sec bins |
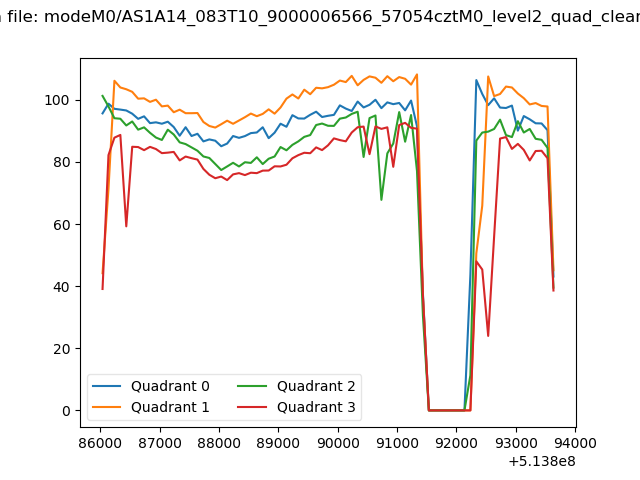 |
|
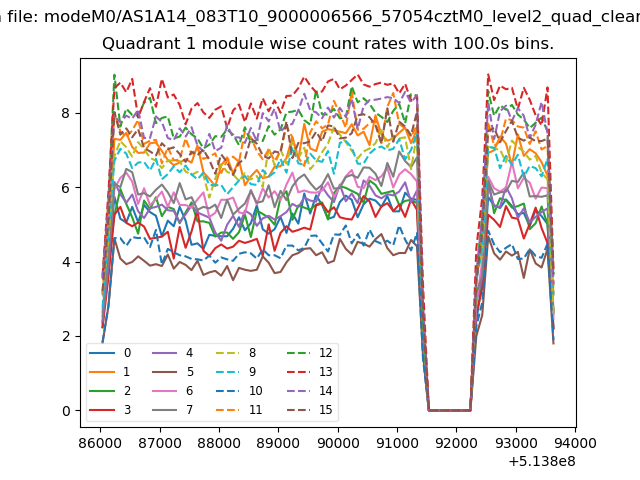
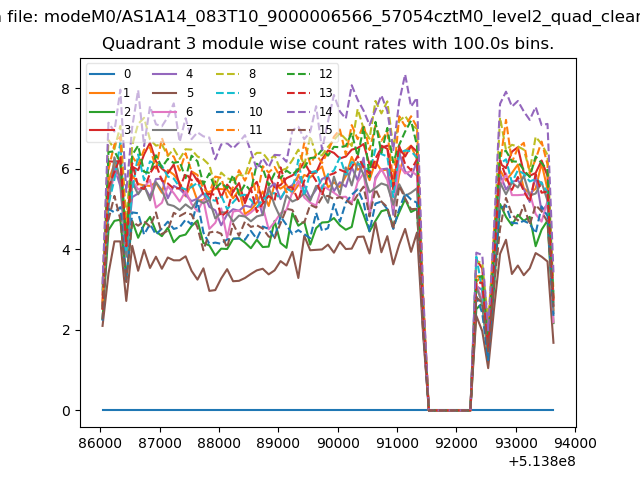
| Module-wise count rates for Quadrant A Data is divided into 100 sec bins |
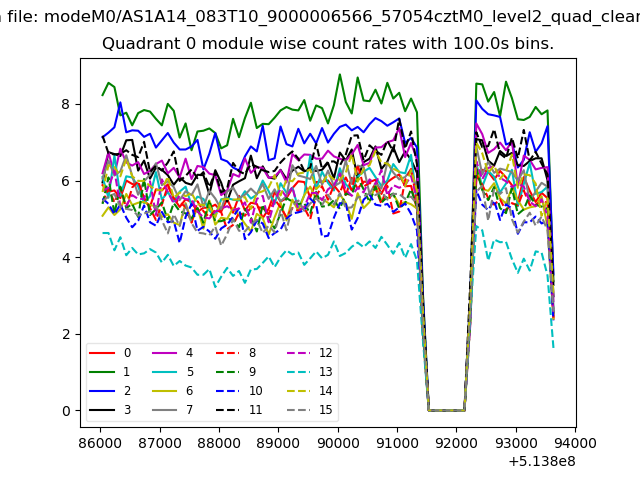 |
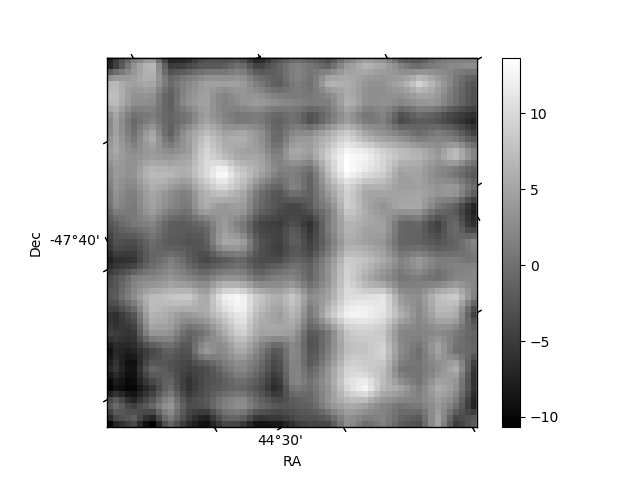 |
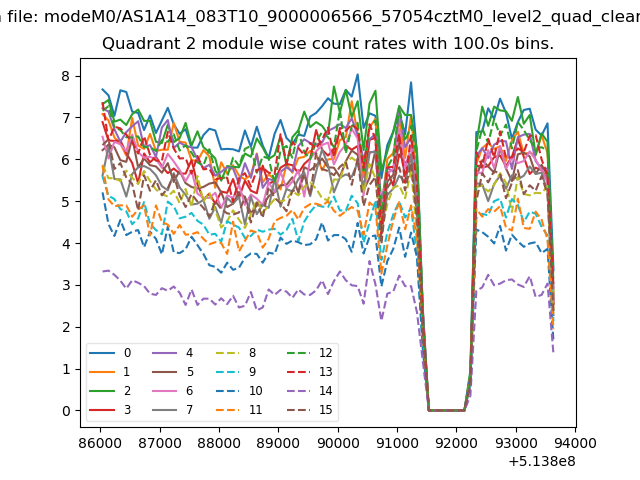
| Module-wise count rates for Quadrant B Data is divided into 100 sec bins |
 |
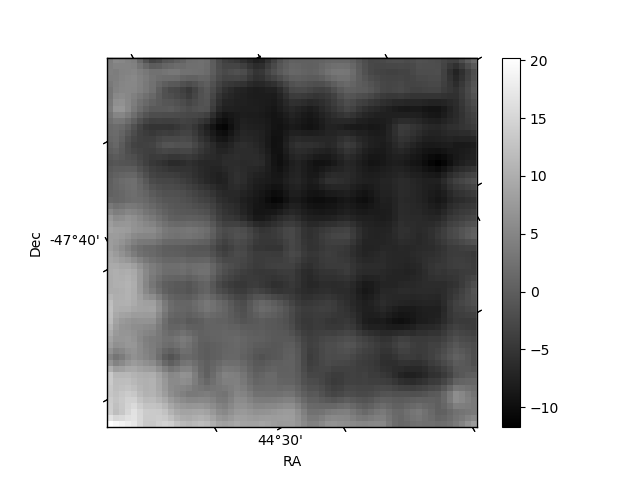 |
| Module-wise count rates for Quadrant C Data is divided into 100 sec bins |
 |
 |
| Module-wise count rates for Quadrant D Data is divided into 100 sec bins |
 |
 |
| Parameter | Plot |
|---|---|
| CZT HV Monitor | 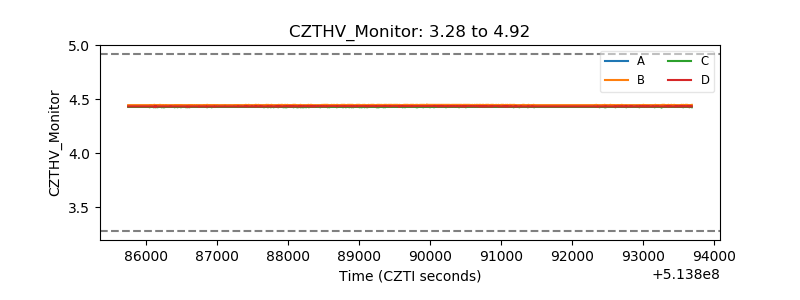 |
| D_VDD | 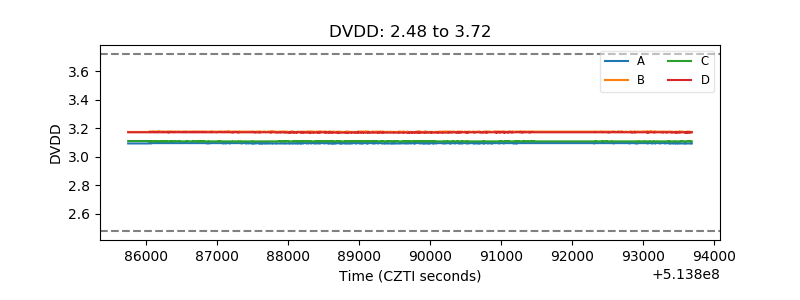 |
| Temperature 1 | 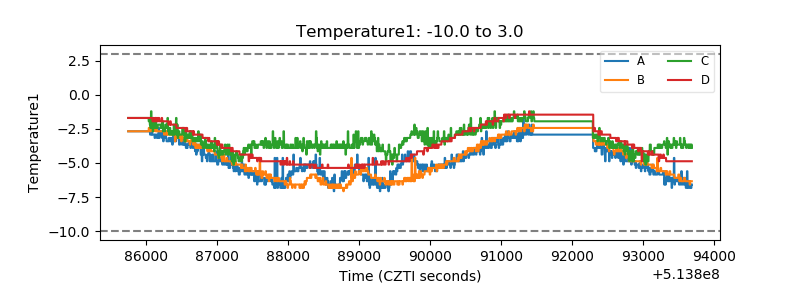 |
| Veto HV Monitor | 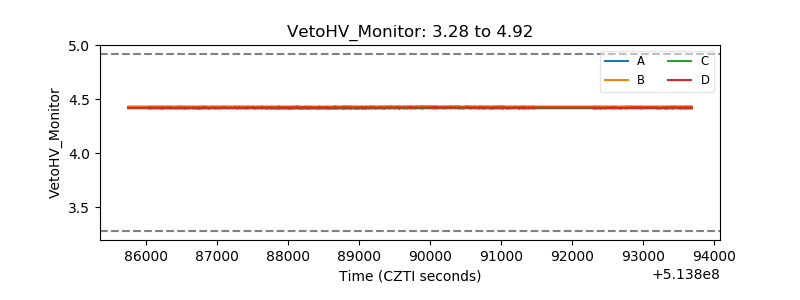 |
| Veto LLD | 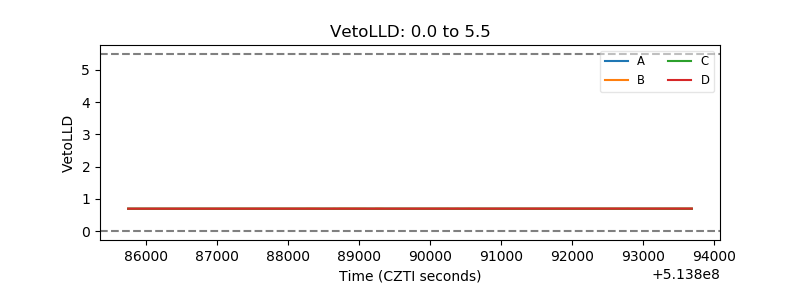 |
| Alpha Counter | 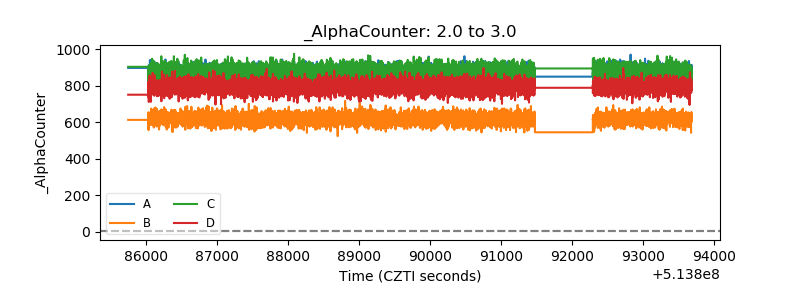 |
| _CPM_Rate | 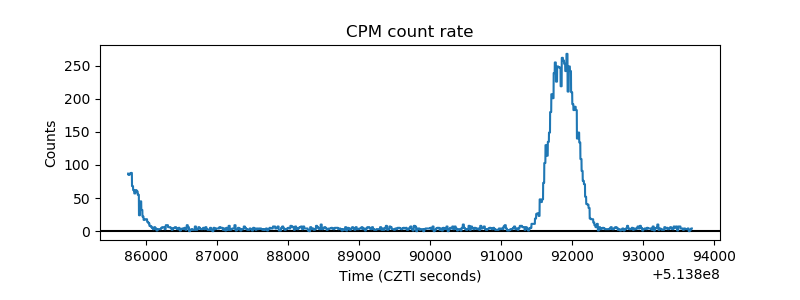 |
| CZT Counter | 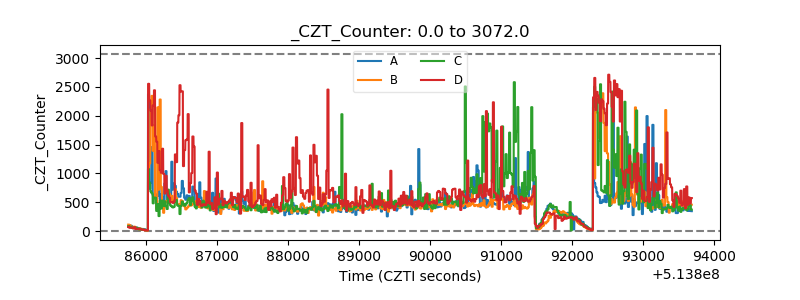 |
| +2.5 Volts monitor |  |
| +5 Volts monitor | 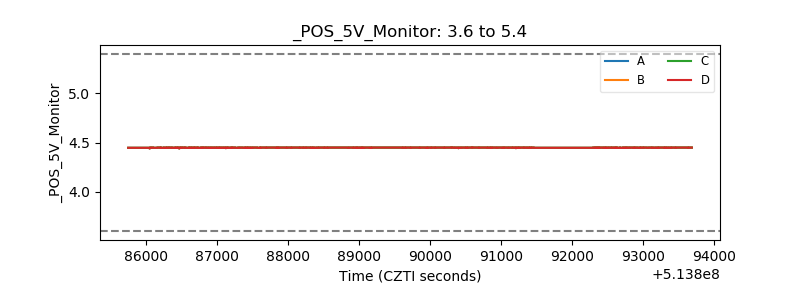 |
| _ROLL_ROT | 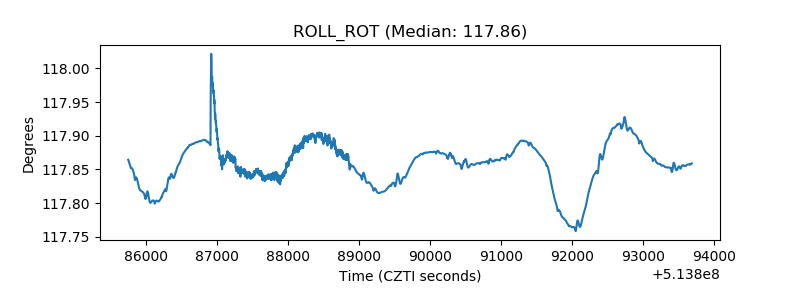 |
| _Roll_DEC | 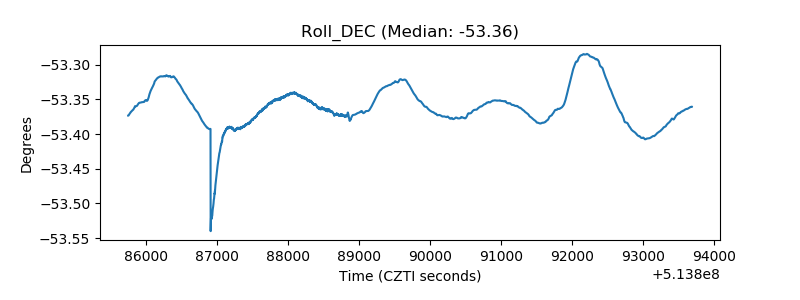 |
| _Roll_RA | 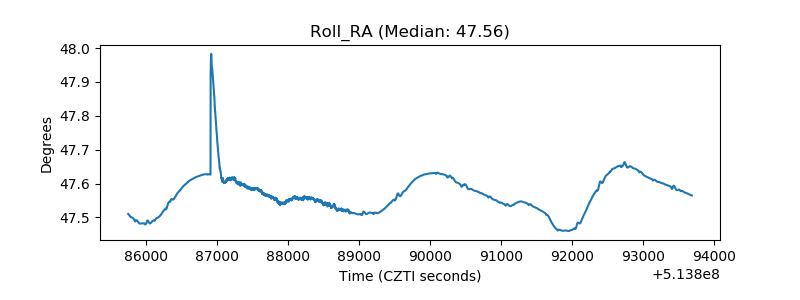 |
| Veto Counter | 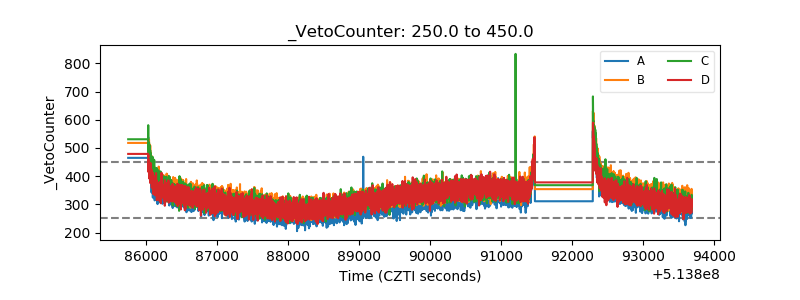 |